

Key Insights
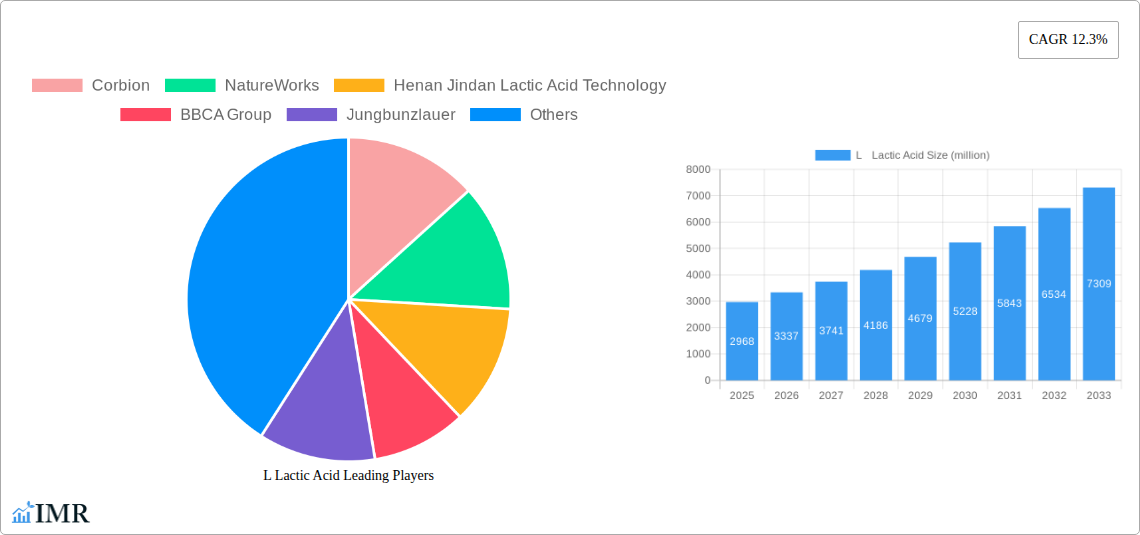
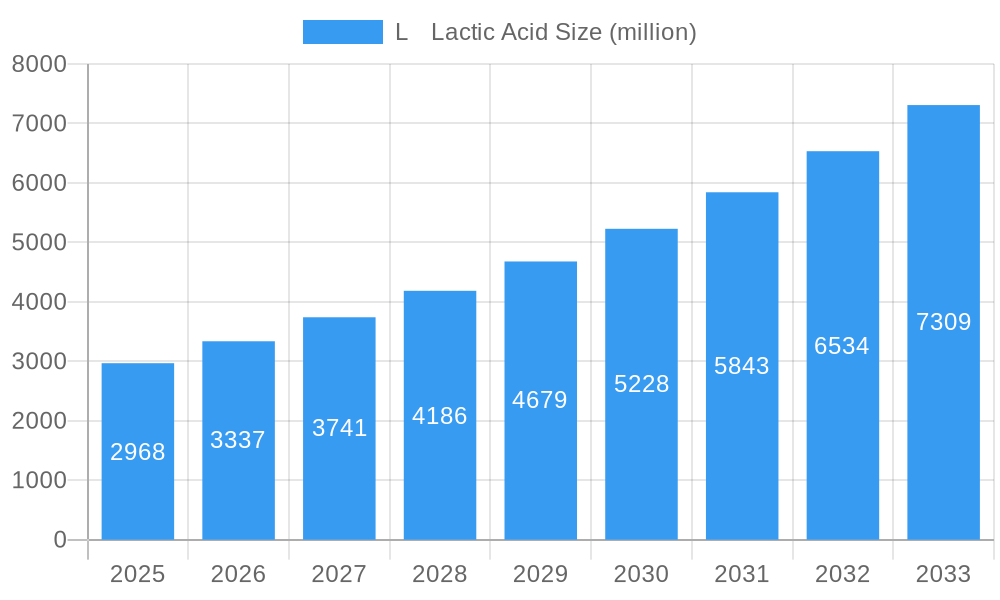
The L-lactic acid market, valued at $2968 million in 2025, is projected to experience robust growth, driven by increasing demand from the food and beverage, pharmaceutical, and cosmetic industries. The Compound Annual Growth Rate (CAGR) of 12.3% from 2025 to 2033 indicates a significant expansion opportunity. This growth is fueled by several key factors, including the rising consumer preference for natural and bio-based products, increasing applications of lactic acid in biodegradable plastics and polymers, and its established role as a food preservative and acidulant. Furthermore, advancements in fermentation technology are leading to more efficient and cost-effective production methods, further stimulating market expansion. Major players such as Corbion, NatureWorks, and Galactic are actively investing in research and development, aiming to enhance product quality and expand their market presence. The market is segmented by application (food & beverage, pharmaceuticals, cosmetics, plastics, others), production method (fermentation, chemical synthesis), and geography, offering diverse investment opportunities. While challenges like price volatility of raw materials and potential regulatory hurdles exist, the overall market outlook remains positive, promising substantial growth in the coming years.
L Lactic Acid Market Size (In Billion)
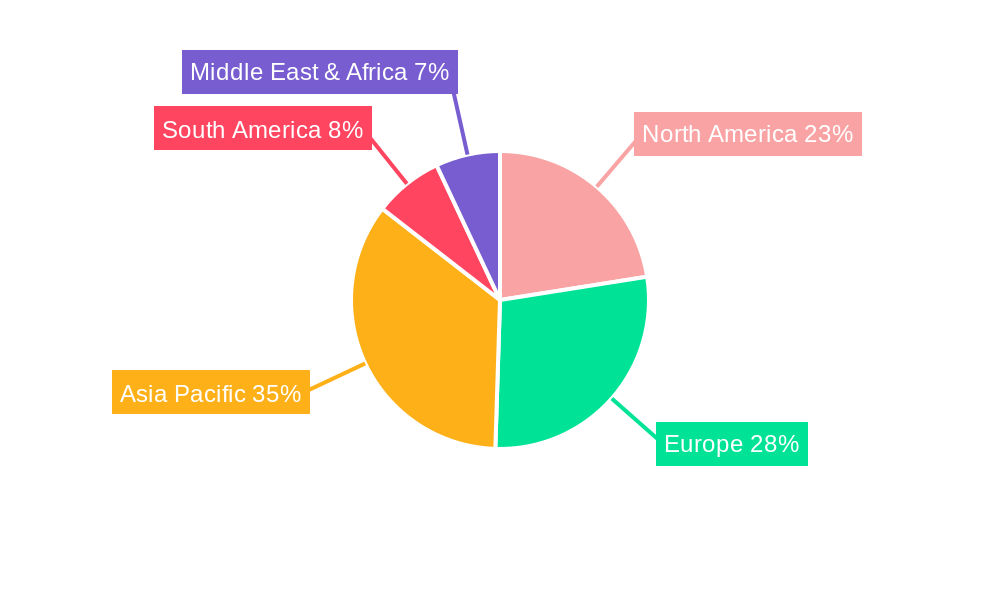
The competitive landscape is characterized by a mix of large multinational companies and regional players. While established companies benefit from economies of scale and brand recognition, smaller, agile companies are innovating with specialized products and applications. Strategic partnerships and mergers & acquisitions are expected to reshape the market dynamics in the coming years. Regional variations in demand are also noteworthy, with North America and Europe currently holding significant market shares, though Asia-Pacific is anticipated to witness the fastest growth due to increasing industrialization and rising disposable incomes. The expansion into emerging markets will be a key factor determining the market's future trajectory. Continued research and development into new applications and improved production processes will be crucial for sustaining this high growth rate.
L Lactic Acid Company Market Share
L-Lactic Acid Market Report: 2019-2033
This comprehensive report provides a detailed analysis of the L-Lactic Acid market, encompassing market dynamics, growth trends, regional segmentation, product landscape, key players, and future outlook. The study period covers 2019-2033, with 2025 as the base and estimated year. The forecast period spans 2025-2033, and the historical period encompasses 2019-2024. This report is crucial for industry professionals, investors, and strategic decision-makers seeking a thorough understanding of this dynamic market. The total market size in 2025 is estimated at 800 million units.
L Lactic Acid Market Dynamics & Structure
The L-Lactic Acid market is characterized by a moderately consolidated structure, with key players like Corbion, NatureWorks, and Jungbunzlauer holding significant market share. Technological innovations, particularly in fermentation processes and downstream purification, are key drivers of growth. Stringent regulatory frameworks concerning food safety and biodegradability influence product development and market access. Competitive pressures from substitute materials, such as other bio-based acids, are present but are offset by the growing demand for sustainable and biodegradable materials. M&A activity remains moderate, with a focus on strategic acquisitions to enhance production capacity and expand product portfolios. The parent market is the bio-based chemicals market, with the child market specifically focused on food additives, plastics, and cosmetics.
- Market Concentration: Moderately consolidated, with top 5 players holding approximately 60% market share in 2025.
- Technological Innovation: Focus on improving fermentation efficiency and reducing production costs.
- Regulatory Framework: Stringent food safety and environmental regulations drive product development.
- Competitive Substitutes: Other bio-based acids and synthetic polymers pose moderate competition.
- M&A Trends: Moderate activity, with strategic acquisitions for capacity expansion and diversification. An estimated xx M&A deals occurred between 2019 and 2024.
L Lactic Acid Growth Trends & Insights
The L-Lactic Acid market witnessed robust growth during the historical period (2019-2024), driven by increasing demand from various end-use sectors. The market size expanded from xx million units in 2019 to an estimated 650 million units in 2024, exhibiting a CAGR of xx%. This growth is anticipated to continue during the forecast period (2025-2033), propelled by factors such as rising consumer awareness of sustainable products, expanding applications in biodegradable plastics, and increasing investments in research and development. The adoption rate is projected to increase by xx% annually, driven by the rising demand for eco-friendly materials in various industries, such as food and packaging. Technological advancements, specifically in fermentation technology and purification processes, significantly contribute to the market's expansion. Shifting consumer preferences towards sustainable and environmentally friendly products create further market opportunities. The market is expected to reach 1200 million units by 2033, with a projected CAGR of xx% during the forecast period.
Dominant Regions, Countries, or Segments in L Lactic Acid
North America and Europe currently dominate the L-Lactic Acid market, owing to strong demand from the food and beverage, and plastics industries. Asia-Pacific is experiencing rapid growth, driven by increasing industrialization and rising consumer spending. The food and beverage segment holds the largest market share, followed by the plastics and cosmetics segments.
- Key Drivers (North America): Strong regulatory support for bio-based materials, well-established infrastructure.
- Key Drivers (Europe): High consumer awareness of sustainability, strong focus on environmental regulations.
- Key Drivers (Asia-Pacific): Rapid industrialization, increasing disposable incomes, growing demand from emerging economies.
- Market Share: North America holds approximately xx% of market share in 2025. Europe holds approximately xx%, while Asia Pacific holds xx%.
L Lactic Acid Product Landscape
L-Lactic Acid is available in various forms, including liquid and solid solutions. Recent innovations focus on enhancing purity and developing specialized grades for specific applications, such as high-purity lactic acid for pharmaceuticals. The unique selling proposition lies in its biodegradability and versatility across diverse applications, including food additives, biodegradable plastics (PLA), and cosmetic ingredients. Technological advancements focus on improving fermentation efficiency and reducing production costs, resulting in a more cost-competitive product.
Key Drivers, Barriers & Challenges in L Lactic Acid
Key Drivers: Growing demand for sustainable and biodegradable materials, rising consumer awareness of environmental concerns, increasing applications in biodegradable plastics and food additives, technological advancements in fermentation and purification.
Key Challenges: Fluctuations in raw material prices (e.g., corn, sugarcane), intense competition from synthetic alternatives, stringent regulatory requirements, and potential supply chain disruptions. The impact of these challenges is estimated to reduce the market growth by approximately xx% annually in the next five years.
Emerging Opportunities in L Lactic Acid
Untapped markets in developing economies, increasing demand for bio-based packaging materials, applications in bio-plastics and other emerging fields like pharmaceuticals and personal care products present significant growth opportunities. Innovation in product formulations and targeted marketing strategies to highlight the product's unique selling propositions also hold potential.
Growth Accelerators in the L Lactic Acid Industry
Technological breakthroughs in fermentation processes, strategic partnerships between chemical companies and bio-based material producers, and expansion into new geographical markets with high growth potential are key catalysts driving long-term market growth. Further research and development into new applications, such as in bio-based textiles and construction materials, will also stimulate market expansion.
Key Players Shaping the L Lactic Acid Market
- Corbion
- NatureWorks
- Henan Jindan Lactic Acid Technology
- BBCA Group
- Jungbunzlauer
- Galactic
- Henan Xinghan Biotechnology
- Beijing Capital Agribusiness & Foods Group
- Shandong Parkson Biotechnology
- Ningxia Qiyu Biochemical
- Musashino Chemical
- Wuhan Sanjiang Space Good Biotech
- Shangdong Fullsail
- Pliith Biotechnology
- Shanxi Leda Biochemical
Notable Milestones in L Lactic Acid Sector
- 2020: Corbion announced a significant expansion of its lactic acid production capacity.
- 2022: NatureWorks launched a new generation of PLA polymers with enhanced properties.
- 2023: Several key players invested in research and development for improved fermentation processes. (Specific details on investment amounts are unavailable - xx)
In-Depth L Lactic Acid Market Outlook
The L-Lactic Acid market is poised for continued growth driven by the increasing demand for sustainable materials, technological advancements, and expansion into new applications. Strategic partnerships and investments in R&D will further propel market expansion, presenting significant opportunities for companies involved in the production and utilization of L-Lactic Acid. The market is expected to show strong growth in emerging economies and new applications, thus creating a robust outlook for the foreseeable future.
L Lactic Acid Segmentation
-
1. Application
- 1.1. Food & Beverage
- 1.2. Polylactic Acid
- 1.3. Industrial
- 1.4. Pharmaceutical
- 1.5. Personal Care
- 1.6. Others
-
2. Type
- 2.1. High Purity Grade Lactic Acid
- 2.2. Food Grade Lactic Acid
- 2.3. Others
L Lactic Acid Segmentation By Geography
-
1. North America
- 1.1. United States
- 1.2. Canada
- 1.3. Mexico
-
2. South America
- 2.1. Brazil
- 2.2. Argentina
- 2.3. Rest of South America
-
3. Europe
- 3.1. United Kingdom
- 3.2. Germany
- 3.3. France
- 3.4. Italy
- 3.5. Spain
- 3.6. Russia
- 3.7. Benelux
- 3.8. Nordics
- 3.9. Rest of Europe
-
4. Middle East & Africa
- 4.1. Turkey
- 4.2. Israel
- 4.3. GCC
- 4.4. North Africa
- 4.5. South Africa
- 4.6. Rest of Middle East & Africa
-
5. Asia Pacific
- 5.1. China
- 5.2. India
- 5.3. Japan
- 5.4. South Korea
- 5.5. ASEAN
- 5.6. Oceania
- 5.7. Rest of Asia Pacific
L Lactic Acid Regional Market Share
Geographic Coverage of L Lactic Acid
L Lactic Acid REPORT HIGHLIGHTS
| Aspects | Details |
|---|---|
| Study Period | 2020-2034 |
| Base Year | 2025 |
| Estimated Year | 2026 |
| Forecast Period | 2026-2034 |
| Historical Period | 2020-2025 |
| Growth Rate | CAGR of 12.3% from 2020-2034 |
| Segmentation |
|
Table of Contents
- 1. Introduction
- 1.1. Research Scope
- 1.2. Market Segmentation
- 1.3. Research Methodology
- 1.4. Definitions and Assumptions
- 2. Executive Summary
- 2.1. Introduction
- 3. Market Dynamics
- 3.1. Introduction
- 3.2. Market Drivers
- 3.3. Market Restrains
- 3.4. Market Trends
- 4. Market Factor Analysis
- 4.1. Porters Five Forces
- 4.2. Supply/Value Chain
- 4.3. PESTEL analysis
- 4.4. Market Entropy
- 4.5. Patent/Trademark Analysis
- 5. Global L Lactic Acid Analysis, Insights and Forecast, 2020-2032
- 5.1. Market Analysis, Insights and Forecast - by Application
- 5.1.1. Food & Beverage
- 5.1.2. Polylactic Acid
- 5.1.3. Industrial
- 5.1.4. Pharmaceutical
- 5.1.5. Personal Care
- 5.1.6. Others
- 5.2. Market Analysis, Insights and Forecast - by Type
- 5.2.1. High Purity Grade Lactic Acid
- 5.2.2. Food Grade Lactic Acid
- 5.2.3. Others
- 5.3. Market Analysis, Insights and Forecast - by Region
- 5.3.1. North America
- 5.3.2. South America
- 5.3.3. Europe
- 5.3.4. Middle East & Africa
- 5.3.5. Asia Pacific
- 5.1. Market Analysis, Insights and Forecast - by Application
- 6. North America L Lactic Acid Analysis, Insights and Forecast, 2020-2032
- 6.1. Market Analysis, Insights and Forecast - by Application
- 6.1.1. Food & Beverage
- 6.1.2. Polylactic Acid
- 6.1.3. Industrial
- 6.1.4. Pharmaceutical
- 6.1.5. Personal Care
- 6.1.6. Others
- 6.2. Market Analysis, Insights and Forecast - by Type
- 6.2.1. High Purity Grade Lactic Acid
- 6.2.2. Food Grade Lactic Acid
- 6.2.3. Others
- 6.1. Market Analysis, Insights and Forecast - by Application
- 7. South America L Lactic Acid Analysis, Insights and Forecast, 2020-2032
- 7.1. Market Analysis, Insights and Forecast - by Application
- 7.1.1. Food & Beverage
- 7.1.2. Polylactic Acid
- 7.1.3. Industrial
- 7.1.4. Pharmaceutical
- 7.1.5. Personal Care
- 7.1.6. Others
- 7.2. Market Analysis, Insights and Forecast - by Type
- 7.2.1. High Purity Grade Lactic Acid
- 7.2.2. Food Grade Lactic Acid
- 7.2.3. Others
- 7.1. Market Analysis, Insights and Forecast - by Application
- 8. Europe L Lactic Acid Analysis, Insights and Forecast, 2020-2032
- 8.1. Market Analysis, Insights and Forecast - by Application
- 8.1.1. Food & Beverage
- 8.1.2. Polylactic Acid
- 8.1.3. Industrial
- 8.1.4. Pharmaceutical
- 8.1.5. Personal Care
- 8.1.6. Others
- 8.2. Market Analysis, Insights and Forecast - by Type
- 8.2.1. High Purity Grade Lactic Acid
- 8.2.2. Food Grade Lactic Acid
- 8.2.3. Others
- 8.1. Market Analysis, Insights and Forecast - by Application
- 9. Middle East & Africa L Lactic Acid Analysis, Insights and Forecast, 2020-2032
- 9.1. Market Analysis, Insights and Forecast - by Application
- 9.1.1. Food & Beverage
- 9.1.2. Polylactic Acid
- 9.1.3. Industrial
- 9.1.4. Pharmaceutical
- 9.1.5. Personal Care
- 9.1.6. Others
- 9.2. Market Analysis, Insights and Forecast - by Type
- 9.2.1. High Purity Grade Lactic Acid
- 9.2.2. Food Grade Lactic Acid
- 9.2.3. Others
- 9.1. Market Analysis, Insights and Forecast - by Application
- 10. Asia Pacific L Lactic Acid Analysis, Insights and Forecast, 2020-2032
- 10.1. Market Analysis, Insights and Forecast - by Application
- 10.1.1. Food & Beverage
- 10.1.2. Polylactic Acid
- 10.1.3. Industrial
- 10.1.4. Pharmaceutical
- 10.1.5. Personal Care
- 10.1.6. Others
- 10.2. Market Analysis, Insights and Forecast - by Type
- 10.2.1. High Purity Grade Lactic Acid
- 10.2.2. Food Grade Lactic Acid
- 10.2.3. Others
- 10.1. Market Analysis, Insights and Forecast - by Application
- 11. Competitive Analysis
- 11.1. Global Market Share Analysis 2025
- 11.2. Company Profiles
- 11.2.1 Corbion
- 11.2.1.1. Overview
- 11.2.1.2. Products
- 11.2.1.3. SWOT Analysis
- 11.2.1.4. Recent Developments
- 11.2.1.5. Financials (Based on Availability)
- 11.2.2 NatureWorks
- 11.2.2.1. Overview
- 11.2.2.2. Products
- 11.2.2.3. SWOT Analysis
- 11.2.2.4. Recent Developments
- 11.2.2.5. Financials (Based on Availability)
- 11.2.3 Henan Jindan Lactic Acid Technology
- 11.2.3.1. Overview
- 11.2.3.2. Products
- 11.2.3.3. SWOT Analysis
- 11.2.3.4. Recent Developments
- 11.2.3.5. Financials (Based on Availability)
- 11.2.4 BBCA Group
- 11.2.4.1. Overview
- 11.2.4.2. Products
- 11.2.4.3. SWOT Analysis
- 11.2.4.4. Recent Developments
- 11.2.4.5. Financials (Based on Availability)
- 11.2.5 Jungbunzlauer
- 11.2.5.1. Overview
- 11.2.5.2. Products
- 11.2.5.3. SWOT Analysis
- 11.2.5.4. Recent Developments
- 11.2.5.5. Financials (Based on Availability)
- 11.2.6 Galactic
- 11.2.6.1. Overview
- 11.2.6.2. Products
- 11.2.6.3. SWOT Analysis
- 11.2.6.4. Recent Developments
- 11.2.6.5. Financials (Based on Availability)
- 11.2.7 Henan Xinghan Biotechnology
- 11.2.7.1. Overview
- 11.2.7.2. Products
- 11.2.7.3. SWOT Analysis
- 11.2.7.4. Recent Developments
- 11.2.7.5. Financials (Based on Availability)
- 11.2.8 Beijing Capital Agribusiness & Foods Group
- 11.2.8.1. Overview
- 11.2.8.2. Products
- 11.2.8.3. SWOT Analysis
- 11.2.8.4. Recent Developments
- 11.2.8.5. Financials (Based on Availability)
- 11.2.9 Shandong Parkson Biotechnology
- 11.2.9.1. Overview
- 11.2.9.2. Products
- 11.2.9.3. SWOT Analysis
- 11.2.9.4. Recent Developments
- 11.2.9.5. Financials (Based on Availability)
- 11.2.10 Ningxia Qiyu Biochemical
- 11.2.10.1. Overview
- 11.2.10.2. Products
- 11.2.10.3. SWOT Analysis
- 11.2.10.4. Recent Developments
- 11.2.10.5. Financials (Based on Availability)
- 11.2.11 Musashino Chemical
- 11.2.11.1. Overview
- 11.2.11.2. Products
- 11.2.11.3. SWOT Analysis
- 11.2.11.4. Recent Developments
- 11.2.11.5. Financials (Based on Availability)
- 11.2.12 Wuhan Sanjiang Space Good Biotech
- 11.2.12.1. Overview
- 11.2.12.2. Products
- 11.2.12.3. SWOT Analysis
- 11.2.12.4. Recent Developments
- 11.2.12.5. Financials (Based on Availability)
- 11.2.13 Shangdong Fullsail
- 11.2.13.1. Overview
- 11.2.13.2. Products
- 11.2.13.3. SWOT Analysis
- 11.2.13.4. Recent Developments
- 11.2.13.5. Financials (Based on Availability)
- 11.2.14 Pliith Biotechnology
- 11.2.14.1. Overview
- 11.2.14.2. Products
- 11.2.14.3. SWOT Analysis
- 11.2.14.4. Recent Developments
- 11.2.14.5. Financials (Based on Availability)
- 11.2.15 Shanxi Leda Biochemical
- 11.2.15.1. Overview
- 11.2.15.2. Products
- 11.2.15.3. SWOT Analysis
- 11.2.15.4. Recent Developments
- 11.2.15.5. Financials (Based on Availability)
- 11.2.1 Corbion
List of Figures
- Figure 1: Global L Lactic Acid Revenue Breakdown (million, %) by Region 2025 & 2033
- Figure 2: North America L Lactic Acid Revenue (million), by Application 2025 & 2033
- Figure 3: North America L Lactic Acid Revenue Share (%), by Application 2025 & 2033
- Figure 4: North America L Lactic Acid Revenue (million), by Type 2025 & 2033
- Figure 5: North America L Lactic Acid Revenue Share (%), by Type 2025 & 2033
- Figure 6: North America L Lactic Acid Revenue (million), by Country 2025 & 2033
- Figure 7: North America L Lactic Acid Revenue Share (%), by Country 2025 & 2033
- Figure 8: South America L Lactic Acid Revenue (million), by Application 2025 & 2033
- Figure 9: South America L Lactic Acid Revenue Share (%), by Application 2025 & 2033
- Figure 10: South America L Lactic Acid Revenue (million), by Type 2025 & 2033
- Figure 11: South America L Lactic Acid Revenue Share (%), by Type 2025 & 2033
- Figure 12: South America L Lactic Acid Revenue (million), by Country 2025 & 2033
- Figure 13: South America L Lactic Acid Revenue Share (%), by Country 2025 & 2033
- Figure 14: Europe L Lactic Acid Revenue (million), by Application 2025 & 2033
- Figure 15: Europe L Lactic Acid Revenue Share (%), by Application 2025 & 2033
- Figure 16: Europe L Lactic Acid Revenue (million), by Type 2025 & 2033
- Figure 17: Europe L Lactic Acid Revenue Share (%), by Type 2025 & 2033
- Figure 18: Europe L Lactic Acid Revenue (million), by Country 2025 & 2033
- Figure 19: Europe L Lactic Acid Revenue Share (%), by Country 2025 & 2033
- Figure 20: Middle East & Africa L Lactic Acid Revenue (million), by Application 2025 & 2033
- Figure 21: Middle East & Africa L Lactic Acid Revenue Share (%), by Application 2025 & 2033
- Figure 22: Middle East & Africa L Lactic Acid Revenue (million), by Type 2025 & 2033
- Figure 23: Middle East & Africa L Lactic Acid Revenue Share (%), by Type 2025 & 2033
- Figure 24: Middle East & Africa L Lactic Acid Revenue (million), by Country 2025 & 2033
- Figure 25: Middle East & Africa L Lactic Acid Revenue Share (%), by Country 2025 & 2033
- Figure 26: Asia Pacific L Lactic Acid Revenue (million), by Application 2025 & 2033
- Figure 27: Asia Pacific L Lactic Acid Revenue Share (%), by Application 2025 & 2033
- Figure 28: Asia Pacific L Lactic Acid Revenue (million), by Type 2025 & 2033
- Figure 29: Asia Pacific L Lactic Acid Revenue Share (%), by Type 2025 & 2033
- Figure 30: Asia Pacific L Lactic Acid Revenue (million), by Country 2025 & 2033
- Figure 31: Asia Pacific L Lactic Acid Revenue Share (%), by Country 2025 & 2033
List of Tables
- Table 1: Global L Lactic Acid Revenue million Forecast, by Application 2020 & 2033
- Table 2: Global L Lactic Acid Revenue million Forecast, by Type 2020 & 2033
- Table 3: Global L Lactic Acid Revenue million Forecast, by Region 2020 & 2033
- Table 4: Global L Lactic Acid Revenue million Forecast, by Application 2020 & 2033
- Table 5: Global L Lactic Acid Revenue million Forecast, by Type 2020 & 2033
- Table 6: Global L Lactic Acid Revenue million Forecast, by Country 2020 & 2033
- Table 7: United States L Lactic Acid Revenue (million) Forecast, by Application 2020 & 2033
- Table 8: Canada L Lactic Acid Revenue (million) Forecast, by Application 2020 & 2033
- Table 9: Mexico L Lactic Acid Revenue (million) Forecast, by Application 2020 & 2033
- Table 10: Global L Lactic Acid Revenue million Forecast, by Application 2020 & 2033
- Table 11: Global L Lactic Acid Revenue million Forecast, by Type 2020 & 2033
- Table 12: Global L Lactic Acid Revenue million Forecast, by Country 2020 & 2033
- Table 13: Brazil L Lactic Acid Revenue (million) Forecast, by Application 2020 & 2033
- Table 14: Argentina L Lactic Acid Revenue (million) Forecast, by Application 2020 & 2033
- Table 15: Rest of South America L Lactic Acid Revenue (million) Forecast, by Application 2020 & 2033
- Table 16: Global L Lactic Acid Revenue million Forecast, by Application 2020 & 2033
- Table 17: Global L Lactic Acid Revenue million Forecast, by Type 2020 & 2033
- Table 18: Global L Lactic Acid Revenue million Forecast, by Country 2020 & 2033
- Table 19: United Kingdom L Lactic Acid Revenue (million) Forecast, by Application 2020 & 2033
- Table 20: Germany L Lactic Acid Revenue (million) Forecast, by Application 2020 & 2033
- Table 21: France L Lactic Acid Revenue (million) Forecast, by Application 2020 & 2033
- Table 22: Italy L Lactic Acid Revenue (million) Forecast, by Application 2020 & 2033
- Table 23: Spain L Lactic Acid Revenue (million) Forecast, by Application 2020 & 2033
- Table 24: Russia L Lactic Acid Revenue (million) Forecast, by Application 2020 & 2033
- Table 25: Benelux L Lactic Acid Revenue (million) Forecast, by Application 2020 & 2033
- Table 26: Nordics L Lactic Acid Revenue (million) Forecast, by Application 2020 & 2033
- Table 27: Rest of Europe L Lactic Acid Revenue (million) Forecast, by Application 2020 & 2033
- Table 28: Global L Lactic Acid Revenue million Forecast, by Application 2020 & 2033
- Table 29: Global L Lactic Acid Revenue million Forecast, by Type 2020 & 2033
- Table 30: Global L Lactic Acid Revenue million Forecast, by Country 2020 & 2033
- Table 31: Turkey L Lactic Acid Revenue (million) Forecast, by Application 2020 & 2033
- Table 32: Israel L Lactic Acid Revenue (million) Forecast, by Application 2020 & 2033
- Table 33: GCC L Lactic Acid Revenue (million) Forecast, by Application 2020 & 2033
- Table 34: North Africa L Lactic Acid Revenue (million) Forecast, by Application 2020 & 2033
- Table 35: South Africa L Lactic Acid Revenue (million) Forecast, by Application 2020 & 2033
- Table 36: Rest of Middle East & Africa L Lactic Acid Revenue (million) Forecast, by Application 2020 & 2033
- Table 37: Global L Lactic Acid Revenue million Forecast, by Application 2020 & 2033
- Table 38: Global L Lactic Acid Revenue million Forecast, by Type 2020 & 2033
- Table 39: Global L Lactic Acid Revenue million Forecast, by Country 2020 & 2033
- Table 40: China L Lactic Acid Revenue (million) Forecast, by Application 2020 & 2033
- Table 41: India L Lactic Acid Revenue (million) Forecast, by Application 2020 & 2033
- Table 42: Japan L Lactic Acid Revenue (million) Forecast, by Application 2020 & 2033
- Table 43: South Korea L Lactic Acid Revenue (million) Forecast, by Application 2020 & 2033
- Table 44: ASEAN L Lactic Acid Revenue (million) Forecast, by Application 2020 & 2033
- Table 45: Oceania L Lactic Acid Revenue (million) Forecast, by Application 2020 & 2033
- Table 46: Rest of Asia Pacific L Lactic Acid Revenue (million) Forecast, by Application 2020 & 2033
Frequently Asked Questions
1. What is the projected Compound Annual Growth Rate (CAGR) of the L Lactic Acid?
The projected CAGR is approximately 12.3%.
2. Which companies are prominent players in the L Lactic Acid?
Key companies in the market include Corbion, NatureWorks, Henan Jindan Lactic Acid Technology, BBCA Group, Jungbunzlauer, Galactic, Henan Xinghan Biotechnology, Beijing Capital Agribusiness & Foods Group, Shandong Parkson Biotechnology, Ningxia Qiyu Biochemical, Musashino Chemical, Wuhan Sanjiang Space Good Biotech, Shangdong Fullsail, Pliith Biotechnology, Shanxi Leda Biochemical.
3. What are the main segments of the L Lactic Acid?
The market segments include Application, Type.
4. Can you provide details about the market size?
The market size is estimated to be USD 2968 million as of 2022.
5. What are some drivers contributing to market growth?
N/A
6. What are the notable trends driving market growth?
N/A
7. Are there any restraints impacting market growth?
N/A
8. Can you provide examples of recent developments in the market?
N/A
9. What pricing options are available for accessing the report?
Pricing options include single-user, multi-user, and enterprise licenses priced at USD 4250.00, USD 6375.00, and USD 8500.00 respectively.
10. Is the market size provided in terms of value or volume?
The market size is provided in terms of value, measured in million.
11. Are there any specific market keywords associated with the report?
Yes, the market keyword associated with the report is "L Lactic Acid," which aids in identifying and referencing the specific market segment covered.
12. How do I determine which pricing option suits my needs best?
The pricing options vary based on user requirements and access needs. Individual users may opt for single-user licenses, while businesses requiring broader access may choose multi-user or enterprise licenses for cost-effective access to the report.
13. Are there any additional resources or data provided in the L Lactic Acid report?
While the report offers comprehensive insights, it's advisable to review the specific contents or supplementary materials provided to ascertain if additional resources or data are available.
14. How can I stay updated on further developments or reports in the L Lactic Acid?
To stay informed about further developments, trends, and reports in the L Lactic Acid, consider subscribing to industry newsletters, following relevant companies and organizations, or regularly checking reputable industry news sources and publications.
Methodology
Step 1 - Identification of Relevant Samples Size from Population Database


Step 2 - Approaches for Defining Global Market Size (Value, Volume* & Price*)

Note*: In applicable scenarios
Step 3 - Data Sources
Primary Research
- Web Analytics
- Survey Reports
- Research Institute
- Latest Research Reports
- Opinion Leaders
Secondary Research
- Annual Reports
- White Paper
- Latest Press Release
- Industry Association
- Paid Database
- Investor Presentations

Step 4 - Data Triangulation
Involves using different sources of information in order to increase the validity of a study
These sources are likely to be stakeholders in a program - participants, other researchers, program staff, other community members, and so on.
Then we put all data in single framework & apply various statistical tools to find out the dynamic on the market.
During the analysis stage, feedback from the stakeholder groups would be compared to determine areas of agreement as well as areas of divergence