

Key Insights
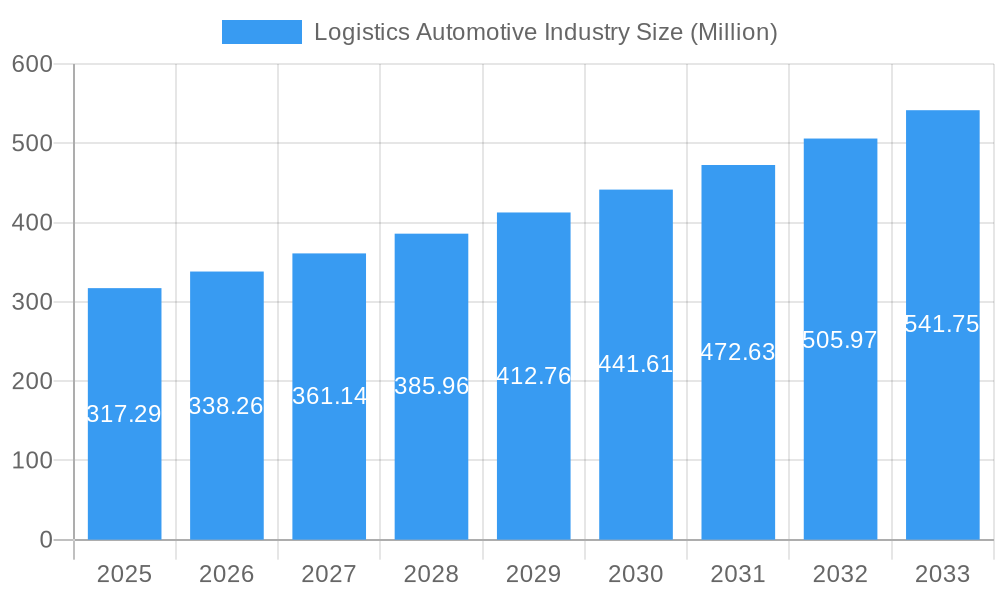
The automotive logistics market, valued at $317.29 million in 2025, is experiencing robust growth, projected to expand at a Compound Annual Growth Rate (CAGR) of 6.65% from 2025 to 2033. This expansion is driven by several key factors. The increasing global demand for automobiles, particularly in developing economies like those in Asia-Pacific, fuels the need for efficient and reliable transportation, warehousing, and distribution networks. Furthermore, the rise of just-in-time manufacturing and lean supply chain strategies necessitates specialized logistics solutions optimized for automotive components and finished vehicles. The growing adoption of advanced technologies such as telematics, IoT sensors, and AI-powered route optimization systems further enhances efficiency and reduces costs, contributing to market growth. While challenges exist, such as geopolitical instability and fluctuating fuel prices, the overall market outlook remains positive, propelled by long-term growth in automotive production and the continued focus on supply chain resilience.
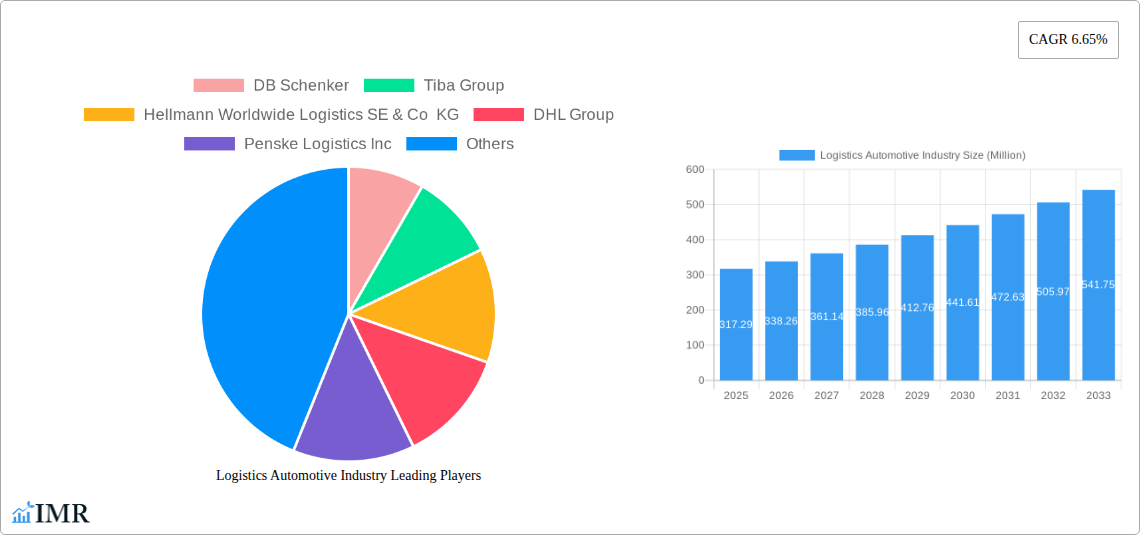
Logistics Automotive Industry Market Size (In Million)
The automotive logistics industry is segmented by service type (transportation, warehousing, distribution, inventory management, and other services) and by the type of automotive goods handled (finished vehicles, auto components, and other types). Major players like DB Schenker, DHL Group, Kuehne + Nagel, and others compete fiercely, constantly innovating to offer superior services. Regional variations exist, with Asia-Pacific projected to maintain a significant market share due to its expanding automotive manufacturing base and increasing consumer demand. North America and Europe also represent substantial markets, though their growth might be slightly slower than Asia-Pacific’s. The continued expansion of e-commerce and the increasing adoption of omnichannel strategies by auto manufacturers and dealers will further drive demand for specialized automotive logistics services in the coming years. This includes the increasing importance of last-mile delivery solutions to meet consumer expectations for timely and reliable vehicle delivery.
Logistics Automotive Industry Company Market Share
Logistics Automotive Industry: A Comprehensive Market Report (2019-2033)
This in-depth report provides a comprehensive analysis of the global Logistics Automotive Industry market, encompassing historical data (2019-2024), the base year (2025), and a detailed forecast (2025-2033). The report segments the market by service (Transportation, Warehousing, Distribution, Inventory Management, Other Services) and type (Finished Vehicle, Auto Components, Other Types), offering invaluable insights for industry professionals, investors, and strategists. The market size is presented in Million units throughout the report.
Logistics Automotive Industry Market Dynamics & Structure
The global automotive logistics market is a dynamic landscape characterized by high concentration among leading players and continuous technological innovation. The market structure is influenced by stringent regulatory frameworks, the availability of competitive product substitutes, and evolving end-user demographics. Mergers and acquisitions (M&A) activity plays a significant role in shaping market dynamics.
Market Concentration: The market exhibits moderate concentration, with major players such as DHL Group, DB Schenker, and Kuehne + Nagel holding significant market share (estimated at xx% combined in 2025). However, a large number of regional and specialized logistics providers also contribute significantly.
Technological Innovation Drivers: Automation (robotics, AI), real-time tracking & monitoring, and blockchain technology are driving efficiency and transparency, boosting the market. However, high initial investment costs and integration complexities represent barriers to entry for smaller companies.
Regulatory Frameworks: Government regulations related to emissions, safety, and data security impact operations and influence investment decisions. Compliance costs vary across regions, creating competitive advantages for companies with robust compliance strategies.
Competitive Product Substitutes: While dedicated automotive logistics providers are prevalent, competition arises from broader logistics companies diversifying their services. This competitive pressure fosters innovation and drives down prices.
End-User Demographics: The automotive industry's global shift toward electric vehicles and autonomous driving technologies influences the demand for specialized logistics services. Growing demand for just-in-time delivery necessitates agile and responsive logistics solutions.
M&A Trends: The automotive logistics sector witnesses frequent M&A activity, driven by companies seeking to expand their geographical reach, service portfolios, and technological capabilities. The number of deals is expected to remain substantial (xx deals annually from 2025 onward).
Logistics Automotive Industry Growth Trends & Insights
The global automotive logistics market has witnessed substantial growth over the historical period (2019-2024), driven by factors such as increasing global automotive production, expanding e-commerce, and the rise of advanced technologies. This growth is anticipated to continue throughout the forecast period (2025-2033). The market is expected to reach xx Million units by 2033, exhibiting a Compound Annual Growth Rate (CAGR) of xx% during the forecast period. This growth is fueled by several key factors:
- Market Size Evolution: The market size has grown from xx Million units in 2019 to an estimated xx Million units in 2025, demonstrating a consistent upward trend.
- Adoption Rates: The adoption of advanced logistics technologies is increasing, leading to improved efficiency and reducing operational costs. The penetration rate of real-time tracking and automated warehousing systems is projected to reach xx% by 2033.
- Technological Disruptions: The incorporation of AI, IoT, and blockchain technologies is revolutionizing supply chain management, leading to enhanced visibility and optimized operations.
- Consumer Behavior Shifts: The growing preference for customized vehicles and faster delivery times necessitates more efficient and flexible logistics solutions.
Dominant Regions, Countries, or Segments in Logistics Automotive Industry
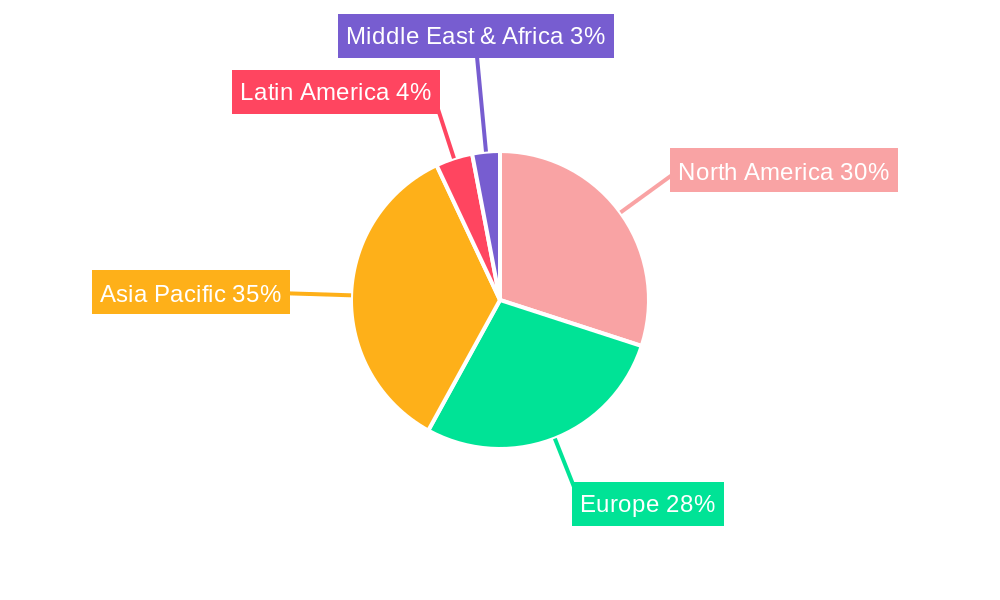
The North American and European regions dominate the automotive logistics market, driven by substantial automotive production volumes and well-established logistics infrastructure. Within the services segment, transportation accounts for the largest market share, followed by warehousing and distribution. In terms of vehicle type, finished vehicle logistics hold the largest market share.
Key Drivers:
- North America: Strong automotive production, robust infrastructure, and a developed logistics ecosystem drive market leadership.
- Europe: High automotive manufacturing density, advanced logistics networks, and government support for sustainable logistics solutions propel market growth.
- Asia-Pacific: Rapid growth in automotive production, particularly in China and India, creates a large and expanding market with significant potential.
- Transportation: High demand for efficient and reliable vehicle transportation, including rail, road, and sea freight.
- Finished Vehicle Logistics: This segment benefits from high vehicle production volumes and a need for specialized transportation and handling services.
Logistics Automotive Industry Product Landscape
The automotive logistics market offers a diverse range of services, from traditional transportation and warehousing to specialized solutions like just-in-time delivery, reverse logistics, and last-mile delivery. Product innovations focus on enhancing visibility, traceability, and efficiency through advanced technologies, such as real-time tracking systems, AI-powered route optimization, and blockchain-based supply chain management platforms. Key selling propositions include enhanced efficiency, cost savings, and reduced environmental impact through optimized transportation and warehousing solutions.
Key Drivers, Barriers & Challenges in Logistics Automotive Industry
Key Drivers:
- Growing Automotive Production: Global automotive production continues to increase, driving demand for logistics services.
- E-commerce Growth: Online sales of automotive parts and accessories require efficient last-mile delivery solutions.
- Technological Advancements: Automation and digitalization boost operational efficiency and reduce costs.
Key Challenges:
- Supply Chain Disruptions: Global events and unforeseen circumstances (e.g., pandemics, natural disasters) disrupt supply chains, leading to delays and increased costs. These disruptions have cost the industry an estimated xx Million units in lost revenue since 2020.
- Regulatory Hurdles: Stringent environmental regulations and safety standards increase compliance costs.
- Competitive Pressures: Intense competition amongst logistics providers necessitates continuous innovation and cost optimization.
Emerging Opportunities in Logistics Automotive Industry
- Expansion in Emerging Markets: Rapid automotive production growth in developing economies presents significant opportunities.
- Sustainable Logistics: Growing demand for environmentally friendly transportation and warehousing solutions opens new avenues.
- Advanced Technologies: The adoption of AI, blockchain, and IoT offers opportunities for enhanced efficiency and cost reduction.
Growth Accelerators in the Logistics Automotive Industry Industry
Long-term growth in the automotive logistics industry is driven by several factors: strategic partnerships between automotive manufacturers and logistics providers, increasing investments in advanced technologies, and the expansion into new and emerging markets. Technological breakthroughs, such as autonomous trucking and drone delivery, have the potential to significantly reshape the industry landscape in the coming years.
Key Players Shaping the Logistics Automotive Industry Market
- DB Schenker
- Tiba Group
- Hellmann Worldwide Logistics SE & Co KG
- DHL Group
- Penske Logistics Inc
- Kuehne + Nagel International AG
- BLG Logistics Group AG & Co KG
- CFR Rinkens
- CEVA Logistics
- Expeditors
- APL Logistics Ltd
- XPO Logistics Inc
- GEFCO SA
- Panalpina
- Bollore Logistics
- Kerry Logistics Network Ltd
- Ryder System Inc
- DSV Panalpina AS
Notable Milestones in Logistics Automotive Industry Sector
- December 2022: Delhivery acquired Algorhythm Tech Pvt Ltd for USD 17.99 Million, expanding its integrated supply chain solutions.
- August 2022: Bolloré Logistics expanded its Australian presence by acquiring Lynair Logistics.
In-Depth Logistics Automotive Industry Market Outlook
The automotive logistics market is poised for continued robust growth, driven by technological advancements, strategic partnerships, and expansion into emerging markets. The adoption of sustainable practices and innovative solutions will be crucial for companies to remain competitive and capitalize on future opportunities. The market is expected to witness further consolidation through M&A activities, leading to a more concentrated landscape dominated by large, globally integrated logistics providers.
Logistics Automotive Industry Segmentation
-
1. Service
- 1.1. Transportation
- 1.2. Warehous
- 1.3. Other Services
-
2. Type
- 2.1. Finished Vehicle
- 2.2. Auto Components
- 2.3. Other Types
Logistics Automotive Industry Segmentation By Geography
-
1. Asia Pacific
- 1.1. China
- 1.2. Japan
- 1.3. India
- 1.4. South Korea
- 1.5. Rest of Asia Pacific
-
2. North America
- 2.1. United States
- 2.2. Canada
- 2.3. Mexico
-
3. Europe
- 3.1. United Kingdom
- 3.2. Germany
- 3.3. Italy
- 3.4. Russia
- 3.5. France
- 3.6. Rest of Europe
-
4. Latin America
- 4.1. Brazil
- 4.2. Argentina
- 4.3. Rest of Latin America
- 5. Middle East
-
6. South Africa
- 6.1. United Arab Emirates
- 6.2. Saudi Arabia
- 6.3. Rest of Middle East
Logistics Automotive Industry Regional Market Share
Geographic Coverage of Logistics Automotive Industry
Logistics Automotive Industry REPORT HIGHLIGHTS
| Aspects | Details |
|---|---|
| Study Period | 2020-2034 |
| Base Year | 2025 |
| Estimated Year | 2026 |
| Forecast Period | 2026-2034 |
| Historical Period | 2020-2025 |
| Growth Rate | CAGR of 6.65% from 2020-2034 |
| Segmentation |
|
Table of Contents
- 1. Introduction
- 1.1. Research Scope
- 1.2. Market Segmentation
- 1.3. Research Objective
- 1.4. Definitions and Assumptions
- 2. Executive Summary
- 2.1. Market Snapshot
- 3. Market Dynamics
- 3.1. Market Drivers
- 3.2. Market Restrains
- 3.3. Market Trends
- 3.4. Market Opportunities
- 4. Market Factor Analysis
- 4.1. Porters Five Forces
- 4.1.1. Bargaining Power of Suppliers
- 4.1.2. Bargaining Power of Buyers
- 4.1.3. Threat of New Entrants
- 4.1.4. Threat of Substitutes
- 4.1.5. Competitive Rivalry
- 4.2. PESTEL analysis
- 4.3. BCG Analysis
- 4.3.1. Stars (High Growth, High Market Share)
- 4.3.2. Cash Cows (Low Growth, High Market Share)
- 4.3.3. Question Mark (High Growth, Low Market Share)
- 4.3.4. Dogs (Low Growth, Low Market Share)
- 4.4. Ansoff Matrix Analysis
- 4.5. Supply Chain Analysis
- 4.6. Regulatory Landscape
- 4.7. Current Market Potential and Opportunity Assessment (TAM–SAM–SOM Framework)
- 4.8. IMR Analyst Note
- 4.1. Porters Five Forces
- 5. Market Analysis, Insights and Forecast 2021-2033
- 5.1. Market Analysis, Insights and Forecast - by Service
- 5.1.1. Transportation
- 5.1.2. Warehous
- 5.1.3. Other Services
- 5.2. Market Analysis, Insights and Forecast - by Type
- 5.2.1. Finished Vehicle
- 5.2.2. Auto Components
- 5.2.3. Other Types
- 5.3. Market Analysis, Insights and Forecast - by Region
- 5.3.1. Asia Pacific
- 5.3.2. North America
- 5.3.3. Europe
- 5.3.4. Latin America
- 5.3.5. Middle East
- 5.3.6. South Africa
- 5.1. Market Analysis, Insights and Forecast - by Service
- 6. Global Logistics Automotive Industry Analysis, Insights and Forecast, 2021-2033
- 6.1. Market Analysis, Insights and Forecast - by Service
- 6.1.1. Transportation
- 6.1.2. Warehous
- 6.1.3. Other Services
- 6.2. Market Analysis, Insights and Forecast - by Type
- 6.2.1. Finished Vehicle
- 6.2.2. Auto Components
- 6.2.3. Other Types
- 6.1. Market Analysis, Insights and Forecast - by Service
- 7. Asia Pacific Logistics Automotive Industry Analysis, Insights and Forecast, 2020-2032
- 7.1. Market Analysis, Insights and Forecast - by Service
- 7.1.1. Transportation
- 7.1.2. Warehous
- 7.1.3. Other Services
- 7.2. Market Analysis, Insights and Forecast - by Type
- 7.2.1. Finished Vehicle
- 7.2.2. Auto Components
- 7.2.3. Other Types
- 7.1. Market Analysis, Insights and Forecast - by Service
- 8. North America Logistics Automotive Industry Analysis, Insights and Forecast, 2020-2032
- 8.1. Market Analysis, Insights and Forecast - by Service
- 8.1.1. Transportation
- 8.1.2. Warehous
- 8.1.3. Other Services
- 8.2. Market Analysis, Insights and Forecast - by Type
- 8.2.1. Finished Vehicle
- 8.2.2. Auto Components
- 8.2.3. Other Types
- 8.1. Market Analysis, Insights and Forecast - by Service
- 9. Europe Logistics Automotive Industry Analysis, Insights and Forecast, 2020-2032
- 9.1. Market Analysis, Insights and Forecast - by Service
- 9.1.1. Transportation
- 9.1.2. Warehous
- 9.1.3. Other Services
- 9.2. Market Analysis, Insights and Forecast - by Type
- 9.2.1. Finished Vehicle
- 9.2.2. Auto Components
- 9.2.3. Other Types
- 9.1. Market Analysis, Insights and Forecast - by Service
- 10. Latin America Logistics Automotive Industry Analysis, Insights and Forecast, 2020-2032
- 10.1. Market Analysis, Insights and Forecast - by Service
- 10.1.1. Transportation
- 10.1.2. Warehous
- 10.1.3. Other Services
- 10.2. Market Analysis, Insights and Forecast - by Type
- 10.2.1. Finished Vehicle
- 10.2.2. Auto Components
- 10.2.3. Other Types
- 10.1. Market Analysis, Insights and Forecast - by Service
- 11. Middle East Logistics Automotive Industry Analysis, Insights and Forecast, 2020-2032
- 11.1. Market Analysis, Insights and Forecast - by Service
- 11.1.1. Transportation
- 11.1.2. Warehous
- 11.1.3. Other Services
- 11.2. Market Analysis, Insights and Forecast - by Type
- 11.2.1. Finished Vehicle
- 11.2.2. Auto Components
- 11.2.3. Other Types
- 11.1. Market Analysis, Insights and Forecast - by Service
- 12. South Africa Logistics Automotive Industry Analysis, Insights and Forecast, 2020-2032
- 12.1. Market Analysis, Insights and Forecast - by Service
- 12.1.1. Transportation
- 12.1.2. Warehous
- 12.1.3. Other Services
- 12.2. Market Analysis, Insights and Forecast - by Type
- 12.2.1. Finished Vehicle
- 12.2.2. Auto Components
- 12.2.3. Other Types
- 12.1. Market Analysis, Insights and Forecast - by Service
- 13. Competitive Analysis
- 13.1. Company Profiles
- 13.1.1 DB Schenker
- 13.1.1.1. Company Overview
- 13.1.1.2. Products
- 13.1.1.3. Company Financials
- 13.1.1.4. SWOT Analysis
- 13.1.2 Tiba Group
- 13.1.2.1. Company Overview
- 13.1.2.2. Products
- 13.1.2.3. Company Financials
- 13.1.2.4. SWOT Analysis
- 13.1.3 Hellmann Worldwide Logistics SE & Co KG
- 13.1.3.1. Company Overview
- 13.1.3.2. Products
- 13.1.3.3. Company Financials
- 13.1.3.4. SWOT Analysis
- 13.1.4 DHL Group
- 13.1.4.1. Company Overview
- 13.1.4.2. Products
- 13.1.4.3. Company Financials
- 13.1.4.4. SWOT Analysis
- 13.1.5 Penske Logistics Inc
- 13.1.5.1. Company Overview
- 13.1.5.2. Products
- 13.1.5.3. Company Financials
- 13.1.5.4. SWOT Analysis
- 13.1.6 Kuehne + Nagel International AG
- 13.1.6.1. Company Overview
- 13.1.6.2. Products
- 13.1.6.3. Company Financials
- 13.1.6.4. SWOT Analysis
- 13.1.7 BLG Logistics Group AG & Co KG
- 13.1.7.1. Company Overview
- 13.1.7.2. Products
- 13.1.7.3. Company Financials
- 13.1.7.4. SWOT Analysis
- 13.1.8 CFR Rinkens**List Not Exhaustive
- 13.1.8.1. Company Overview
- 13.1.8.2. Products
- 13.1.8.3. Company Financials
- 13.1.8.4. SWOT Analysis
- 13.1.9 CEVA Logistics
- 13.1.9.1. Company Overview
- 13.1.9.2. Products
- 13.1.9.3. Company Financials
- 13.1.9.4. SWOT Analysis
- 13.1.10 Expeditors
- 13.1.10.1. Company Overview
- 13.1.10.2. Products
- 13.1.10.3. Company Financials
- 13.1.10.4. SWOT Analysis
- 13.1.11 APL Logistics Ltd
- 13.1.11.1. Company Overview
- 13.1.11.2. Products
- 13.1.11.3. Company Financials
- 13.1.11.4. SWOT Analysis
- 13.1.12 XPO Logistics Inc
- 13.1.12.1. Company Overview
- 13.1.12.2. Products
- 13.1.12.3. Company Financials
- 13.1.12.4. SWOT Analysis
- 13.1.13 GEFCO SA
- 13.1.13.1. Company Overview
- 13.1.13.2. Products
- 13.1.13.3. Company Financials
- 13.1.13.4. SWOT Analysis
- 13.1.14 Panalpina
- 13.1.14.1. Company Overview
- 13.1.14.2. Products
- 13.1.14.3. Company Financials
- 13.1.14.4. SWOT Analysis
- 13.1.15 Bollore Logistics
- 13.1.15.1. Company Overview
- 13.1.15.2. Products
- 13.1.15.3. Company Financials
- 13.1.15.4. SWOT Analysis
- 13.1.16 Kerry Logistics Network Ltd
- 13.1.16.1. Company Overview
- 13.1.16.2. Products
- 13.1.16.3. Company Financials
- 13.1.16.4. SWOT Analysis
- 13.1.17 Ryder System Inc
- 13.1.17.1. Company Overview
- 13.1.17.2. Products
- 13.1.17.3. Company Financials
- 13.1.17.4. SWOT Analysis
- 13.1.18 DSV Panalpina AS
- 13.1.18.1. Company Overview
- 13.1.18.2. Products
- 13.1.18.3. Company Financials
- 13.1.18.4. SWOT Analysis
- 13.1.1 DB Schenker
- 13.2. Market Entropy
- 13.2.1 Company's Key Areas Served
- 13.2.2 Recent Developments
- 13.3. Company Market Share Analysis 2025
- 13.3.1 Top 5 Companies Market Share Analysis
- 13.3.2 Top 3 Companies Market Share Analysis
- 13.4. List of Potential Customers
- 14. Research Methodology
List of Figures
- Figure 1: Global Logistics Automotive Industry Revenue Breakdown (Million, %) by Region 2025 & 2033
- Figure 2: Asia Pacific Logistics Automotive Industry Revenue (Million), by Service 2025 & 2033
- Figure 3: Asia Pacific Logistics Automotive Industry Revenue Share (%), by Service 2025 & 2033
- Figure 4: Asia Pacific Logistics Automotive Industry Revenue (Million), by Type 2025 & 2033
- Figure 5: Asia Pacific Logistics Automotive Industry Revenue Share (%), by Type 2025 & 2033
- Figure 6: Asia Pacific Logistics Automotive Industry Revenue (Million), by Country 2025 & 2033
- Figure 7: Asia Pacific Logistics Automotive Industry Revenue Share (%), by Country 2025 & 2033
- Figure 8: North America Logistics Automotive Industry Revenue (Million), by Service 2025 & 2033
- Figure 9: North America Logistics Automotive Industry Revenue Share (%), by Service 2025 & 2033
- Figure 10: North America Logistics Automotive Industry Revenue (Million), by Type 2025 & 2033
- Figure 11: North America Logistics Automotive Industry Revenue Share (%), by Type 2025 & 2033
- Figure 12: North America Logistics Automotive Industry Revenue (Million), by Country 2025 & 2033
- Figure 13: North America Logistics Automotive Industry Revenue Share (%), by Country 2025 & 2033
- Figure 14: Europe Logistics Automotive Industry Revenue (Million), by Service 2025 & 2033
- Figure 15: Europe Logistics Automotive Industry Revenue Share (%), by Service 2025 & 2033
- Figure 16: Europe Logistics Automotive Industry Revenue (Million), by Type 2025 & 2033
- Figure 17: Europe Logistics Automotive Industry Revenue Share (%), by Type 2025 & 2033
- Figure 18: Europe Logistics Automotive Industry Revenue (Million), by Country 2025 & 2033
- Figure 19: Europe Logistics Automotive Industry Revenue Share (%), by Country 2025 & 2033
- Figure 20: Latin America Logistics Automotive Industry Revenue (Million), by Service 2025 & 2033
- Figure 21: Latin America Logistics Automotive Industry Revenue Share (%), by Service 2025 & 2033
- Figure 22: Latin America Logistics Automotive Industry Revenue (Million), by Type 2025 & 2033
- Figure 23: Latin America Logistics Automotive Industry Revenue Share (%), by Type 2025 & 2033
- Figure 24: Latin America Logistics Automotive Industry Revenue (Million), by Country 2025 & 2033
- Figure 25: Latin America Logistics Automotive Industry Revenue Share (%), by Country 2025 & 2033
- Figure 26: Middle East Logistics Automotive Industry Revenue (Million), by Service 2025 & 2033
- Figure 27: Middle East Logistics Automotive Industry Revenue Share (%), by Service 2025 & 2033
- Figure 28: Middle East Logistics Automotive Industry Revenue (Million), by Type 2025 & 2033
- Figure 29: Middle East Logistics Automotive Industry Revenue Share (%), by Type 2025 & 2033
- Figure 30: Middle East Logistics Automotive Industry Revenue (Million), by Country 2025 & 2033
- Figure 31: Middle East Logistics Automotive Industry Revenue Share (%), by Country 2025 & 2033
- Figure 32: South Africa Logistics Automotive Industry Revenue (Million), by Service 2025 & 2033
- Figure 33: South Africa Logistics Automotive Industry Revenue Share (%), by Service 2025 & 2033
- Figure 34: South Africa Logistics Automotive Industry Revenue (Million), by Type 2025 & 2033
- Figure 35: South Africa Logistics Automotive Industry Revenue Share (%), by Type 2025 & 2033
- Figure 36: South Africa Logistics Automotive Industry Revenue (Million), by Country 2025 & 2033
- Figure 37: South Africa Logistics Automotive Industry Revenue Share (%), by Country 2025 & 2033
List of Tables
- Table 1: Global Logistics Automotive Industry Revenue Million Forecast, by Service 2020 & 2033
- Table 2: Global Logistics Automotive Industry Revenue Million Forecast, by Type 2020 & 2033
- Table 3: Global Logistics Automotive Industry Revenue Million Forecast, by Region 2020 & 2033
- Table 4: Global Logistics Automotive Industry Revenue Million Forecast, by Service 2020 & 2033
- Table 5: Global Logistics Automotive Industry Revenue Million Forecast, by Type 2020 & 2033
- Table 6: Global Logistics Automotive Industry Revenue Million Forecast, by Country 2020 & 2033
- Table 7: China Logistics Automotive Industry Revenue (Million) Forecast, by Application 2020 & 2033
- Table 8: Japan Logistics Automotive Industry Revenue (Million) Forecast, by Application 2020 & 2033
- Table 9: India Logistics Automotive Industry Revenue (Million) Forecast, by Application 2020 & 2033
- Table 10: South Korea Logistics Automotive Industry Revenue (Million) Forecast, by Application 2020 & 2033
- Table 11: Rest of Asia Pacific Logistics Automotive Industry Revenue (Million) Forecast, by Application 2020 & 2033
- Table 12: Global Logistics Automotive Industry Revenue Million Forecast, by Service 2020 & 2033
- Table 13: Global Logistics Automotive Industry Revenue Million Forecast, by Type 2020 & 2033
- Table 14: Global Logistics Automotive Industry Revenue Million Forecast, by Country 2020 & 2033
- Table 15: United States Logistics Automotive Industry Revenue (Million) Forecast, by Application 2020 & 2033
- Table 16: Canada Logistics Automotive Industry Revenue (Million) Forecast, by Application 2020 & 2033
- Table 17: Mexico Logistics Automotive Industry Revenue (Million) Forecast, by Application 2020 & 2033
- Table 18: Global Logistics Automotive Industry Revenue Million Forecast, by Service 2020 & 2033
- Table 19: Global Logistics Automotive Industry Revenue Million Forecast, by Type 2020 & 2033
- Table 20: Global Logistics Automotive Industry Revenue Million Forecast, by Country 2020 & 2033
- Table 21: United Kingdom Logistics Automotive Industry Revenue (Million) Forecast, by Application 2020 & 2033
- Table 22: Germany Logistics Automotive Industry Revenue (Million) Forecast, by Application 2020 & 2033
- Table 23: Italy Logistics Automotive Industry Revenue (Million) Forecast, by Application 2020 & 2033
- Table 24: Russia Logistics Automotive Industry Revenue (Million) Forecast, by Application 2020 & 2033
- Table 25: France Logistics Automotive Industry Revenue (Million) Forecast, by Application 2020 & 2033
- Table 26: Rest of Europe Logistics Automotive Industry Revenue (Million) Forecast, by Application 2020 & 2033
- Table 27: Global Logistics Automotive Industry Revenue Million Forecast, by Service 2020 & 2033
- Table 28: Global Logistics Automotive Industry Revenue Million Forecast, by Type 2020 & 2033
- Table 29: Global Logistics Automotive Industry Revenue Million Forecast, by Country 2020 & 2033
- Table 30: Brazil Logistics Automotive Industry Revenue (Million) Forecast, by Application 2020 & 2033
- Table 31: Argentina Logistics Automotive Industry Revenue (Million) Forecast, by Application 2020 & 2033
- Table 32: Rest of Latin America Logistics Automotive Industry Revenue (Million) Forecast, by Application 2020 & 2033
- Table 33: Global Logistics Automotive Industry Revenue Million Forecast, by Service 2020 & 2033
- Table 34: Global Logistics Automotive Industry Revenue Million Forecast, by Type 2020 & 2033
- Table 35: Global Logistics Automotive Industry Revenue Million Forecast, by Country 2020 & 2033
- Table 36: Global Logistics Automotive Industry Revenue Million Forecast, by Service 2020 & 2033
- Table 37: Global Logistics Automotive Industry Revenue Million Forecast, by Type 2020 & 2033
- Table 38: Global Logistics Automotive Industry Revenue Million Forecast, by Country 2020 & 2033
- Table 39: United Arab Emirates Logistics Automotive Industry Revenue (Million) Forecast, by Application 2020 & 2033
- Table 40: Saudi Arabia Logistics Automotive Industry Revenue (Million) Forecast, by Application 2020 & 2033
- Table 41: Rest of Middle East Logistics Automotive Industry Revenue (Million) Forecast, by Application 2020 & 2033
Frequently Asked Questions
1. What is the projected Compound Annual Growth Rate (CAGR) of the Logistics Automotive Industry?
The projected CAGR is approximately 6.65%.
2. Which companies are prominent players in the Logistics Automotive Industry?
Key companies in the market include DB Schenker, Tiba Group, Hellmann Worldwide Logistics SE & Co KG, DHL Group, Penske Logistics Inc, Kuehne + Nagel International AG, BLG Logistics Group AG & Co KG, CFR Rinkens**List Not Exhaustive, CEVA Logistics, Expeditors, APL Logistics Ltd, XPO Logistics Inc, GEFCO SA, Panalpina, Bollore Logistics, Kerry Logistics Network Ltd, Ryder System Inc, DSV Panalpina AS.
3. What are the main segments of the Logistics Automotive Industry?
The market segments include Service, Type.
4. Can you provide details about the market size?
The market size is estimated to be USD 317.29 Million as of 2022.
5. What are some drivers contributing to market growth?
4.; Rise In Agriculture Sector and Food Industry4.; Rise In Pharmaceutical Industry.
6. What are the notable trends driving market growth?
Positive Outlook for the Automotive Sales and Production Demands Efficient Logistics Services.
7. Are there any restraints impacting market growth?
4.; Cost Constraints4.; Infrastructure Accessibility.
8. Can you provide examples of recent developments in the market?
December 2022: Delhivery, a provider of logistics services, announced the acquisition of Algorhythm Tech Pvt Ltd of Pune for INR 14.9 crores (USD 17.99 Million) in an all-cash purchase to expand its integrated supply chain solutions portfolio. By the end of January 2023, Delhivery anticipates the acquisition to be completed. At this point, Algorhythm Tech will function as a fully-owned subsidiary of the logistics company based in Gurugram.
9. What pricing options are available for accessing the report?
Pricing options include single-user, multi-user, and enterprise licenses priced at USD 4750, USD 5250, and USD 8750 respectively.
10. Is the market size provided in terms of value or volume?
The market size is provided in terms of value, measured in Million.
11. Are there any specific market keywords associated with the report?
Yes, the market keyword associated with the report is "Logistics Automotive Industry," which aids in identifying and referencing the specific market segment covered.
12. How do I determine which pricing option suits my needs best?
The pricing options vary based on user requirements and access needs. Individual users may opt for single-user licenses, while businesses requiring broader access may choose multi-user or enterprise licenses for cost-effective access to the report.
13. Are there any additional resources or data provided in the Logistics Automotive Industry report?
While the report offers comprehensive insights, it's advisable to review the specific contents or supplementary materials provided to ascertain if additional resources or data are available.
14. How can I stay updated on further developments or reports in the Logistics Automotive Industry?
To stay informed about further developments, trends, and reports in the Logistics Automotive Industry, consider subscribing to industry newsletters, following relevant companies and organizations, or regularly checking reputable industry news sources and publications.
Methodology
Step 1 - Identification of Relevant Samples Size from Population Database


Step 2 - Approaches for Defining Global Market Size (Value, Volume* & Price*)

Note*: In applicable scenarios
Step 3 - Data Sources
Primary Research
- Web Analytics
- Survey Reports
- Research Institute
- Latest Research Reports
- Opinion Leaders
Secondary Research
- Annual Reports
- White Paper
- Latest Press Release
- Industry Association
- Paid Database
- Investor Presentations

Step 4 - Data Triangulation
Involves using different sources of information in order to increase the validity of a study
These sources are likely to be stakeholders in a program - participants, other researchers, program staff, other community members, and so on.
Then we put all data in single framework & apply various statistical tools to find out the dynamic on the market.
During the analysis stage, feedback from the stakeholder groups would be compared to determine areas of agreement as well as areas of divergence