

Key Insights
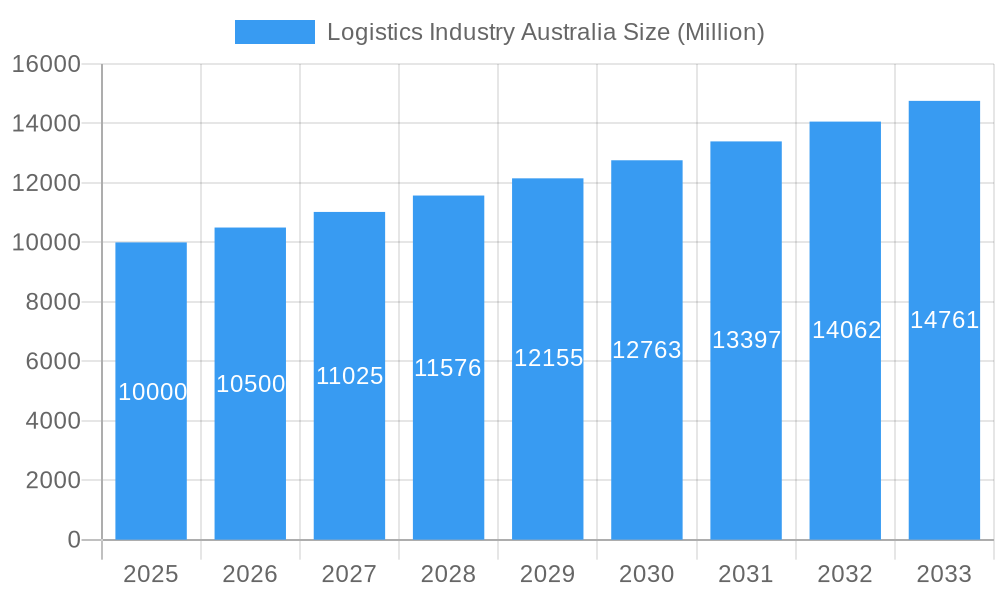
The Australian logistics market is poised for significant expansion, projecting a Compound Annual Growth Rate (CAGR) of over 5% between 2025 and 2033. This growth is propelled by several dynamic forces. The escalating e-commerce landscape demands sophisticated and dependable delivery solutions, thereby boosting the need for courier, express, and parcel (CEP) services, alongside specialized temperature-controlled logistics. Concurrently, the robust expansion of industries such as construction, mining, and agriculture is driving demand for bespoke logistics solutions. Urbanization and a strengthening Australian economy further underscore this positive market trajectory. Despite existing challenges including infrastructure constraints and workforce shortages, the market outlook remains exceptionally strong, presenting considerable opportunities for both established and emerging enterprises. The diversified market segmentation, considering both end-user industries and logistical functions, necessitates a strategic and adaptive approach for success. Prominent global entities like DB Schenker, DHL, and FedEx, alongside leading Australian operators, are key contributors to this evolving sector.
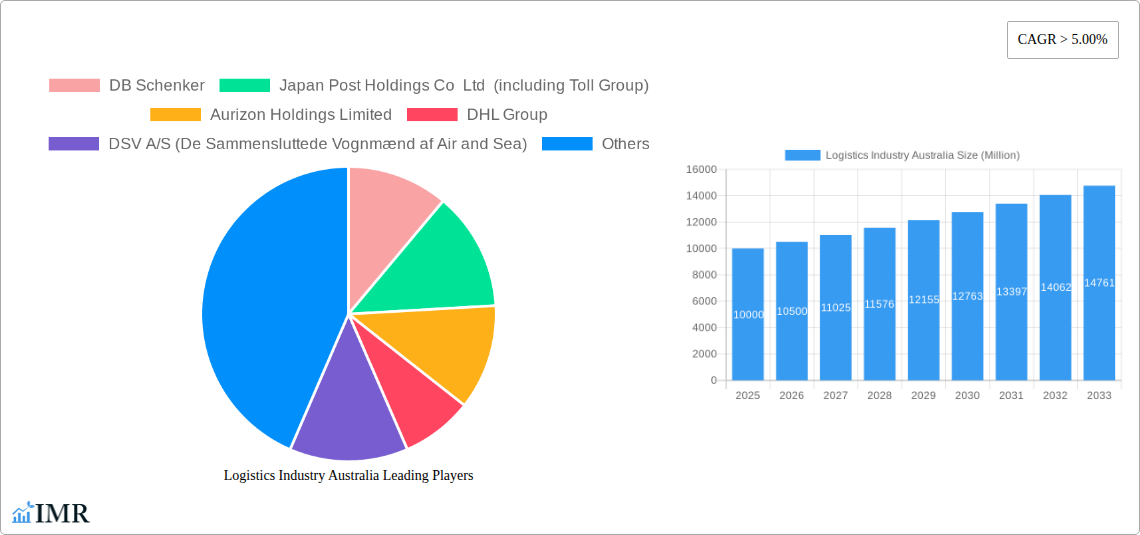
Logistics Industry Australia Market Size (In Billion)
The Australian logistics sector is defined by a balanced presence of global leaders and resilient, innovative domestic companies. Substantial investments in technological advancements, such as sophisticated tracking systems and route optimization software, are significantly improving operational efficiency. Moreover, a growing commitment to sustainability is reshaping industry practices, encouraging the adoption of environmentally friendly vehicles and fuel-efficient methodologies. While external factors like fluctuating fuel costs and regulatory shifts may pose potential challenges, the industry's inherent adaptability and the continuous growth of pivotal economic sectors indicate a sustained positive growth trend throughout the forecast period. The pronounced success in specialized segments, including temperature-controlled logistics, highlights the increasing criticality of preserving product integrity across diverse supply chains. The Australian logistics market is estimated at 137.7 billion in the base year 2025.
Logistics Industry Australia Company Market Share
Logistics Industry Australia Market Report: 2019-2033
This comprehensive report provides an in-depth analysis of the Australian logistics industry, encompassing market dynamics, growth trends, key players, and future opportunities. With a focus on both parent and child markets, this report offers invaluable insights for industry professionals, investors, and strategic decision-makers. The study period covers 2019-2033, with a base year of 2025 and a forecast period of 2025-2033. Market values are presented in millions of Australian dollars (AUD).
Logistics Industry Australia Market Dynamics & Structure
The Australian logistics market is characterized by a moderately concentrated landscape, with several major players holding significant market share. However, the presence of numerous smaller, specialized firms also contributes to market dynamism. Technological innovation, particularly in areas such as automation, data analytics, and sustainable transportation, is a key driver. Stringent regulatory frameworks concerning safety, environmental compliance, and data privacy influence operational costs and strategies. Competitive pressures from substitute products, such as improved internal supply chain management in some sectors, and evolving consumer expectations are shaping the competitive landscape. Mergers and acquisitions (M&A) activity has been moderate in recent years, with strategic consolidation primarily driven by expansion into new segments or geographical areas.
- Market Concentration: Top 5 players hold approximately xx% market share (2024 estimate).
- Technological Innovation: Focus on automation, IoT, and AI to enhance efficiency and tracking capabilities. Innovation barriers include high upfront investment costs and integration complexities.
- Regulatory Framework: Stringent regulations on safety, environmental protection, and data privacy impacting operational costs.
- M&A Activity: xx deals recorded between 2019-2024, with a predicted xx deals for 2025-2033. Mostly focused on consolidation and expansion into specialized niches.
- End-User Demographics: Shifting towards e-commerce dominance impacting last-mile delivery needs and warehouse logistics.
Logistics Industry Australia Growth Trends & Insights
The Australian logistics market experienced consistent growth during the historical period (2019-2024), driven by strong economic activity and increasing e-commerce adoption. The market size was valued at xx million AUD in 2024 and is projected to reach xx million AUD by 2033, exhibiting a CAGR of xx% during the forecast period (2025-2033). Technological disruptions, such as the rise of autonomous vehicles and drone delivery, are poised to further revolutionize the industry. Shifts in consumer behavior, particularly the preference for faster and more reliable delivery options, are putting pressure on logistics providers to optimize their operations and invest in advanced technologies. Market penetration of e-commerce logistics is expected to rise from xx% in 2024 to xx% in 2033.
Dominant Regions, Countries, or Segments in Logistics Industry Australia
The strongest growth within the Australian logistics market is observed in the major metropolitan areas (Sydney, Melbourne, Brisbane) driven by high population density and robust economic activity. Within end-user industries, Wholesale and Retail Trade and Manufacturing are the leading segments. In terms of logistics functions, Courier, Express, and Parcel (CEP) services are the most dominant, fueled by the growth of e-commerce.
- Key Growth Drivers:
- Strong economic growth in major metropolitan areas.
- Continued expansion of the e-commerce sector.
- Increased investment in infrastructure development (ports, roads).
- Government initiatives supporting logistics sector development.
- Dominant Segments:
- End-User Industry: Wholesale and Retail Trade (xx% market share), Manufacturing (xx% market share).
- Logistics Function: Courier, Express, and Parcel (CEP) (xx% market share).
Logistics Industry Australia Product Landscape
The Australian logistics sector offers a wide array of services, from traditional freight forwarding and warehousing to specialized solutions like temperature-controlled transportation and supply chain management. Recent innovations include the use of advanced tracking systems, AI-powered route optimization, and the integration of blockchain technology for enhanced transparency and security. Key players are constantly enhancing their service offerings by leveraging technology to improve efficiency, speed, and customer experience. The emphasis is shifting towards sustainable and environmentally friendly solutions, including the adoption of electric vehicles and eco-friendly packaging.
Key Drivers, Barriers & Challenges in Logistics Industry Australia
Key Drivers: The growth of e-commerce, increasing demand for faster delivery times, and government initiatives to improve infrastructure are major drivers. Technological advancements, such as automation and data analytics, are also playing a crucial role.
Key Challenges: High operating costs, including fuel prices and driver shortages, pose significant challenges. Regulatory compliance, infrastructure limitations in certain regions, and intense competition are also restraining factors. Labor shortages resulting in increased labor costs are predicted to cause a xx% increase in operating costs over the next 5 years.
Emerging Opportunities in Logistics Industry Australia
The Australian logistics industry is witnessing the emergence of several opportunities. The rise of last-mile delivery solutions, including drone delivery and autonomous vehicles, presents potential for innovation. There is also a growing demand for specialized logistics services, such as temperature-controlled transportation for pharmaceuticals and perishable goods. The focus on sustainability is creating opportunities for companies offering green logistics solutions.
Growth Accelerators in the Logistics Industry Australia Industry
Technological breakthroughs in areas such as automation and AI are poised to significantly boost efficiency and reduce costs. Strategic partnerships between logistics providers and technology companies are creating innovative solutions. Expansion into underserved regional markets offers significant growth potential. The increasing focus on sustainability is driving investment in green logistics solutions, further accelerating market growth.
Key Players Shaping the Logistics Industry Australia Market
- DB Schenker
- Japan Post Holdings Co Ltd (including Toll Group)
- Aurizon Holdings Limited
- DHL Group
- DSV A/S (De Sammensluttede Vognmænd af Air and Sea)
- FedEx
- Qube Holdings Ltd
- LINX Cargo Care Group
- Kuehne + Nagel
- Linfox Pty Ltd
- K&S Corporation Limited
- Toll Group
- Centurion Transport
Notable Milestones in Logistics Industry Australia Sector
- January 2024: DHL Express expands its Asia-Pacific to Americas connectivity with additional Boeing 777 freighters.
- January 2024: Kuehne + Nagel launches Book & Claim insetting solution for electric vehicles, enhancing sustainability initiatives.
- February 2024: DHL Supply Chain adds electric vehicles to its Australian fleet, furthering decarbonization efforts.
In-Depth Logistics Industry Australia Market Outlook
The Australian logistics industry is poised for continued growth, driven by robust economic activity, e-commerce expansion, and technological advancements. Strategic investments in infrastructure, coupled with the adoption of innovative technologies, will unlock significant market potential. Companies focusing on sustainability and efficiency will be well-positioned to capture market share. The long-term outlook remains positive, with ample opportunities for growth and innovation.
Logistics Industry Australia Segmentation
-
1. End User Industry
- 1.1. Agriculture, Fishing, and Forestry
- 1.2. Construction
- 1.3. Manufacturing
- 1.4. Oil and Gas, Mining and Quarrying
- 1.5. Wholesale and Retail Trade
- 1.6. Others
-
2. Logistics Function
-
2.1. Courier, Express, and Parcel (CEP)
-
2.1.1. By Destination Type
- 2.1.1.1. Domestic
- 2.1.1.2. International
-
2.1.1. By Destination Type
-
2.2. Freight Forwarding
-
2.2.1. By Mode Of Transport
- 2.2.1.1. Air
- 2.2.1.2. Sea and Inland Waterways
- 2.2.1.3. Others
-
2.2.1. By Mode Of Transport
-
2.3. Freight Transport
- 2.3.1. Pipelines
- 2.3.2. Rail
- 2.3.3. Road
-
2.4. Warehousing and Storage
-
2.4.1. By Temperature Control
- 2.4.1.1. Non-Temperature Controlled
-
2.4.1. By Temperature Control
- 2.5. Other Services
-
2.1. Courier, Express, and Parcel (CEP)
Logistics Industry Australia Segmentation By Geography
-
1. North America
- 1.1. United States
- 1.2. Canada
- 1.3. Mexico
-
2. South America
- 2.1. Brazil
- 2.2. Argentina
- 2.3. Rest of South America
-
3. Europe
- 3.1. United Kingdom
- 3.2. Germany
- 3.3. France
- 3.4. Italy
- 3.5. Spain
- 3.6. Russia
- 3.7. Benelux
- 3.8. Nordics
- 3.9. Rest of Europe
-
4. Middle East & Africa
- 4.1. Turkey
- 4.2. Israel
- 4.3. GCC
- 4.4. North Africa
- 4.5. South Africa
- 4.6. Rest of Middle East & Africa
-
5. Asia Pacific
- 5.1. China
- 5.2. India
- 5.3. Japan
- 5.4. South Korea
- 5.5. ASEAN
- 5.6. Oceania
- 5.7. Rest of Asia Pacific
Logistics Industry Australia Regional Market Share
Geographic Coverage of Logistics Industry Australia
Logistics Industry Australia REPORT HIGHLIGHTS
| Aspects | Details |
|---|---|
| Study Period | 2020-2034 |
| Base Year | 2025 |
| Estimated Year | 2026 |
| Forecast Period | 2026-2034 |
| Historical Period | 2020-2025 |
| Growth Rate | CAGR of 1% from 2020-2034 |
| Segmentation |
|
Table of Contents
- 1. Introduction
- 1.1. Research Scope
- 1.2. Market Segmentation
- 1.3. Research Objective
- 1.4. Definitions and Assumptions
- 2. Executive Summary
- 2.1. Market Snapshot
- 3. Market Dynamics
- 3.1. Market Drivers
- 3.2. Market Restrains
- 3.3. Market Trends
- 3.4. Market Opportunities
- 4. Market Factor Analysis
- 4.1. Porters Five Forces
- 4.1.1. Bargaining Power of Suppliers
- 4.1.2. Bargaining Power of Buyers
- 4.1.3. Threat of New Entrants
- 4.1.4. Threat of Substitutes
- 4.1.5. Competitive Rivalry
- 4.2. PESTEL analysis
- 4.3. BCG Analysis
- 4.3.1. Stars (High Growth, High Market Share)
- 4.3.2. Cash Cows (Low Growth, High Market Share)
- 4.3.3. Question Mark (High Growth, Low Market Share)
- 4.3.4. Dogs (Low Growth, Low Market Share)
- 4.4. Ansoff Matrix Analysis
- 4.5. Supply Chain Analysis
- 4.6. Regulatory Landscape
- 4.7. Current Market Potential and Opportunity Assessment (TAM–SAM–SOM Framework)
- 4.8. IMR Analyst Note
- 4.1. Porters Five Forces
- 5. Market Analysis, Insights and Forecast 2021-2033
- 5.1. Market Analysis, Insights and Forecast - by End User Industry
- 5.1.1. Agriculture, Fishing, and Forestry
- 5.1.2. Construction
- 5.1.3. Manufacturing
- 5.1.4. Oil and Gas, Mining and Quarrying
- 5.1.5. Wholesale and Retail Trade
- 5.1.6. Others
- 5.2. Market Analysis, Insights and Forecast - by Logistics Function
- 5.2.1. Courier, Express, and Parcel (CEP)
- 5.2.1.1. By Destination Type
- 5.2.1.1.1. Domestic
- 5.2.1.1.2. International
- 5.2.1.1. By Destination Type
- 5.2.2. Freight Forwarding
- 5.2.2.1. By Mode Of Transport
- 5.2.2.1.1. Air
- 5.2.2.1.2. Sea and Inland Waterways
- 5.2.2.1.3. Others
- 5.2.2.1. By Mode Of Transport
- 5.2.3. Freight Transport
- 5.2.3.1. Pipelines
- 5.2.3.2. Rail
- 5.2.3.3. Road
- 5.2.4. Warehousing and Storage
- 5.2.4.1. By Temperature Control
- 5.2.4.1.1. Non-Temperature Controlled
- 5.2.4.1. By Temperature Control
- 5.2.5. Other Services
- 5.2.1. Courier, Express, and Parcel (CEP)
- 5.3. Market Analysis, Insights and Forecast - by Region
- 5.3.1. North America
- 5.3.2. South America
- 5.3.3. Europe
- 5.3.4. Middle East & Africa
- 5.3.5. Asia Pacific
- 5.1. Market Analysis, Insights and Forecast - by End User Industry
- 6. Global Logistics Industry Australia Analysis, Insights and Forecast, 2021-2033
- 6.1. Market Analysis, Insights and Forecast - by End User Industry
- 6.1.1. Agriculture, Fishing, and Forestry
- 6.1.2. Construction
- 6.1.3. Manufacturing
- 6.1.4. Oil and Gas, Mining and Quarrying
- 6.1.5. Wholesale and Retail Trade
- 6.1.6. Others
- 6.2. Market Analysis, Insights and Forecast - by Logistics Function
- 6.2.1. Courier, Express, and Parcel (CEP)
- 6.2.1.1. By Destination Type
- 6.2.1.1.1. Domestic
- 6.2.1.1.2. International
- 6.2.1.1. By Destination Type
- 6.2.2. Freight Forwarding
- 6.2.2.1. By Mode Of Transport
- 6.2.2.1.1. Air
- 6.2.2.1.2. Sea and Inland Waterways
- 6.2.2.1.3. Others
- 6.2.2.1. By Mode Of Transport
- 6.2.3. Freight Transport
- 6.2.3.1. Pipelines
- 6.2.3.2. Rail
- 6.2.3.3. Road
- 6.2.4. Warehousing and Storage
- 6.2.4.1. By Temperature Control
- 6.2.4.1.1. Non-Temperature Controlled
- 6.2.4.1. By Temperature Control
- 6.2.5. Other Services
- 6.2.1. Courier, Express, and Parcel (CEP)
- 6.1. Market Analysis, Insights and Forecast - by End User Industry
- 7. North America Logistics Industry Australia Analysis, Insights and Forecast, 2020-2032
- 7.1. Market Analysis, Insights and Forecast - by End User Industry
- 7.1.1. Agriculture, Fishing, and Forestry
- 7.1.2. Construction
- 7.1.3. Manufacturing
- 7.1.4. Oil and Gas, Mining and Quarrying
- 7.1.5. Wholesale and Retail Trade
- 7.1.6. Others
- 7.2. Market Analysis, Insights and Forecast - by Logistics Function
- 7.2.1. Courier, Express, and Parcel (CEP)
- 7.2.1.1. By Destination Type
- 7.2.1.1.1. Domestic
- 7.2.1.1.2. International
- 7.2.1.1. By Destination Type
- 7.2.2. Freight Forwarding
- 7.2.2.1. By Mode Of Transport
- 7.2.2.1.1. Air
- 7.2.2.1.2. Sea and Inland Waterways
- 7.2.2.1.3. Others
- 7.2.2.1. By Mode Of Transport
- 7.2.3. Freight Transport
- 7.2.3.1. Pipelines
- 7.2.3.2. Rail
- 7.2.3.3. Road
- 7.2.4. Warehousing and Storage
- 7.2.4.1. By Temperature Control
- 7.2.4.1.1. Non-Temperature Controlled
- 7.2.4.1. By Temperature Control
- 7.2.5. Other Services
- 7.2.1. Courier, Express, and Parcel (CEP)
- 7.1. Market Analysis, Insights and Forecast - by End User Industry
- 8. South America Logistics Industry Australia Analysis, Insights and Forecast, 2020-2032
- 8.1. Market Analysis, Insights and Forecast - by End User Industry
- 8.1.1. Agriculture, Fishing, and Forestry
- 8.1.2. Construction
- 8.1.3. Manufacturing
- 8.1.4. Oil and Gas, Mining and Quarrying
- 8.1.5. Wholesale and Retail Trade
- 8.1.6. Others
- 8.2. Market Analysis, Insights and Forecast - by Logistics Function
- 8.2.1. Courier, Express, and Parcel (CEP)
- 8.2.1.1. By Destination Type
- 8.2.1.1.1. Domestic
- 8.2.1.1.2. International
- 8.2.1.1. By Destination Type
- 8.2.2. Freight Forwarding
- 8.2.2.1. By Mode Of Transport
- 8.2.2.1.1. Air
- 8.2.2.1.2. Sea and Inland Waterways
- 8.2.2.1.3. Others
- 8.2.2.1. By Mode Of Transport
- 8.2.3. Freight Transport
- 8.2.3.1. Pipelines
- 8.2.3.2. Rail
- 8.2.3.3. Road
- 8.2.4. Warehousing and Storage
- 8.2.4.1. By Temperature Control
- 8.2.4.1.1. Non-Temperature Controlled
- 8.2.4.1. By Temperature Control
- 8.2.5. Other Services
- 8.2.1. Courier, Express, and Parcel (CEP)
- 8.1. Market Analysis, Insights and Forecast - by End User Industry
- 9. Europe Logistics Industry Australia Analysis, Insights and Forecast, 2020-2032
- 9.1. Market Analysis, Insights and Forecast - by End User Industry
- 9.1.1. Agriculture, Fishing, and Forestry
- 9.1.2. Construction
- 9.1.3. Manufacturing
- 9.1.4. Oil and Gas, Mining and Quarrying
- 9.1.5. Wholesale and Retail Trade
- 9.1.6. Others
- 9.2. Market Analysis, Insights and Forecast - by Logistics Function
- 9.2.1. Courier, Express, and Parcel (CEP)
- 9.2.1.1. By Destination Type
- 9.2.1.1.1. Domestic
- 9.2.1.1.2. International
- 9.2.1.1. By Destination Type
- 9.2.2. Freight Forwarding
- 9.2.2.1. By Mode Of Transport
- 9.2.2.1.1. Air
- 9.2.2.1.2. Sea and Inland Waterways
- 9.2.2.1.3. Others
- 9.2.2.1. By Mode Of Transport
- 9.2.3. Freight Transport
- 9.2.3.1. Pipelines
- 9.2.3.2. Rail
- 9.2.3.3. Road
- 9.2.4. Warehousing and Storage
- 9.2.4.1. By Temperature Control
- 9.2.4.1.1. Non-Temperature Controlled
- 9.2.4.1. By Temperature Control
- 9.2.5. Other Services
- 9.2.1. Courier, Express, and Parcel (CEP)
- 9.1. Market Analysis, Insights and Forecast - by End User Industry
- 10. Middle East & Africa Logistics Industry Australia Analysis, Insights and Forecast, 2020-2032
- 10.1. Market Analysis, Insights and Forecast - by End User Industry
- 10.1.1. Agriculture, Fishing, and Forestry
- 10.1.2. Construction
- 10.1.3. Manufacturing
- 10.1.4. Oil and Gas, Mining and Quarrying
- 10.1.5. Wholesale and Retail Trade
- 10.1.6. Others
- 10.2. Market Analysis, Insights and Forecast - by Logistics Function
- 10.2.1. Courier, Express, and Parcel (CEP)
- 10.2.1.1. By Destination Type
- 10.2.1.1.1. Domestic
- 10.2.1.1.2. International
- 10.2.1.1. By Destination Type
- 10.2.2. Freight Forwarding
- 10.2.2.1. By Mode Of Transport
- 10.2.2.1.1. Air
- 10.2.2.1.2. Sea and Inland Waterways
- 10.2.2.1.3. Others
- 10.2.2.1. By Mode Of Transport
- 10.2.3. Freight Transport
- 10.2.3.1. Pipelines
- 10.2.3.2. Rail
- 10.2.3.3. Road
- 10.2.4. Warehousing and Storage
- 10.2.4.1. By Temperature Control
- 10.2.4.1.1. Non-Temperature Controlled
- 10.2.4.1. By Temperature Control
- 10.2.5. Other Services
- 10.2.1. Courier, Express, and Parcel (CEP)
- 10.1. Market Analysis, Insights and Forecast - by End User Industry
- 11. Asia Pacific Logistics Industry Australia Analysis, Insights and Forecast, 2020-2032
- 11.1. Market Analysis, Insights and Forecast - by End User Industry
- 11.1.1. Agriculture, Fishing, and Forestry
- 11.1.2. Construction
- 11.1.3. Manufacturing
- 11.1.4. Oil and Gas, Mining and Quarrying
- 11.1.5. Wholesale and Retail Trade
- 11.1.6. Others
- 11.2. Market Analysis, Insights and Forecast - by Logistics Function
- 11.2.1. Courier, Express, and Parcel (CEP)
- 11.2.1.1. By Destination Type
- 11.2.1.1.1. Domestic
- 11.2.1.1.2. International
- 11.2.1.1. By Destination Type
- 11.2.2. Freight Forwarding
- 11.2.2.1. By Mode Of Transport
- 11.2.2.1.1. Air
- 11.2.2.1.2. Sea and Inland Waterways
- 11.2.2.1.3. Others
- 11.2.2.1. By Mode Of Transport
- 11.2.3. Freight Transport
- 11.2.3.1. Pipelines
- 11.2.3.2. Rail
- 11.2.3.3. Road
- 11.2.4. Warehousing and Storage
- 11.2.4.1. By Temperature Control
- 11.2.4.1.1. Non-Temperature Controlled
- 11.2.4.1. By Temperature Control
- 11.2.5. Other Services
- 11.2.1. Courier, Express, and Parcel (CEP)
- 11.1. Market Analysis, Insights and Forecast - by End User Industry
- 12. Competitive Analysis
- 12.1. Company Profiles
- 12.1.1 DB Schenker
- 12.1.1.1. Company Overview
- 12.1.1.2. Products
- 12.1.1.3. Company Financials
- 12.1.1.4. SWOT Analysis
- 12.1.2 Japan Post Holdings Co Ltd (including Toll Group)
- 12.1.2.1. Company Overview
- 12.1.2.2. Products
- 12.1.2.3. Company Financials
- 12.1.2.4. SWOT Analysis
- 12.1.3 Aurizon Holdings Limited
- 12.1.3.1. Company Overview
- 12.1.3.2. Products
- 12.1.3.3. Company Financials
- 12.1.3.4. SWOT Analysis
- 12.1.4 DHL Group
- 12.1.4.1. Company Overview
- 12.1.4.2. Products
- 12.1.4.3. Company Financials
- 12.1.4.4. SWOT Analysis
- 12.1.5 DSV A/S (De Sammensluttede Vognmænd af Air and Sea)
- 12.1.5.1. Company Overview
- 12.1.5.2. Products
- 12.1.5.3. Company Financials
- 12.1.5.4. SWOT Analysis
- 12.1.6 FedEx
- 12.1.6.1. Company Overview
- 12.1.6.2. Products
- 12.1.6.3. Company Financials
- 12.1.6.4. SWOT Analysis
- 12.1.7 Qube Holdings Ltd
- 12.1.7.1. Company Overview
- 12.1.7.2. Products
- 12.1.7.3. Company Financials
- 12.1.7.4. SWOT Analysis
- 12.1.8 LINX Cargo Care Group
- 12.1.8.1. Company Overview
- 12.1.8.2. Products
- 12.1.8.3. Company Financials
- 12.1.8.4. SWOT Analysis
- 12.1.9 Kuehne + Nagel
- 12.1.9.1. Company Overview
- 12.1.9.2. Products
- 12.1.9.3. Company Financials
- 12.1.9.4. SWOT Analysis
- 12.1.10 Linfox Pty Ltd
- 12.1.10.1. Company Overview
- 12.1.10.2. Products
- 12.1.10.3. Company Financials
- 12.1.10.4. SWOT Analysis
- 12.1.11 K&S Corporation Limited
- 12.1.11.1. Company Overview
- 12.1.11.2. Products
- 12.1.11.3. Company Financials
- 12.1.11.4. SWOT Analysis
- 12.1.12 Toll Grou
- 12.1.12.1. Company Overview
- 12.1.12.2. Products
- 12.1.12.3. Company Financials
- 12.1.12.4. SWOT Analysis
- 12.1.13 Centurion Transport
- 12.1.13.1. Company Overview
- 12.1.13.2. Products
- 12.1.13.3. Company Financials
- 12.1.13.4. SWOT Analysis
- 12.1.1 DB Schenker
- 12.2. Market Entropy
- 12.2.1 Company's Key Areas Served
- 12.2.2 Recent Developments
- 12.3. Company Market Share Analysis 2025
- 12.3.1 Top 5 Companies Market Share Analysis
- 12.3.2 Top 3 Companies Market Share Analysis
- 12.4. List of Potential Customers
- 13. Research Methodology
List of Figures
- Figure 1: Global Logistics Industry Australia Revenue Breakdown (billion, %) by Region 2025 & 2033
- Figure 2: North America Logistics Industry Australia Revenue (billion), by End User Industry 2025 & 2033
- Figure 3: North America Logistics Industry Australia Revenue Share (%), by End User Industry 2025 & 2033
- Figure 4: North America Logistics Industry Australia Revenue (billion), by Logistics Function 2025 & 2033
- Figure 5: North America Logistics Industry Australia Revenue Share (%), by Logistics Function 2025 & 2033
- Figure 6: North America Logistics Industry Australia Revenue (billion), by Country 2025 & 2033
- Figure 7: North America Logistics Industry Australia Revenue Share (%), by Country 2025 & 2033
- Figure 8: South America Logistics Industry Australia Revenue (billion), by End User Industry 2025 & 2033
- Figure 9: South America Logistics Industry Australia Revenue Share (%), by End User Industry 2025 & 2033
- Figure 10: South America Logistics Industry Australia Revenue (billion), by Logistics Function 2025 & 2033
- Figure 11: South America Logistics Industry Australia Revenue Share (%), by Logistics Function 2025 & 2033
- Figure 12: South America Logistics Industry Australia Revenue (billion), by Country 2025 & 2033
- Figure 13: South America Logistics Industry Australia Revenue Share (%), by Country 2025 & 2033
- Figure 14: Europe Logistics Industry Australia Revenue (billion), by End User Industry 2025 & 2033
- Figure 15: Europe Logistics Industry Australia Revenue Share (%), by End User Industry 2025 & 2033
- Figure 16: Europe Logistics Industry Australia Revenue (billion), by Logistics Function 2025 & 2033
- Figure 17: Europe Logistics Industry Australia Revenue Share (%), by Logistics Function 2025 & 2033
- Figure 18: Europe Logistics Industry Australia Revenue (billion), by Country 2025 & 2033
- Figure 19: Europe Logistics Industry Australia Revenue Share (%), by Country 2025 & 2033
- Figure 20: Middle East & Africa Logistics Industry Australia Revenue (billion), by End User Industry 2025 & 2033
- Figure 21: Middle East & Africa Logistics Industry Australia Revenue Share (%), by End User Industry 2025 & 2033
- Figure 22: Middle East & Africa Logistics Industry Australia Revenue (billion), by Logistics Function 2025 & 2033
- Figure 23: Middle East & Africa Logistics Industry Australia Revenue Share (%), by Logistics Function 2025 & 2033
- Figure 24: Middle East & Africa Logistics Industry Australia Revenue (billion), by Country 2025 & 2033
- Figure 25: Middle East & Africa Logistics Industry Australia Revenue Share (%), by Country 2025 & 2033
- Figure 26: Asia Pacific Logistics Industry Australia Revenue (billion), by End User Industry 2025 & 2033
- Figure 27: Asia Pacific Logistics Industry Australia Revenue Share (%), by End User Industry 2025 & 2033
- Figure 28: Asia Pacific Logistics Industry Australia Revenue (billion), by Logistics Function 2025 & 2033
- Figure 29: Asia Pacific Logistics Industry Australia Revenue Share (%), by Logistics Function 2025 & 2033
- Figure 30: Asia Pacific Logistics Industry Australia Revenue (billion), by Country 2025 & 2033
- Figure 31: Asia Pacific Logistics Industry Australia Revenue Share (%), by Country 2025 & 2033
List of Tables
- Table 1: Global Logistics Industry Australia Revenue billion Forecast, by End User Industry 2020 & 2033
- Table 2: Global Logistics Industry Australia Revenue billion Forecast, by Logistics Function 2020 & 2033
- Table 3: Global Logistics Industry Australia Revenue billion Forecast, by Region 2020 & 2033
- Table 4: Global Logistics Industry Australia Revenue billion Forecast, by End User Industry 2020 & 2033
- Table 5: Global Logistics Industry Australia Revenue billion Forecast, by Logistics Function 2020 & 2033
- Table 6: Global Logistics Industry Australia Revenue billion Forecast, by Country 2020 & 2033
- Table 7: United States Logistics Industry Australia Revenue (billion) Forecast, by Application 2020 & 2033
- Table 8: Canada Logistics Industry Australia Revenue (billion) Forecast, by Application 2020 & 2033
- Table 9: Mexico Logistics Industry Australia Revenue (billion) Forecast, by Application 2020 & 2033
- Table 10: Global Logistics Industry Australia Revenue billion Forecast, by End User Industry 2020 & 2033
- Table 11: Global Logistics Industry Australia Revenue billion Forecast, by Logistics Function 2020 & 2033
- Table 12: Global Logistics Industry Australia Revenue billion Forecast, by Country 2020 & 2033
- Table 13: Brazil Logistics Industry Australia Revenue (billion) Forecast, by Application 2020 & 2033
- Table 14: Argentina Logistics Industry Australia Revenue (billion) Forecast, by Application 2020 & 2033
- Table 15: Rest of South America Logistics Industry Australia Revenue (billion) Forecast, by Application 2020 & 2033
- Table 16: Global Logistics Industry Australia Revenue billion Forecast, by End User Industry 2020 & 2033
- Table 17: Global Logistics Industry Australia Revenue billion Forecast, by Logistics Function 2020 & 2033
- Table 18: Global Logistics Industry Australia Revenue billion Forecast, by Country 2020 & 2033
- Table 19: United Kingdom Logistics Industry Australia Revenue (billion) Forecast, by Application 2020 & 2033
- Table 20: Germany Logistics Industry Australia Revenue (billion) Forecast, by Application 2020 & 2033
- Table 21: France Logistics Industry Australia Revenue (billion) Forecast, by Application 2020 & 2033
- Table 22: Italy Logistics Industry Australia Revenue (billion) Forecast, by Application 2020 & 2033
- Table 23: Spain Logistics Industry Australia Revenue (billion) Forecast, by Application 2020 & 2033
- Table 24: Russia Logistics Industry Australia Revenue (billion) Forecast, by Application 2020 & 2033
- Table 25: Benelux Logistics Industry Australia Revenue (billion) Forecast, by Application 2020 & 2033
- Table 26: Nordics Logistics Industry Australia Revenue (billion) Forecast, by Application 2020 & 2033
- Table 27: Rest of Europe Logistics Industry Australia Revenue (billion) Forecast, by Application 2020 & 2033
- Table 28: Global Logistics Industry Australia Revenue billion Forecast, by End User Industry 2020 & 2033
- Table 29: Global Logistics Industry Australia Revenue billion Forecast, by Logistics Function 2020 & 2033
- Table 30: Global Logistics Industry Australia Revenue billion Forecast, by Country 2020 & 2033
- Table 31: Turkey Logistics Industry Australia Revenue (billion) Forecast, by Application 2020 & 2033
- Table 32: Israel Logistics Industry Australia Revenue (billion) Forecast, by Application 2020 & 2033
- Table 33: GCC Logistics Industry Australia Revenue (billion) Forecast, by Application 2020 & 2033
- Table 34: North Africa Logistics Industry Australia Revenue (billion) Forecast, by Application 2020 & 2033
- Table 35: South Africa Logistics Industry Australia Revenue (billion) Forecast, by Application 2020 & 2033
- Table 36: Rest of Middle East & Africa Logistics Industry Australia Revenue (billion) Forecast, by Application 2020 & 2033
- Table 37: Global Logistics Industry Australia Revenue billion Forecast, by End User Industry 2020 & 2033
- Table 38: Global Logistics Industry Australia Revenue billion Forecast, by Logistics Function 2020 & 2033
- Table 39: Global Logistics Industry Australia Revenue billion Forecast, by Country 2020 & 2033
- Table 40: China Logistics Industry Australia Revenue (billion) Forecast, by Application 2020 & 2033
- Table 41: India Logistics Industry Australia Revenue (billion) Forecast, by Application 2020 & 2033
- Table 42: Japan Logistics Industry Australia Revenue (billion) Forecast, by Application 2020 & 2033
- Table 43: South Korea Logistics Industry Australia Revenue (billion) Forecast, by Application 2020 & 2033
- Table 44: ASEAN Logistics Industry Australia Revenue (billion) Forecast, by Application 2020 & 2033
- Table 45: Oceania Logistics Industry Australia Revenue (billion) Forecast, by Application 2020 & 2033
- Table 46: Rest of Asia Pacific Logistics Industry Australia Revenue (billion) Forecast, by Application 2020 & 2033
Frequently Asked Questions
1. What is the projected Compound Annual Growth Rate (CAGR) of the Logistics Industry Australia?
The projected CAGR is approximately 1%.
2. Which companies are prominent players in the Logistics Industry Australia?
Key companies in the market include DB Schenker, Japan Post Holdings Co Ltd (including Toll Group), Aurizon Holdings Limited, DHL Group, DSV A/S (De Sammensluttede Vognmænd af Air and Sea), FedEx, Qube Holdings Ltd, LINX Cargo Care Group, Kuehne + Nagel, Linfox Pty Ltd, K&S Corporation Limited, Toll Grou, Centurion Transport.
3. What are the main segments of the Logistics Industry Australia?
The market segments include End User Industry, Logistics Function.
4. Can you provide details about the market size?
The market size is estimated to be USD 137.7 billion as of 2022.
5. What are some drivers contributing to market growth?
4.; Increase demand of Petrochemical is driving the market4.; Increase in Investments is driving the market.
6. What are the notable trends driving market growth?
OTHER KEY INDUSTRY TRENDS COVERED IN THE REPORT.
7. Are there any restraints impacting market growth?
4.; High Cost of Operations.
8. Can you provide examples of recent developments in the market?
February 2024: DHL Supply Chain (DHL) is continuing the decarbonization of its Australian transport fleet by introducing additional new electric vehicles. The company has added two Terberg YT200EV electric yard tractors to its truck fleet and is supporting Australian electric vehicle manufacturing with the introduction of its first SEA Electric light duty truck to its last-mile fleet.January 2024: DHL Express has commenced services for the final Boeing 777 freighter deployed at the South Asia Hub in Singapore. With a payload capability of 102 tons, the aircraft joins the four other Boeing 777 freighters already deployed in Singapore to boost inter-continental connectivity between the Asia Pacific and the Americas. Sporting a dual DHL-Singapore Airlines (SIA) livery, these five freighters provide a total of 1,224 tons of payload capacity to meet growing customer demand for international express shipping services.January 2024: Kuehne + Nagel has announced its Book & Claim insetting solution for electric vehicles, to improve its decarbonization solutions. Developing Book & Claim insetting solutions for road freight was a strategic priority for Kuehne + Nagel. Customers who use Kuehne + Nagel's road transport services can now claim the carbon reductions of electric trucks when it is not possible to physically move their goods on these vehicles.
9. What pricing options are available for accessing the report?
Pricing options include single-user, multi-user, and enterprise licenses priced at USD 3800, USD 4500, and USD 5800 respectively.
10. Is the market size provided in terms of value or volume?
The market size is provided in terms of value, measured in billion.
11. Are there any specific market keywords associated with the report?
Yes, the market keyword associated with the report is "Logistics Industry Australia," which aids in identifying and referencing the specific market segment covered.
12. How do I determine which pricing option suits my needs best?
The pricing options vary based on user requirements and access needs. Individual users may opt for single-user licenses, while businesses requiring broader access may choose multi-user or enterprise licenses for cost-effective access to the report.
13. Are there any additional resources or data provided in the Logistics Industry Australia report?
While the report offers comprehensive insights, it's advisable to review the specific contents or supplementary materials provided to ascertain if additional resources or data are available.
14. How can I stay updated on further developments or reports in the Logistics Industry Australia?
To stay informed about further developments, trends, and reports in the Logistics Industry Australia, consider subscribing to industry newsletters, following relevant companies and organizations, or regularly checking reputable industry news sources and publications.
Methodology
Step 1 - Identification of Relevant Samples Size from Population Database


Step 2 - Approaches for Defining Global Market Size (Value, Volume* & Price*)

Note*: In applicable scenarios
Step 3 - Data Sources
Primary Research
- Web Analytics
- Survey Reports
- Research Institute
- Latest Research Reports
- Opinion Leaders
Secondary Research
- Annual Reports
- White Paper
- Latest Press Release
- Industry Association
- Paid Database
- Investor Presentations

Step 4 - Data Triangulation
Involves using different sources of information in order to increase the validity of a study
These sources are likely to be stakeholders in a program - participants, other researchers, program staff, other community members, and so on.
Then we put all data in single framework & apply various statistical tools to find out the dynamic on the market.
During the analysis stage, feedback from the stakeholder groups would be compared to determine areas of agreement as well as areas of divergence