

Key Insights
The global low-fat cheese cubes market is experiencing robust growth, driven by increasing health consciousness among consumers and a rising preference for convenient, portion-controlled snack options. The market, estimated at $2.5 billion in 2025, is projected to witness a Compound Annual Growth Rate (CAGR) of 5% from 2025 to 2033, reaching an estimated market value of $3.8 billion by 2033. This growth is fueled by several key factors, including the proliferation of health-conscious food options in supermarkets and convenience stores, the increasing popularity of low-fat and low-calorie diets, and innovative product development by major players like Arla Foods, Leprino Foods, and Bel Group, focusing on enhanced taste and texture to overcome the perceived blandness of low-fat cheese. Furthermore, the rising demand for ready-to-eat snacks and the expanding foodservice sector are contributing significantly to the market's expansion. Geographic expansion, particularly in emerging markets with growing disposable incomes and changing dietary habits, is also expected to drive market growth.
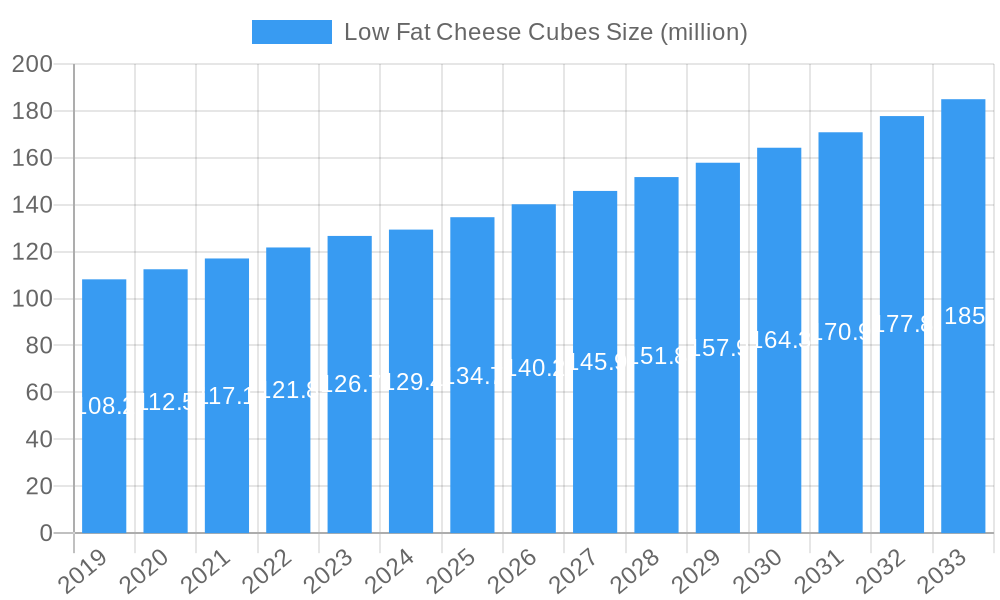
Low Fat Cheese Cubes Market Size (In Billion)
However, certain challenges persist. Fluctuations in milk prices and other raw material costs can impact profitability. Furthermore, consumer perception regarding the taste and texture of low-fat cheese compared to full-fat alternatives remains a key restraint. To mitigate this, manufacturers are investing heavily in research and development to improve product quality and introduce innovative flavors and formats to attract a broader consumer base. The market is segmented by product type (e.g., cheddar, mozzarella, etc.), distribution channel (supermarkets, convenience stores, online), and geography. The competitive landscape is characterized by the presence of both large multinational corporations and regional players, leading to increased competition and innovation. Successful players will need to effectively manage costs, innovate to enhance product appeal, and strategically target specific consumer segments to achieve sustainable growth in the years to come.
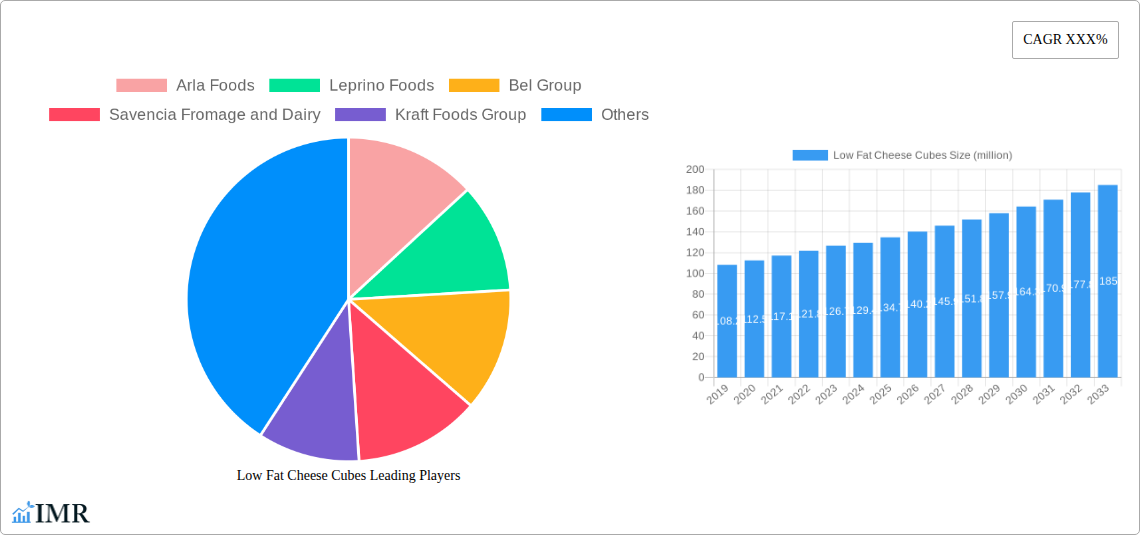
Low Fat Cheese Cubes Company Market Share
Low Fat Cheese Cubes Market Report: 2019-2033
This comprehensive report provides a detailed analysis of the global low-fat cheese cubes market, offering invaluable insights for industry professionals, investors, and strategic decision-makers. The report covers the period from 2019 to 2033, with a focus on the forecast period of 2025-2033 and a base year of 2025. The market is segmented by key players, regions, and product types, providing a granular understanding of this dynamic sector. This report helps understand the market size, growth drivers, challenges and opportunities within the low-fat cheese cubes market and its parent market of processed cheese and child market of snack cheese. The report projects the market size to reach xx million units by 2033.
Low Fat Cheese Cubes Market Dynamics & Structure
This section analyzes the competitive landscape, technological advancements, regulatory influences, and market trends impacting the low-fat cheese cubes market. The market is characterized by a moderately consolidated structure with key players holding significant market share. The total market size in 2025 is estimated at 1000 million units.
- Market Concentration: The top five players (Arla Foods, Leprino Foods, Bel Group, Savencia Fromage & Dairy, Kraft Foods Group) collectively hold approximately 60% of the global market share in 2025.
- Technological Innovation: Advances in cheese processing technology, particularly in achieving consistent low-fat content without compromising taste and texture, are key drivers. This includes advancements in milk processing and cheese formulation techniques.
- Regulatory Framework: Regulations concerning labeling, fat content claims, and food safety standards significantly influence market dynamics. Variations in regulations across different regions present both opportunities and challenges.
- Competitive Substitutes: Other snack foods, such as yogurt, nuts, and fruit, compete with low-fat cheese cubes. The market is also influenced by the availability of full-fat cheese cubes and other processed cheese products.
- End-User Demographics: The primary consumer base comprises health-conscious individuals, children, and those seeking convenient snack options. Growing awareness of health and wellness fuels market growth, especially within the millennial and Gen Z demographics.
- M&A Trends: Consolidation through mergers and acquisitions is expected to continue, with approximately xx M&A deals projected within the forecast period (2025-2033). These activities mainly aim to expand market reach, enhance product portfolios, and achieve economies of scale.
Low Fat Cheese Cubes Growth Trends & Insights
The low-fat cheese cubes market has experienced consistent growth over the historical period (2019-2024). The market is projected to maintain a Compound Annual Growth Rate (CAGR) of xx% during the forecast period (2025-2033), driven by several factors. Consumer demand for healthier snack options has fuelled growth alongside product innovation and expansion into new markets. Changing dietary trends and increasing health consciousness have positively impacted the market adoption rate. The market penetration for low-fat cheese cubes has increased steadily over the years, with significant room for further expansion, especially in emerging markets. Technological advancements in cheese processing and packaging have also enhanced shelf life and improved product quality, further driving market growth.
Dominant Regions, Countries, or Segments in Low Fat Cheese Cubes
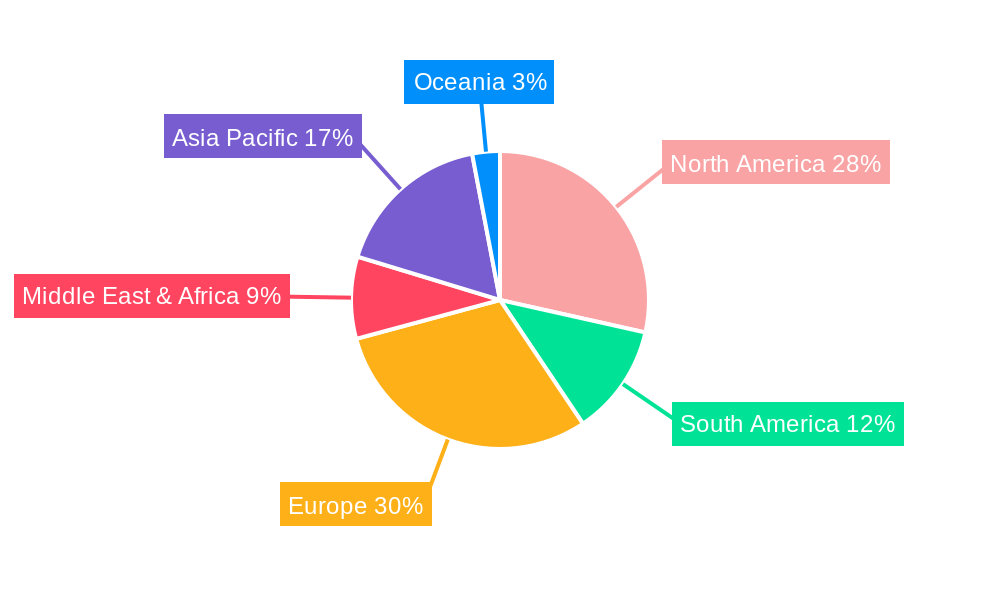
North America currently holds the largest market share in the low-fat cheese cubes market, followed by Europe and Asia-Pacific. The dominance of North America is attributable to high consumer spending power and established distribution networks.
- Key Drivers in North America:
- Strong consumer demand for convenient and healthy snack options.
- Well-established retail infrastructure.
- High per capita consumption of cheese.
- Growth Potential in Asia-Pacific: This region is anticipated to witness significant growth in the forecast period, driven by rising disposable incomes, changing dietary habits, and increasing urbanization.
- Market Share and Growth Potential: North America holds approximately 45% of the global market share in 2025, with Europe at 30% and Asia-Pacific at 20%. The Asia-Pacific region is projected to exhibit the highest growth rate over the forecast period.
Low Fat Cheese Cubes Product Landscape
Low-fat cheese cubes are available in various flavors and formats, catering to diverse consumer preferences. Product innovation focuses on improving taste and texture while maintaining low-fat content. This involves using specialized enzymes, milk protein concentrates, and natural flavor enhancers. Manufacturers increasingly focus on unique selling propositions, such as added probiotics or organic ingredients, to enhance product appeal. Technological advancements in packaging, such as modified atmosphere packaging (MAP), extend shelf life and improve product freshness.
Key Drivers, Barriers & Challenges in Low Fat Cheese Cubes
Key Drivers:
- Health and Wellness Trends: The growing awareness of health and wellness drives demand for low-fat alternatives.
- Convenience: Low-fat cheese cubes offer a convenient and portable snack option.
- Product Innovation: Continuous product development focuses on improving taste and texture.
Key Challenges & Restraints:
- Maintaining Taste and Texture: Reducing fat content can affect the overall quality of the product, posing a challenge to manufacturers.
- Cost: The production of low-fat cheese cubes can be more expensive than their full-fat counterparts, impacting pricing and affordability.
- Competition: Intense competition from other snack food categories can limit market expansion. This competition is estimated to impact the market share by approximately 5% by 2033.
Emerging Opportunities in Low Fat Cheese Cubes
- Untapped Markets: Expanding into emerging markets, particularly in Asia and Africa, offers significant growth potential.
- Innovation in Flavors and Formats: Introducing new flavors and formats, such as mini cubes or sticks, can attract new customers and enhance market reach.
- Sustainable Packaging: Adopting sustainable and eco-friendly packaging solutions can enhance brand image and appeal to environmentally conscious consumers.
Growth Accelerators in the Low Fat Cheese Cubes Industry
Technological breakthroughs in cheese processing and packaging significantly accelerate market growth. Strategic partnerships between manufacturers and retailers enhance distribution and marketing reach. Market expansion into new geographical territories, particularly emerging economies, will further drive long-term growth in the low-fat cheese cubes market. Investing in research and development to improve the taste and texture of low-fat cheese cubes is crucial for sustained success.
Key Players Shaping the Low Fat Cheese Cubes Market
- Arla Foods
- Leprino Foods
- Bel Group
- Savencia Fromage & Dairy
- Kraft Foods Group
- Rumiano Cheese
- Granarolo
- Crystal Farms
- Saputo
- Friesland Campina
- Devondale
- Anchor
- Mainland
- Lactalis Group
- Finlandia Cheese
Notable Milestones in Low Fat Cheese Cubes Sector
- 2020: Introduction of a new line of organic low-fat cheese cubes by Arla Foods.
- 2022: Savencia Fromage & Dairy acquires a smaller cheese producer, expanding its product portfolio.
- 2023: Kraft Foods Group launches a new range of low-fat cheese cubes with added probiotics.
- 2024: Leprino Foods invests in advanced cheese processing technology to improve efficiency and quality.
In-Depth Low Fat Cheese Cubes Market Outlook
The low-fat cheese cubes market is poised for substantial growth in the coming years. Continued innovation in product development, strategic partnerships, and expansion into new markets will drive this growth. Companies focusing on sustainability and healthier product offerings will gain a competitive advantage. The market's long-term potential lies in catering to the increasing demand for convenient, healthy, and sustainable snack options. The projected market size increase is largely attributed to expanding global health-conscious consumers and increasing disposable incomes in developing countries.
Low Fat Cheese Cubes Segmentation
-
1. Application
- 1.1. Restaurant
- 1.2. Bakery
- 1.3. Others
-
2. Type
- 2.1. Sugary
- 2.2. Sugar Free
Low Fat Cheese Cubes Segmentation By Geography
-
1. North America
- 1.1. United States
- 1.2. Canada
- 1.3. Mexico
-
2. South America
- 2.1. Brazil
- 2.2. Argentina
- 2.3. Rest of South America
-
3. Europe
- 3.1. United Kingdom
- 3.2. Germany
- 3.3. France
- 3.4. Italy
- 3.5. Spain
- 3.6. Russia
- 3.7. Benelux
- 3.8. Nordics
- 3.9. Rest of Europe
-
4. Middle East & Africa
- 4.1. Turkey
- 4.2. Israel
- 4.3. GCC
- 4.4. North Africa
- 4.5. South Africa
- 4.6. Rest of Middle East & Africa
-
5. Asia Pacific
- 5.1. China
- 5.2. India
- 5.3. Japan
- 5.4. South Korea
- 5.5. ASEAN
- 5.6. Oceania
- 5.7. Rest of Asia Pacific
Low Fat Cheese Cubes Regional Market Share
Geographic Coverage of Low Fat Cheese Cubes
Low Fat Cheese Cubes REPORT HIGHLIGHTS
| Aspects | Details |
|---|---|
| Study Period | 2020-2034 |
| Base Year | 2025 |
| Estimated Year | 2026 |
| Forecast Period | 2026-2034 |
| Historical Period | 2020-2025 |
| Growth Rate | CAGR of 4.3% from 2020-2034 |
| Segmentation |
|
Table of Contents
- 1. Introduction
- 1.1. Research Scope
- 1.2. Market Segmentation
- 1.3. Research Methodology
- 1.4. Definitions and Assumptions
- 2. Executive Summary
- 2.1. Introduction
- 3. Market Dynamics
- 3.1. Introduction
- 3.2. Market Drivers
- 3.3. Market Restrains
- 3.4. Market Trends
- 4. Market Factor Analysis
- 4.1. Porters Five Forces
- 4.2. Supply/Value Chain
- 4.3. PESTEL analysis
- 4.4. Market Entropy
- 4.5. Patent/Trademark Analysis
- 5. Global Low Fat Cheese Cubes Analysis, Insights and Forecast, 2020-2032
- 5.1. Market Analysis, Insights and Forecast - by Application
- 5.1.1. Restaurant
- 5.1.2. Bakery
- 5.1.3. Others
- 5.2. Market Analysis, Insights and Forecast - by Type
- 5.2.1. Sugary
- 5.2.2. Sugar Free
- 5.3. Market Analysis, Insights and Forecast - by Region
- 5.3.1. North America
- 5.3.2. South America
- 5.3.3. Europe
- 5.3.4. Middle East & Africa
- 5.3.5. Asia Pacific
- 5.1. Market Analysis, Insights and Forecast - by Application
- 6. North America Low Fat Cheese Cubes Analysis, Insights and Forecast, 2020-2032
- 6.1. Market Analysis, Insights and Forecast - by Application
- 6.1.1. Restaurant
- 6.1.2. Bakery
- 6.1.3. Others
- 6.2. Market Analysis, Insights and Forecast - by Type
- 6.2.1. Sugary
- 6.2.2. Sugar Free
- 6.1. Market Analysis, Insights and Forecast - by Application
- 7. South America Low Fat Cheese Cubes Analysis, Insights and Forecast, 2020-2032
- 7.1. Market Analysis, Insights and Forecast - by Application
- 7.1.1. Restaurant
- 7.1.2. Bakery
- 7.1.3. Others
- 7.2. Market Analysis, Insights and Forecast - by Type
- 7.2.1. Sugary
- 7.2.2. Sugar Free
- 7.1. Market Analysis, Insights and Forecast - by Application
- 8. Europe Low Fat Cheese Cubes Analysis, Insights and Forecast, 2020-2032
- 8.1. Market Analysis, Insights and Forecast - by Application
- 8.1.1. Restaurant
- 8.1.2. Bakery
- 8.1.3. Others
- 8.2. Market Analysis, Insights and Forecast - by Type
- 8.2.1. Sugary
- 8.2.2. Sugar Free
- 8.1. Market Analysis, Insights and Forecast - by Application
- 9. Middle East & Africa Low Fat Cheese Cubes Analysis, Insights and Forecast, 2020-2032
- 9.1. Market Analysis, Insights and Forecast - by Application
- 9.1.1. Restaurant
- 9.1.2. Bakery
- 9.1.3. Others
- 9.2. Market Analysis, Insights and Forecast - by Type
- 9.2.1. Sugary
- 9.2.2. Sugar Free
- 9.1. Market Analysis, Insights and Forecast - by Application
- 10. Asia Pacific Low Fat Cheese Cubes Analysis, Insights and Forecast, 2020-2032
- 10.1. Market Analysis, Insights and Forecast - by Application
- 10.1.1. Restaurant
- 10.1.2. Bakery
- 10.1.3. Others
- 10.2. Market Analysis, Insights and Forecast - by Type
- 10.2.1. Sugary
- 10.2.2. Sugar Free
- 10.1. Market Analysis, Insights and Forecast - by Application
- 11. Competitive Analysis
- 11.1. Global Market Share Analysis 2025
- 11.2. Company Profiles
- 11.2.1 Arla Foods
- 11.2.1.1. Overview
- 11.2.1.2. Products
- 11.2.1.3. SWOT Analysis
- 11.2.1.4. Recent Developments
- 11.2.1.5. Financials (Based on Availability)
- 11.2.2 Leprino Foods
- 11.2.2.1. Overview
- 11.2.2.2. Products
- 11.2.2.3. SWOT Analysis
- 11.2.2.4. Recent Developments
- 11.2.2.5. Financials (Based on Availability)
- 11.2.3 Bel Group
- 11.2.3.1. Overview
- 11.2.3.2. Products
- 11.2.3.3. SWOT Analysis
- 11.2.3.4. Recent Developments
- 11.2.3.5. Financials (Based on Availability)
- 11.2.4 Savencia Fromage and Dairy
- 11.2.4.1. Overview
- 11.2.4.2. Products
- 11.2.4.3. SWOT Analysis
- 11.2.4.4. Recent Developments
- 11.2.4.5. Financials (Based on Availability)
- 11.2.5 Kraft Foods Group
- 11.2.5.1. Overview
- 11.2.5.2. Products
- 11.2.5.3. SWOT Analysis
- 11.2.5.4. Recent Developments
- 11.2.5.5. Financials (Based on Availability)
- 11.2.6 Rumiano Cheese
- 11.2.6.1. Overview
- 11.2.6.2. Products
- 11.2.6.3. SWOT Analysis
- 11.2.6.4. Recent Developments
- 11.2.6.5. Financials (Based on Availability)
- 11.2.7 Granarolo
- 11.2.7.1. Overview
- 11.2.7.2. Products
- 11.2.7.3. SWOT Analysis
- 11.2.7.4. Recent Developments
- 11.2.7.5. Financials (Based on Availability)
- 11.2.8 Crystal Farms
- 11.2.8.1. Overview
- 11.2.8.2. Products
- 11.2.8.3. SWOT Analysis
- 11.2.8.4. Recent Developments
- 11.2.8.5. Financials (Based on Availability)
- 11.2.9 Saputo
- 11.2.9.1. Overview
- 11.2.9.2. Products
- 11.2.9.3. SWOT Analysis
- 11.2.9.4. Recent Developments
- 11.2.9.5. Financials (Based on Availability)
- 11.2.10 Friesland Campina
- 11.2.10.1. Overview
- 11.2.10.2. Products
- 11.2.10.3. SWOT Analysis
- 11.2.10.4. Recent Developments
- 11.2.10.5. Financials (Based on Availability)
- 11.2.11 Devondale
- 11.2.11.1. Overview
- 11.2.11.2. Products
- 11.2.11.3. SWOT Analysis
- 11.2.11.4. Recent Developments
- 11.2.11.5. Financials (Based on Availability)
- 11.2.12 Anchor
- 11.2.12.1. Overview
- 11.2.12.2. Products
- 11.2.12.3. SWOT Analysis
- 11.2.12.4. Recent Developments
- 11.2.12.5. Financials (Based on Availability)
- 11.2.13 Mainland
- 11.2.13.1. Overview
- 11.2.13.2. Products
- 11.2.13.3. SWOT Analysis
- 11.2.13.4. Recent Developments
- 11.2.13.5. Financials (Based on Availability)
- 11.2.14 Lactalis Group
- 11.2.14.1. Overview
- 11.2.14.2. Products
- 11.2.14.3. SWOT Analysis
- 11.2.14.4. Recent Developments
- 11.2.14.5. Financials (Based on Availability)
- 11.2.15 Finlandia Cheese
- 11.2.15.1. Overview
- 11.2.15.2. Products
- 11.2.15.3. SWOT Analysis
- 11.2.15.4. Recent Developments
- 11.2.15.5. Financials (Based on Availability)
- 11.2.1 Arla Foods
List of Figures
- Figure 1: Global Low Fat Cheese Cubes Revenue Breakdown (undefined, %) by Region 2025 & 2033
- Figure 2: North America Low Fat Cheese Cubes Revenue (undefined), by Application 2025 & 2033
- Figure 3: North America Low Fat Cheese Cubes Revenue Share (%), by Application 2025 & 2033
- Figure 4: North America Low Fat Cheese Cubes Revenue (undefined), by Type 2025 & 2033
- Figure 5: North America Low Fat Cheese Cubes Revenue Share (%), by Type 2025 & 2033
- Figure 6: North America Low Fat Cheese Cubes Revenue (undefined), by Country 2025 & 2033
- Figure 7: North America Low Fat Cheese Cubes Revenue Share (%), by Country 2025 & 2033
- Figure 8: South America Low Fat Cheese Cubes Revenue (undefined), by Application 2025 & 2033
- Figure 9: South America Low Fat Cheese Cubes Revenue Share (%), by Application 2025 & 2033
- Figure 10: South America Low Fat Cheese Cubes Revenue (undefined), by Type 2025 & 2033
- Figure 11: South America Low Fat Cheese Cubes Revenue Share (%), by Type 2025 & 2033
- Figure 12: South America Low Fat Cheese Cubes Revenue (undefined), by Country 2025 & 2033
- Figure 13: South America Low Fat Cheese Cubes Revenue Share (%), by Country 2025 & 2033
- Figure 14: Europe Low Fat Cheese Cubes Revenue (undefined), by Application 2025 & 2033
- Figure 15: Europe Low Fat Cheese Cubes Revenue Share (%), by Application 2025 & 2033
- Figure 16: Europe Low Fat Cheese Cubes Revenue (undefined), by Type 2025 & 2033
- Figure 17: Europe Low Fat Cheese Cubes Revenue Share (%), by Type 2025 & 2033
- Figure 18: Europe Low Fat Cheese Cubes Revenue (undefined), by Country 2025 & 2033
- Figure 19: Europe Low Fat Cheese Cubes Revenue Share (%), by Country 2025 & 2033
- Figure 20: Middle East & Africa Low Fat Cheese Cubes Revenue (undefined), by Application 2025 & 2033
- Figure 21: Middle East & Africa Low Fat Cheese Cubes Revenue Share (%), by Application 2025 & 2033
- Figure 22: Middle East & Africa Low Fat Cheese Cubes Revenue (undefined), by Type 2025 & 2033
- Figure 23: Middle East & Africa Low Fat Cheese Cubes Revenue Share (%), by Type 2025 & 2033
- Figure 24: Middle East & Africa Low Fat Cheese Cubes Revenue (undefined), by Country 2025 & 2033
- Figure 25: Middle East & Africa Low Fat Cheese Cubes Revenue Share (%), by Country 2025 & 2033
- Figure 26: Asia Pacific Low Fat Cheese Cubes Revenue (undefined), by Application 2025 & 2033
- Figure 27: Asia Pacific Low Fat Cheese Cubes Revenue Share (%), by Application 2025 & 2033
- Figure 28: Asia Pacific Low Fat Cheese Cubes Revenue (undefined), by Type 2025 & 2033
- Figure 29: Asia Pacific Low Fat Cheese Cubes Revenue Share (%), by Type 2025 & 2033
- Figure 30: Asia Pacific Low Fat Cheese Cubes Revenue (undefined), by Country 2025 & 2033
- Figure 31: Asia Pacific Low Fat Cheese Cubes Revenue Share (%), by Country 2025 & 2033
List of Tables
- Table 1: Global Low Fat Cheese Cubes Revenue undefined Forecast, by Application 2020 & 2033
- Table 2: Global Low Fat Cheese Cubes Revenue undefined Forecast, by Type 2020 & 2033
- Table 3: Global Low Fat Cheese Cubes Revenue undefined Forecast, by Region 2020 & 2033
- Table 4: Global Low Fat Cheese Cubes Revenue undefined Forecast, by Application 2020 & 2033
- Table 5: Global Low Fat Cheese Cubes Revenue undefined Forecast, by Type 2020 & 2033
- Table 6: Global Low Fat Cheese Cubes Revenue undefined Forecast, by Country 2020 & 2033
- Table 7: United States Low Fat Cheese Cubes Revenue (undefined) Forecast, by Application 2020 & 2033
- Table 8: Canada Low Fat Cheese Cubes Revenue (undefined) Forecast, by Application 2020 & 2033
- Table 9: Mexico Low Fat Cheese Cubes Revenue (undefined) Forecast, by Application 2020 & 2033
- Table 10: Global Low Fat Cheese Cubes Revenue undefined Forecast, by Application 2020 & 2033
- Table 11: Global Low Fat Cheese Cubes Revenue undefined Forecast, by Type 2020 & 2033
- Table 12: Global Low Fat Cheese Cubes Revenue undefined Forecast, by Country 2020 & 2033
- Table 13: Brazil Low Fat Cheese Cubes Revenue (undefined) Forecast, by Application 2020 & 2033
- Table 14: Argentina Low Fat Cheese Cubes Revenue (undefined) Forecast, by Application 2020 & 2033
- Table 15: Rest of South America Low Fat Cheese Cubes Revenue (undefined) Forecast, by Application 2020 & 2033
- Table 16: Global Low Fat Cheese Cubes Revenue undefined Forecast, by Application 2020 & 2033
- Table 17: Global Low Fat Cheese Cubes Revenue undefined Forecast, by Type 2020 & 2033
- Table 18: Global Low Fat Cheese Cubes Revenue undefined Forecast, by Country 2020 & 2033
- Table 19: United Kingdom Low Fat Cheese Cubes Revenue (undefined) Forecast, by Application 2020 & 2033
- Table 20: Germany Low Fat Cheese Cubes Revenue (undefined) Forecast, by Application 2020 & 2033
- Table 21: France Low Fat Cheese Cubes Revenue (undefined) Forecast, by Application 2020 & 2033
- Table 22: Italy Low Fat Cheese Cubes Revenue (undefined) Forecast, by Application 2020 & 2033
- Table 23: Spain Low Fat Cheese Cubes Revenue (undefined) Forecast, by Application 2020 & 2033
- Table 24: Russia Low Fat Cheese Cubes Revenue (undefined) Forecast, by Application 2020 & 2033
- Table 25: Benelux Low Fat Cheese Cubes Revenue (undefined) Forecast, by Application 2020 & 2033
- Table 26: Nordics Low Fat Cheese Cubes Revenue (undefined) Forecast, by Application 2020 & 2033
- Table 27: Rest of Europe Low Fat Cheese Cubes Revenue (undefined) Forecast, by Application 2020 & 2033
- Table 28: Global Low Fat Cheese Cubes Revenue undefined Forecast, by Application 2020 & 2033
- Table 29: Global Low Fat Cheese Cubes Revenue undefined Forecast, by Type 2020 & 2033
- Table 30: Global Low Fat Cheese Cubes Revenue undefined Forecast, by Country 2020 & 2033
- Table 31: Turkey Low Fat Cheese Cubes Revenue (undefined) Forecast, by Application 2020 & 2033
- Table 32: Israel Low Fat Cheese Cubes Revenue (undefined) Forecast, by Application 2020 & 2033
- Table 33: GCC Low Fat Cheese Cubes Revenue (undefined) Forecast, by Application 2020 & 2033
- Table 34: North Africa Low Fat Cheese Cubes Revenue (undefined) Forecast, by Application 2020 & 2033
- Table 35: South Africa Low Fat Cheese Cubes Revenue (undefined) Forecast, by Application 2020 & 2033
- Table 36: Rest of Middle East & Africa Low Fat Cheese Cubes Revenue (undefined) Forecast, by Application 2020 & 2033
- Table 37: Global Low Fat Cheese Cubes Revenue undefined Forecast, by Application 2020 & 2033
- Table 38: Global Low Fat Cheese Cubes Revenue undefined Forecast, by Type 2020 & 2033
- Table 39: Global Low Fat Cheese Cubes Revenue undefined Forecast, by Country 2020 & 2033
- Table 40: China Low Fat Cheese Cubes Revenue (undefined) Forecast, by Application 2020 & 2033
- Table 41: India Low Fat Cheese Cubes Revenue (undefined) Forecast, by Application 2020 & 2033
- Table 42: Japan Low Fat Cheese Cubes Revenue (undefined) Forecast, by Application 2020 & 2033
- Table 43: South Korea Low Fat Cheese Cubes Revenue (undefined) Forecast, by Application 2020 & 2033
- Table 44: ASEAN Low Fat Cheese Cubes Revenue (undefined) Forecast, by Application 2020 & 2033
- Table 45: Oceania Low Fat Cheese Cubes Revenue (undefined) Forecast, by Application 2020 & 2033
- Table 46: Rest of Asia Pacific Low Fat Cheese Cubes Revenue (undefined) Forecast, by Application 2020 & 2033
Frequently Asked Questions
1. What is the projected Compound Annual Growth Rate (CAGR) of the Low Fat Cheese Cubes?
The projected CAGR is approximately 4.3%.
2. Which companies are prominent players in the Low Fat Cheese Cubes?
Key companies in the market include Arla Foods, Leprino Foods, Bel Group, Savencia Fromage and Dairy, Kraft Foods Group, Rumiano Cheese, Granarolo, Crystal Farms, Saputo, Friesland Campina, Devondale, Anchor, Mainland, Lactalis Group, Finlandia Cheese.
3. What are the main segments of the Low Fat Cheese Cubes?
The market segments include Application, Type.
4. Can you provide details about the market size?
The market size is estimated to be USD XXX N/A as of 2022.
5. What are some drivers contributing to market growth?
N/A
6. What are the notable trends driving market growth?
N/A
7. Are there any restraints impacting market growth?
N/A
8. Can you provide examples of recent developments in the market?
N/A
9. What pricing options are available for accessing the report?
Pricing options include single-user, multi-user, and enterprise licenses priced at USD 2900.00, USD 4350.00, and USD 5800.00 respectively.
10. Is the market size provided in terms of value or volume?
The market size is provided in terms of value, measured in N/A.
11. Are there any specific market keywords associated with the report?
Yes, the market keyword associated with the report is "Low Fat Cheese Cubes," which aids in identifying and referencing the specific market segment covered.
12. How do I determine which pricing option suits my needs best?
The pricing options vary based on user requirements and access needs. Individual users may opt for single-user licenses, while businesses requiring broader access may choose multi-user or enterprise licenses for cost-effective access to the report.
13. Are there any additional resources or data provided in the Low Fat Cheese Cubes report?
While the report offers comprehensive insights, it's advisable to review the specific contents or supplementary materials provided to ascertain if additional resources or data are available.
14. How can I stay updated on further developments or reports in the Low Fat Cheese Cubes?
To stay informed about further developments, trends, and reports in the Low Fat Cheese Cubes, consider subscribing to industry newsletters, following relevant companies and organizations, or regularly checking reputable industry news sources and publications.
Methodology
Step 1 - Identification of Relevant Samples Size from Population Database


Step 2 - Approaches for Defining Global Market Size (Value, Volume* & Price*)

Note*: In applicable scenarios
Step 3 - Data Sources
Primary Research
- Web Analytics
- Survey Reports
- Research Institute
- Latest Research Reports
- Opinion Leaders
Secondary Research
- Annual Reports
- White Paper
- Latest Press Release
- Industry Association
- Paid Database
- Investor Presentations

Step 4 - Data Triangulation
Involves using different sources of information in order to increase the validity of a study
These sources are likely to be stakeholders in a program - participants, other researchers, program staff, other community members, and so on.
Then we put all data in single framework & apply various statistical tools to find out the dynamic on the market.
During the analysis stage, feedback from the stakeholder groups would be compared to determine areas of agreement as well as areas of divergence