

Key Insights
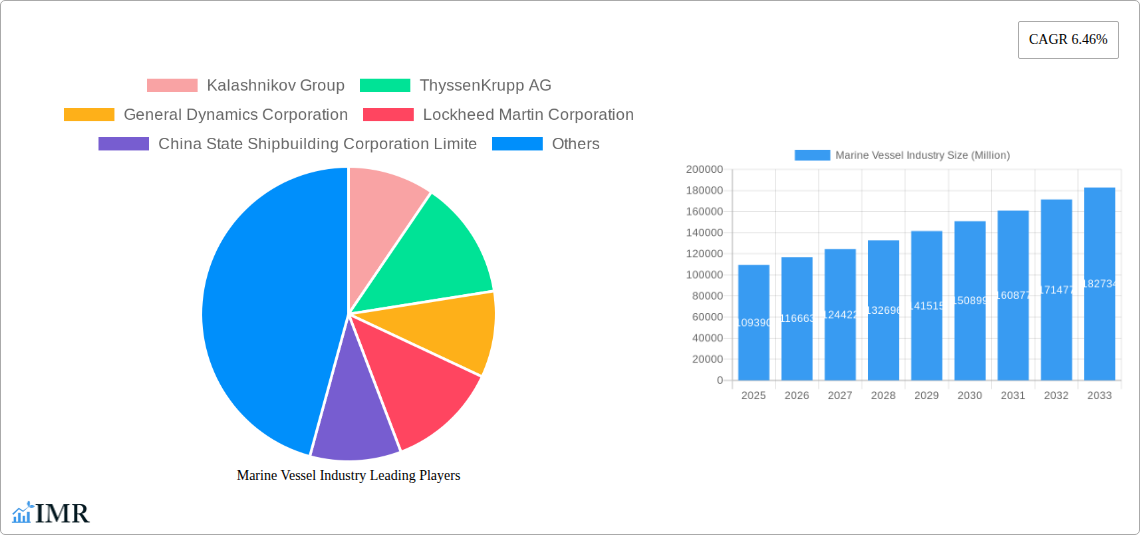
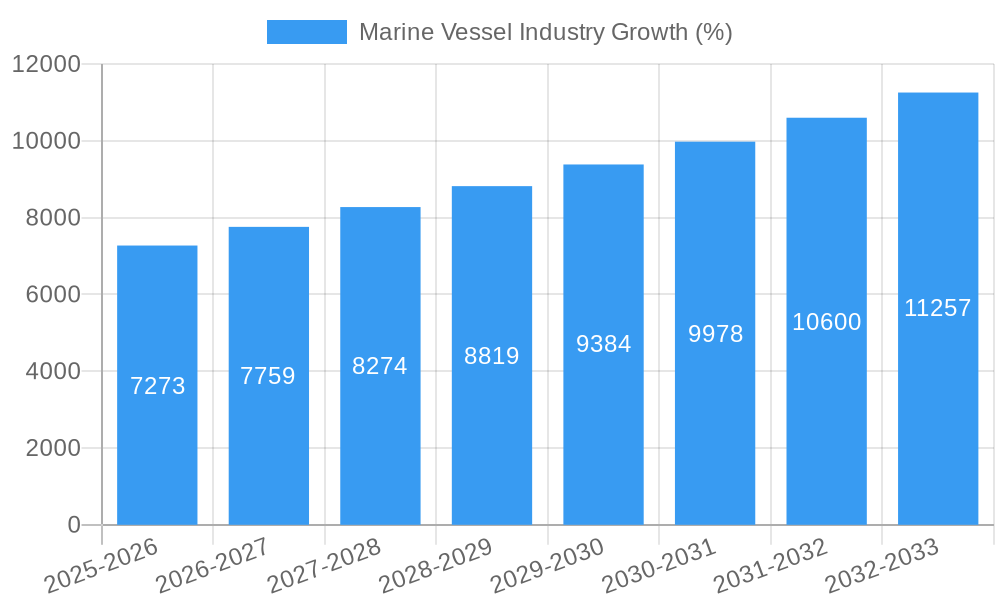
The global marine vessel industry, valued at $109.39 billion in 2025, is projected to experience robust growth, exhibiting a Compound Annual Growth Rate (CAGR) of 6.46% from 2025 to 2033. This expansion is fueled by several key factors. Increased geopolitical instability and rising defense budgets globally are driving demand for military vessels like destroyers, frigates, and submarines. Simultaneously, the burgeoning global trade necessitates larger and more efficient commercial vessels, contributing significantly to market growth. Technological advancements in shipbuilding, including automation and the integration of advanced sensors and communication systems, are further enhancing vessel capabilities and driving market expansion. While fluctuating raw material prices and potential supply chain disruptions pose challenges, the overall industry outlook remains positive. The diverse segments within the market, encompassing various vessel types catering to different needs (military, commercial, and specialized), ensures a degree of resilience against localized economic downturns. Competition among major players like Huntington Ingalls Industries, BAE Systems, and China State Shipbuilding Corporation, while intense, fosters innovation and efficiency within the industry.
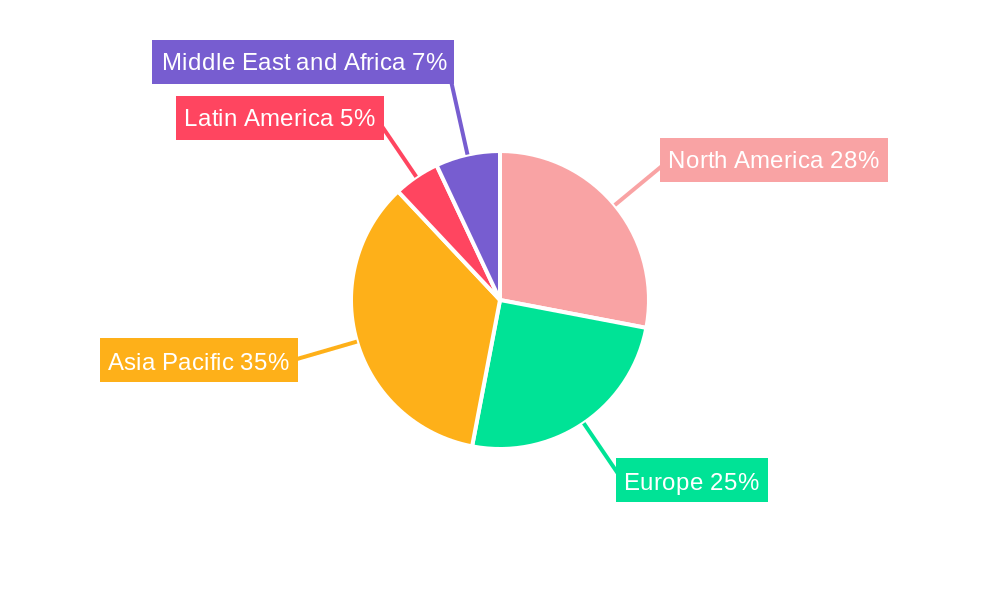
Regional growth is expected to be varied. While North America and Europe maintain significant market shares due to established naval capabilities and robust commercial shipping sectors, the Asia-Pacific region is anticipated to demonstrate the fastest growth, driven by increasing infrastructure development and expanding maritime trade routes in countries like China and India. The Middle East and Africa are also poised for expansion, fueled by investment in port infrastructure and naval modernization programs. This dynamic interplay of geopolitical factors, technological advancements, and regional economic disparities will shape the future of the marine vessel industry over the next decade. The continued focus on sustainability and environmentally friendly vessel designs will also play a crucial role in the industry’s trajectory.
Marine Vessel Industry Market Report: 2019-2033
This comprehensive report provides an in-depth analysis of the global marine vessel industry, encompassing market dynamics, growth trends, regional dominance, product landscape, and key players. With a study period spanning 2019-2033, a base year of 2025, and a forecast period of 2025-2033, this report is an essential resource for industry professionals, investors, and strategic decision-makers. The report analyzes the parent market of the defense industry and the child market of marine vessel manufacturing, offering a granular view of this dynamic sector. Market values are presented in millions of units (USD).
Marine Vessel Industry Market Dynamics & Structure
The marine vessel industry is characterized by a moderately concentrated market structure, with several large players holding significant market share. Technological innovation, primarily driven by advancements in propulsion systems, automation, and onboard technology, plays a crucial role in shaping market dynamics. Stringent regulatory frameworks, particularly those concerning environmental compliance and safety standards, influence vessel design and operation. Competition from alternative transportation modes, such as air freight and pipelines, also shapes the market. End-user demographics, largely comprised of navies, commercial shipping companies, and offshore operators, significantly impact demand. M&A activity has been moderate in recent years, with a total estimated deal volume of xx million USD during the historical period (2019-2024), reflecting consolidation and expansion efforts among key players.
- Market Concentration: Moderately concentrated, with top 5 players holding an estimated xx% market share in 2024.
- Technological Innovation: Focus on autonomous vessels, electric propulsion, and advanced sensor technologies.
- Regulatory Landscape: Stringent environmental regulations (IMO 2020, etc.) and safety standards impacting design and operations.
- Competitive Substitutes: Air freight, pipelines, and other transportation modes pose competition.
- End-User Demographics: Navies, commercial shipping companies, and offshore energy operators.
- M&A Activity: xx million USD deal volume (2019-2024), indicating consolidation and strategic expansion.
Marine Vessel Industry Growth Trends & Insights
The global marine vessel market is projected to experience significant growth during the forecast period (2025-2033). Driven by factors such as increasing global trade, expanding offshore energy exploration, and rising defense budgets, the market is expected to exhibit a Compound Annual Growth Rate (CAGR) of xx% from 2025 to 2033, reaching an estimated market size of xx million USD by 2033. Market penetration of advanced technologies like autonomous systems is steadily increasing, albeit gradually due to associated costs and regulatory hurdles. Shifting consumer behavior, such as increased demand for fuel-efficient and environmentally friendly vessels, is influencing vessel design and manufacturing.
Dominant Regions, Countries, or Segments in Marine Vessel Industry
The Asia-Pacific region is projected to dominate the marine vessel market throughout the forecast period, driven primarily by robust economic growth, substantial infrastructure development, and increased maritime activities. China and India, in particular, are expected to be significant contributors due to their expanding navies and growing commercial shipping sectors. Within vessel types, the demand for destroyers, frigates, and corvettes is expected to remain substantial, driven by defense modernization programs globally.
- Key Drivers (Asia-Pacific): Rapid economic growth, increasing defense spending, and substantial infrastructure investment in port facilities.
- Market Share: Asia-Pacific is estimated to hold xx% of the global market share in 2025.
- Growth Potential: High growth potential due to ongoing investment in naval capabilities and commercial shipping expansion.
- Dominant Vessel Type: Destroyers and Frigates, driven by naval modernization programs across multiple countries.
Marine Vessel Industry Product Landscape
The marine vessel industry showcases a diverse product landscape, encompassing various vessel types, each tailored to specific applications. Innovations are focused on improving fuel efficiency, enhancing operational capabilities, and incorporating advanced technologies, such as AI-powered navigation and autonomous systems. Unique selling propositions often involve advanced materials, customized designs, and state-of-the-art equipment, leading to enhanced performance, safety, and cost-effectiveness.
Key Drivers, Barriers & Challenges in Marine Vessel Industry
Key Drivers: Increased global trade, rising defense budgets, growing demand for offshore energy exploration, and technological advancements in vessel design and manufacturing are major drivers of market growth.
Key Challenges: Supply chain disruptions, particularly regarding component availability and skilled labor shortages, pose significant challenges. Strict environmental regulations and evolving safety standards impose significant costs and compliance complexities. Intense competition, particularly from established players in the market, also necessitates continuous innovation and cost optimization. These factors have estimatedly resulted in a xx% increase in production costs over the past 5 years.
Emerging Opportunities in Marine Vessel Industry
Emerging opportunities lie in the expansion of autonomous vessel technologies, the development of environmentally friendly propulsion systems, and the growth of niche markets, such as specialized offshore support vessels for renewable energy projects. Unmet demand in developing economies for commercial vessels and the increasing adoption of advanced vessel monitoring and maintenance systems also present promising avenues for growth.
Growth Accelerators in the Marine Vessel Industry Industry
Strategic partnerships between manufacturers and technology providers are driving innovation and accelerating market growth. Government initiatives promoting sustainable shipping and investments in port infrastructure are also creating favorable conditions for market expansion. Technological breakthroughs, particularly in areas like electric and hybrid propulsion systems, are poised to reshape the market landscape.
Key Players Shaping the Marine Vessel Industry Market
- Kalashnikov Group
- ThyssenKrupp AG
- General Dynamics Corporation
- Lockheed Martin Corporation
- China State Shipbuilding Corporation Limited
- Fr Lurssen Werft Gmbh & Co KG
- Naval Group SA
- BAE Systems PLC
- Austal Limited
- Huntington Ingalls Industries Inc
- EDGE Group PJSC
- HD Korea Shipbuilding & Offshore Engineering Co Ltd
- Navantia SA SME
- Hanwha Ocean (Hanwha Group)
- FINCANTIERI SpA
- Damen Shipyards Group
- LARSEN & TOUBRO LIMITED
- PT PAL Indonesia
Notable Milestones in Marine Vessel Industry Sector
- April 2023: The UK Ministry of Defence awarded a USD 57 million contract to BAE Systems plc for C4I services for surface vessels.
- March 2023: The Indian Navy contracted Goa Shipyard (GSL) and Garden Reach Shipbuilders & Engineers (GRSE) to produce 11 offshore patrol vessels and six next-generation missile vessels.
In-Depth Marine Vessel Industry Market Outlook
The marine vessel industry is poised for continued growth, driven by technological advancements, increased defense spending, and the burgeoning demand for specialized vessels in the offshore energy and renewable energy sectors. Strategic partnerships and innovative financing models are expected to further accelerate market expansion, unlocking significant opportunities for established players and new entrants alike. The focus on sustainability and automation will continue to shape product development and market competition, paving the way for a more efficient and environmentally conscious maritime industry.
Marine Vessel Industry Segmentation
-
1. Vessel Type
- 1.1. Destroyers
- 1.2. Frigates
- 1.3. Submarines
- 1.4. Corvettes
- 1.5. Aircraft Carriers
- 1.6. Other Vessel Types
Marine Vessel Industry Segmentation By Geography
-
1. North America
- 1.1. United States
- 1.2. Canada
-
2. Europe
- 2.1. Germany
- 2.2. United Kingdom
- 2.3. France
- 2.4. Russia
- 2.5. Spain
- 2.6. Rest of Europe
-
3. Asia Pacific
- 3.1. China
- 3.2. India
- 3.3. Japan
- 3.4. South Korea
- 3.5. Australia
- 3.6. Singapore
- 3.7. Rest of Asia Pacific
-
4. Latin America
- 4.1. Brazil
- 4.2. Mexico
- 4.3. Rest of Latin America
-
5. Middle East and Africa
- 5.1. United Arab Emirates
- 5.2. Saudi Arabia
- 5.3. South Africa
- 5.4. Rest of Middle East and Africa
Marine Vessel Industry REPORT HIGHLIGHTS
| Aspects | Details |
|---|---|
| Study Period | 2019-2033 |
| Base Year | 2024 |
| Estimated Year | 2025 |
| Forecast Period | 2025-2033 |
| Historical Period | 2019-2024 |
| Growth Rate | CAGR of 6.46% from 2019-2033 |
| Segmentation |
|
Table of Contents
- 1. Introduction
- 1.1. Research Scope
- 1.2. Market Segmentation
- 1.3. Research Methodology
- 1.4. Definitions and Assumptions
- 2. Executive Summary
- 2.1. Introduction
- 3. Market Dynamics
- 3.1. Introduction
- 3.2. Market Drivers
- 3.3. Market Restrains
- 3.4. Market Trends
- 3.4.1. Submarines Segment is Expected to Witness Significant Growth During the Forecast Period
- 4. Market Factor Analysis
- 4.1. Porters Five Forces
- 4.2. Supply/Value Chain
- 4.3. PESTEL analysis
- 4.4. Market Entropy
- 4.5. Patent/Trademark Analysis
- 5. Global Marine Vessel Industry Analysis, Insights and Forecast, 2019-2031
- 5.1. Market Analysis, Insights and Forecast - by Vessel Type
- 5.1.1. Destroyers
- 5.1.2. Frigates
- 5.1.3. Submarines
- 5.1.4. Corvettes
- 5.1.5. Aircraft Carriers
- 5.1.6. Other Vessel Types
- 5.2. Market Analysis, Insights and Forecast - by Region
- 5.2.1. North America
- 5.2.2. Europe
- 5.2.3. Asia Pacific
- 5.2.4. Latin America
- 5.2.5. Middle East and Africa
- 5.1. Market Analysis, Insights and Forecast - by Vessel Type
- 6. North America Marine Vessel Industry Analysis, Insights and Forecast, 2019-2031
- 6.1. Market Analysis, Insights and Forecast - by Vessel Type
- 6.1.1. Destroyers
- 6.1.2. Frigates
- 6.1.3. Submarines
- 6.1.4. Corvettes
- 6.1.5. Aircraft Carriers
- 6.1.6. Other Vessel Types
- 6.1. Market Analysis, Insights and Forecast - by Vessel Type
- 7. Europe Marine Vessel Industry Analysis, Insights and Forecast, 2019-2031
- 7.1. Market Analysis, Insights and Forecast - by Vessel Type
- 7.1.1. Destroyers
- 7.1.2. Frigates
- 7.1.3. Submarines
- 7.1.4. Corvettes
- 7.1.5. Aircraft Carriers
- 7.1.6. Other Vessel Types
- 7.1. Market Analysis, Insights and Forecast - by Vessel Type
- 8. Asia Pacific Marine Vessel Industry Analysis, Insights and Forecast, 2019-2031
- 8.1. Market Analysis, Insights and Forecast - by Vessel Type
- 8.1.1. Destroyers
- 8.1.2. Frigates
- 8.1.3. Submarines
- 8.1.4. Corvettes
- 8.1.5. Aircraft Carriers
- 8.1.6. Other Vessel Types
- 8.1. Market Analysis, Insights and Forecast - by Vessel Type
- 9. Latin America Marine Vessel Industry Analysis, Insights and Forecast, 2019-2031
- 9.1. Market Analysis, Insights and Forecast - by Vessel Type
- 9.1.1. Destroyers
- 9.1.2. Frigates
- 9.1.3. Submarines
- 9.1.4. Corvettes
- 9.1.5. Aircraft Carriers
- 9.1.6. Other Vessel Types
- 9.1. Market Analysis, Insights and Forecast - by Vessel Type
- 10. Middle East and Africa Marine Vessel Industry Analysis, Insights and Forecast, 2019-2031
- 10.1. Market Analysis, Insights and Forecast - by Vessel Type
- 10.1.1. Destroyers
- 10.1.2. Frigates
- 10.1.3. Submarines
- 10.1.4. Corvettes
- 10.1.5. Aircraft Carriers
- 10.1.6. Other Vessel Types
- 10.1. Market Analysis, Insights and Forecast - by Vessel Type
- 11. North America Marine Vessel Industry Analysis, Insights and Forecast, 2019-2031
- 11.1. Market Analysis, Insights and Forecast - By Country/Sub-region
- 11.1.1 United States
- 11.1.2 Canada
- 12. Europe Marine Vessel Industry Analysis, Insights and Forecast, 2019-2031
- 12.1. Market Analysis, Insights and Forecast - By Country/Sub-region
- 12.1.1 Germany
- 12.1.2 United Kingdom
- 12.1.3 France
- 12.1.4 Russia
- 12.1.5 Spain
- 12.1.6 Rest of Europe
- 13. Asia Pacific Marine Vessel Industry Analysis, Insights and Forecast, 2019-2031
- 13.1. Market Analysis, Insights and Forecast - By Country/Sub-region
- 13.1.1 China
- 13.1.2 India
- 13.1.3 Japan
- 13.1.4 South Korea
- 13.1.5 Australia
- 13.1.6 Singapore
- 13.1.7 Rest of Asia Pacific
- 14. Latin America Marine Vessel Industry Analysis, Insights and Forecast, 2019-2031
- 14.1. Market Analysis, Insights and Forecast - By Country/Sub-region
- 14.1.1 Brazil
- 14.1.2 Mexico
- 14.1.3 Rest of Latin America
- 15. Middle East and Africa Marine Vessel Industry Analysis, Insights and Forecast, 2019-2031
- 15.1. Market Analysis, Insights and Forecast - By Country/Sub-region
- 15.1.1 United Arab Emirates
- 15.1.2 Saudi Arabia
- 15.1.3 South Africa
- 15.1.4 Rest of Middle East and Africa
- 16. Competitive Analysis
- 16.1. Global Market Share Analysis 2024
- 16.2. Company Profiles
- 16.2.1 Kalashnikov Group
- 16.2.1.1. Overview
- 16.2.1.2. Products
- 16.2.1.3. SWOT Analysis
- 16.2.1.4. Recent Developments
- 16.2.1.5. Financials (Based on Availability)
- 16.2.2 ThyssenKrupp AG
- 16.2.2.1. Overview
- 16.2.2.2. Products
- 16.2.2.3. SWOT Analysis
- 16.2.2.4. Recent Developments
- 16.2.2.5. Financials (Based on Availability)
- 16.2.3 General Dynamics Corporation
- 16.2.3.1. Overview
- 16.2.3.2. Products
- 16.2.3.3. SWOT Analysis
- 16.2.3.4. Recent Developments
- 16.2.3.5. Financials (Based on Availability)
- 16.2.4 Lockheed Martin Corporation
- 16.2.4.1. Overview
- 16.2.4.2. Products
- 16.2.4.3. SWOT Analysis
- 16.2.4.4. Recent Developments
- 16.2.4.5. Financials (Based on Availability)
- 16.2.5 China State Shipbuilding Corporation Limite
- 16.2.5.1. Overview
- 16.2.5.2. Products
- 16.2.5.3. SWOT Analysis
- 16.2.5.4. Recent Developments
- 16.2.5.5. Financials (Based on Availability)
- 16.2.6 Fr Lurssen Werft Gmbh & Co KG
- 16.2.6.1. Overview
- 16.2.6.2. Products
- 16.2.6.3. SWOT Analysis
- 16.2.6.4. Recent Developments
- 16.2.6.5. Financials (Based on Availability)
- 16.2.7 Naval Group SA
- 16.2.7.1. Overview
- 16.2.7.2. Products
- 16.2.7.3. SWOT Analysis
- 16.2.7.4. Recent Developments
- 16.2.7.5. Financials (Based on Availability)
- 16.2.8 BAE Systems PLC
- 16.2.8.1. Overview
- 16.2.8.2. Products
- 16.2.8.3. SWOT Analysis
- 16.2.8.4. Recent Developments
- 16.2.8.5. Financials (Based on Availability)
- 16.2.9 Austal Limited
- 16.2.9.1. Overview
- 16.2.9.2. Products
- 16.2.9.3. SWOT Analysis
- 16.2.9.4. Recent Developments
- 16.2.9.5. Financials (Based on Availability)
- 16.2.10 Huntington Ingalls Industries Inc
- 16.2.10.1. Overview
- 16.2.10.2. Products
- 16.2.10.3. SWOT Analysis
- 16.2.10.4. Recent Developments
- 16.2.10.5. Financials (Based on Availability)
- 16.2.11 EDGE Group PJSC
- 16.2.11.1. Overview
- 16.2.11.2. Products
- 16.2.11.3. SWOT Analysis
- 16.2.11.4. Recent Developments
- 16.2.11.5. Financials (Based on Availability)
- 16.2.12 HD Korea Shipbuilding & Offshore Engineering Co Ltd
- 16.2.12.1. Overview
- 16.2.12.2. Products
- 16.2.12.3. SWOT Analysis
- 16.2.12.4. Recent Developments
- 16.2.12.5. Financials (Based on Availability)
- 16.2.13 Navantia SA SME
- 16.2.13.1. Overview
- 16.2.13.2. Products
- 16.2.13.3. SWOT Analysis
- 16.2.13.4. Recent Developments
- 16.2.13.5. Financials (Based on Availability)
- 16.2.14 Hanwha Ocean (Hanwha Group)
- 16.2.14.1. Overview
- 16.2.14.2. Products
- 16.2.14.3. SWOT Analysis
- 16.2.14.4. Recent Developments
- 16.2.14.5. Financials (Based on Availability)
- 16.2.15 FINCANTIERI SpA
- 16.2.15.1. Overview
- 16.2.15.2. Products
- 16.2.15.3. SWOT Analysis
- 16.2.15.4. Recent Developments
- 16.2.15.5. Financials (Based on Availability)
- 16.2.16 Damen Shipyards Group
- 16.2.16.1. Overview
- 16.2.16.2. Products
- 16.2.16.3. SWOT Analysis
- 16.2.16.4. Recent Developments
- 16.2.16.5. Financials (Based on Availability)
- 16.2.17 LARSEN & TOUBRO LIMITED6 3 Other Players
- 16.2.17.1. Overview
- 16.2.17.2. Products
- 16.2.17.3. SWOT Analysis
- 16.2.17.4. Recent Developments
- 16.2.17.5. Financials (Based on Availability)
- 16.2.18 PT PAL Indonesia
- 16.2.18.1. Overview
- 16.2.18.2. Products
- 16.2.18.3. SWOT Analysis
- 16.2.18.4. Recent Developments
- 16.2.18.5. Financials (Based on Availability)
- 16.2.1 Kalashnikov Group
List of Figures
- Figure 1: Global Marine Vessel Industry Revenue Breakdown (Million, %) by Region 2024 & 2032
- Figure 2: North America Marine Vessel Industry Revenue (Million), by Country 2024 & 2032
- Figure 3: North America Marine Vessel Industry Revenue Share (%), by Country 2024 & 2032
- Figure 4: Europe Marine Vessel Industry Revenue (Million), by Country 2024 & 2032
- Figure 5: Europe Marine Vessel Industry Revenue Share (%), by Country 2024 & 2032
- Figure 6: Asia Pacific Marine Vessel Industry Revenue (Million), by Country 2024 & 2032
- Figure 7: Asia Pacific Marine Vessel Industry Revenue Share (%), by Country 2024 & 2032
- Figure 8: Latin America Marine Vessel Industry Revenue (Million), by Country 2024 & 2032
- Figure 9: Latin America Marine Vessel Industry Revenue Share (%), by Country 2024 & 2032
- Figure 10: Middle East and Africa Marine Vessel Industry Revenue (Million), by Country 2024 & 2032
- Figure 11: Middle East and Africa Marine Vessel Industry Revenue Share (%), by Country 2024 & 2032
- Figure 12: North America Marine Vessel Industry Revenue (Million), by Vessel Type 2024 & 2032
- Figure 13: North America Marine Vessel Industry Revenue Share (%), by Vessel Type 2024 & 2032
- Figure 14: North America Marine Vessel Industry Revenue (Million), by Country 2024 & 2032
- Figure 15: North America Marine Vessel Industry Revenue Share (%), by Country 2024 & 2032
- Figure 16: Europe Marine Vessel Industry Revenue (Million), by Vessel Type 2024 & 2032
- Figure 17: Europe Marine Vessel Industry Revenue Share (%), by Vessel Type 2024 & 2032
- Figure 18: Europe Marine Vessel Industry Revenue (Million), by Country 2024 & 2032
- Figure 19: Europe Marine Vessel Industry Revenue Share (%), by Country 2024 & 2032
- Figure 20: Asia Pacific Marine Vessel Industry Revenue (Million), by Vessel Type 2024 & 2032
- Figure 21: Asia Pacific Marine Vessel Industry Revenue Share (%), by Vessel Type 2024 & 2032
- Figure 22: Asia Pacific Marine Vessel Industry Revenue (Million), by Country 2024 & 2032
- Figure 23: Asia Pacific Marine Vessel Industry Revenue Share (%), by Country 2024 & 2032
- Figure 24: Latin America Marine Vessel Industry Revenue (Million), by Vessel Type 2024 & 2032
- Figure 25: Latin America Marine Vessel Industry Revenue Share (%), by Vessel Type 2024 & 2032
- Figure 26: Latin America Marine Vessel Industry Revenue (Million), by Country 2024 & 2032
- Figure 27: Latin America Marine Vessel Industry Revenue Share (%), by Country 2024 & 2032
- Figure 28: Middle East and Africa Marine Vessel Industry Revenue (Million), by Vessel Type 2024 & 2032
- Figure 29: Middle East and Africa Marine Vessel Industry Revenue Share (%), by Vessel Type 2024 & 2032
- Figure 30: Middle East and Africa Marine Vessel Industry Revenue (Million), by Country 2024 & 2032
- Figure 31: Middle East and Africa Marine Vessel Industry Revenue Share (%), by Country 2024 & 2032
List of Tables
- Table 1: Global Marine Vessel Industry Revenue Million Forecast, by Region 2019 & 2032
- Table 2: Global Marine Vessel Industry Revenue Million Forecast, by Vessel Type 2019 & 2032
- Table 3: Global Marine Vessel Industry Revenue Million Forecast, by Region 2019 & 2032
- Table 4: Global Marine Vessel Industry Revenue Million Forecast, by Country 2019 & 2032
- Table 5: United States Marine Vessel Industry Revenue (Million) Forecast, by Application 2019 & 2032
- Table 6: Canada Marine Vessel Industry Revenue (Million) Forecast, by Application 2019 & 2032
- Table 7: Global Marine Vessel Industry Revenue Million Forecast, by Country 2019 & 2032
- Table 8: Germany Marine Vessel Industry Revenue (Million) Forecast, by Application 2019 & 2032
- Table 9: United Kingdom Marine Vessel Industry Revenue (Million) Forecast, by Application 2019 & 2032
- Table 10: France Marine Vessel Industry Revenue (Million) Forecast, by Application 2019 & 2032
- Table 11: Russia Marine Vessel Industry Revenue (Million) Forecast, by Application 2019 & 2032
- Table 12: Spain Marine Vessel Industry Revenue (Million) Forecast, by Application 2019 & 2032
- Table 13: Rest of Europe Marine Vessel Industry Revenue (Million) Forecast, by Application 2019 & 2032
- Table 14: Global Marine Vessel Industry Revenue Million Forecast, by Country 2019 & 2032
- Table 15: China Marine Vessel Industry Revenue (Million) Forecast, by Application 2019 & 2032
- Table 16: India Marine Vessel Industry Revenue (Million) Forecast, by Application 2019 & 2032
- Table 17: Japan Marine Vessel Industry Revenue (Million) Forecast, by Application 2019 & 2032
- Table 18: South Korea Marine Vessel Industry Revenue (Million) Forecast, by Application 2019 & 2032
- Table 19: Australia Marine Vessel Industry Revenue (Million) Forecast, by Application 2019 & 2032
- Table 20: Singapore Marine Vessel Industry Revenue (Million) Forecast, by Application 2019 & 2032
- Table 21: Rest of Asia Pacific Marine Vessel Industry Revenue (Million) Forecast, by Application 2019 & 2032
- Table 22: Global Marine Vessel Industry Revenue Million Forecast, by Country 2019 & 2032
- Table 23: Brazil Marine Vessel Industry Revenue (Million) Forecast, by Application 2019 & 2032
- Table 24: Mexico Marine Vessel Industry Revenue (Million) Forecast, by Application 2019 & 2032
- Table 25: Rest of Latin America Marine Vessel Industry Revenue (Million) Forecast, by Application 2019 & 2032
- Table 26: Global Marine Vessel Industry Revenue Million Forecast, by Country 2019 & 2032
- Table 27: United Arab Emirates Marine Vessel Industry Revenue (Million) Forecast, by Application 2019 & 2032
- Table 28: Saudi Arabia Marine Vessel Industry Revenue (Million) Forecast, by Application 2019 & 2032
- Table 29: South Africa Marine Vessel Industry Revenue (Million) Forecast, by Application 2019 & 2032
- Table 30: Rest of Middle East and Africa Marine Vessel Industry Revenue (Million) Forecast, by Application 2019 & 2032
- Table 31: Global Marine Vessel Industry Revenue Million Forecast, by Vessel Type 2019 & 2032
- Table 32: Global Marine Vessel Industry Revenue Million Forecast, by Country 2019 & 2032
- Table 33: United States Marine Vessel Industry Revenue (Million) Forecast, by Application 2019 & 2032
- Table 34: Canada Marine Vessel Industry Revenue (Million) Forecast, by Application 2019 & 2032
- Table 35: Global Marine Vessel Industry Revenue Million Forecast, by Vessel Type 2019 & 2032
- Table 36: Global Marine Vessel Industry Revenue Million Forecast, by Country 2019 & 2032
- Table 37: Germany Marine Vessel Industry Revenue (Million) Forecast, by Application 2019 & 2032
- Table 38: United Kingdom Marine Vessel Industry Revenue (Million) Forecast, by Application 2019 & 2032
- Table 39: France Marine Vessel Industry Revenue (Million) Forecast, by Application 2019 & 2032
- Table 40: Russia Marine Vessel Industry Revenue (Million) Forecast, by Application 2019 & 2032
- Table 41: Spain Marine Vessel Industry Revenue (Million) Forecast, by Application 2019 & 2032
- Table 42: Rest of Europe Marine Vessel Industry Revenue (Million) Forecast, by Application 2019 & 2032
- Table 43: Global Marine Vessel Industry Revenue Million Forecast, by Vessel Type 2019 & 2032
- Table 44: Global Marine Vessel Industry Revenue Million Forecast, by Country 2019 & 2032
- Table 45: China Marine Vessel Industry Revenue (Million) Forecast, by Application 2019 & 2032
- Table 46: India Marine Vessel Industry Revenue (Million) Forecast, by Application 2019 & 2032
- Table 47: Japan Marine Vessel Industry Revenue (Million) Forecast, by Application 2019 & 2032
- Table 48: South Korea Marine Vessel Industry Revenue (Million) Forecast, by Application 2019 & 2032
- Table 49: Australia Marine Vessel Industry Revenue (Million) Forecast, by Application 2019 & 2032
- Table 50: Singapore Marine Vessel Industry Revenue (Million) Forecast, by Application 2019 & 2032
- Table 51: Rest of Asia Pacific Marine Vessel Industry Revenue (Million) Forecast, by Application 2019 & 2032
- Table 52: Global Marine Vessel Industry Revenue Million Forecast, by Vessel Type 2019 & 2032
- Table 53: Global Marine Vessel Industry Revenue Million Forecast, by Country 2019 & 2032
- Table 54: Brazil Marine Vessel Industry Revenue (Million) Forecast, by Application 2019 & 2032
- Table 55: Mexico Marine Vessel Industry Revenue (Million) Forecast, by Application 2019 & 2032
- Table 56: Rest of Latin America Marine Vessel Industry Revenue (Million) Forecast, by Application 2019 & 2032
- Table 57: Global Marine Vessel Industry Revenue Million Forecast, by Vessel Type 2019 & 2032
- Table 58: Global Marine Vessel Industry Revenue Million Forecast, by Country 2019 & 2032
- Table 59: United Arab Emirates Marine Vessel Industry Revenue (Million) Forecast, by Application 2019 & 2032
- Table 60: Saudi Arabia Marine Vessel Industry Revenue (Million) Forecast, by Application 2019 & 2032
- Table 61: South Africa Marine Vessel Industry Revenue (Million) Forecast, by Application 2019 & 2032
- Table 62: Rest of Middle East and Africa Marine Vessel Industry Revenue (Million) Forecast, by Application 2019 & 2032
Frequently Asked Questions
1. What is the projected Compound Annual Growth Rate (CAGR) of the Marine Vessel Industry?
The projected CAGR is approximately 6.46%.
2. Which companies are prominent players in the Marine Vessel Industry?
Key companies in the market include Kalashnikov Group, ThyssenKrupp AG, General Dynamics Corporation, Lockheed Martin Corporation, China State Shipbuilding Corporation Limite, Fr Lurssen Werft Gmbh & Co KG, Naval Group SA, BAE Systems PLC, Austal Limited, Huntington Ingalls Industries Inc, EDGE Group PJSC, HD Korea Shipbuilding & Offshore Engineering Co Ltd, Navantia SA SME, Hanwha Ocean (Hanwha Group), FINCANTIERI SpA, Damen Shipyards Group, LARSEN & TOUBRO LIMITED6 3 Other Players, PT PAL Indonesia.
3. What are the main segments of the Marine Vessel Industry?
The market segments include Vessel Type.
4. Can you provide details about the market size?
The market size is estimated to be USD 109.39 Million as of 2022.
5. What are some drivers contributing to market growth?
N/A
6. What are the notable trends driving market growth?
Submarines Segment is Expected to Witness Significant Growth During the Forecast Period.
7. Are there any restraints impacting market growth?
N/A
8. Can you provide examples of recent developments in the market?
April 2023: The UK Ministry of Defence awarded a USD 57 million contract to BAE Systems plc to support communication, command, control, computer, and intelligence (C4I) services for surface vessels. According to the contract, BAE Systems will likely be able to help with C4I services and data deliverables throughout the five phases of shipboard integration.
9. What pricing options are available for accessing the report?
Pricing options include single-user, multi-user, and enterprise licenses priced at USD 4750, USD 5250, and USD 8750 respectively.
10. Is the market size provided in terms of value or volume?
The market size is provided in terms of value, measured in Million.
11. Are there any specific market keywords associated with the report?
Yes, the market keyword associated with the report is "Marine Vessel Industry," which aids in identifying and referencing the specific market segment covered.
12. How do I determine which pricing option suits my needs best?
The pricing options vary based on user requirements and access needs. Individual users may opt for single-user licenses, while businesses requiring broader access may choose multi-user or enterprise licenses for cost-effective access to the report.
13. Are there any additional resources or data provided in the Marine Vessel Industry report?
While the report offers comprehensive insights, it's advisable to review the specific contents or supplementary materials provided to ascertain if additional resources or data are available.
14. How can I stay updated on further developments or reports in the Marine Vessel Industry?
To stay informed about further developments, trends, and reports in the Marine Vessel Industry, consider subscribing to industry newsletters, following relevant companies and organizations, or regularly checking reputable industry news sources and publications.
Methodology
Step 1 - Identification of Relevant Samples Size from Population Database


Step 2 - Approaches for Defining Global Market Size (Value, Volume* & Price*)

Note*: In applicable scenarios
Step 3 - Data Sources
Primary Research
- Web Analytics
- Survey Reports
- Research Institute
- Latest Research Reports
- Opinion Leaders
Secondary Research
- Annual Reports
- White Paper
- Latest Press Release
- Industry Association
- Paid Database
- Investor Presentations

Step 4 - Data Triangulation
Involves using different sources of information in order to increase the validity of a study
These sources are likely to be stakeholders in a program - participants, other researchers, program staff, other community members, and so on.
Then we put all data in single framework & apply various statistical tools to find out the dynamic on the market.
During the analysis stage, feedback from the stakeholder groups would be compared to determine areas of agreement as well as areas of divergence
