

Key Insights
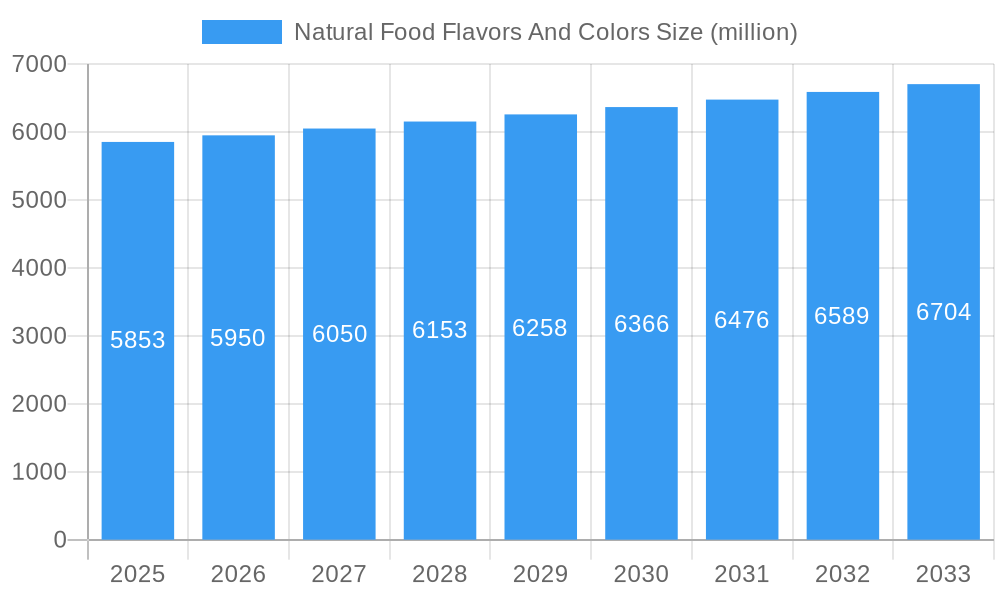
The global natural food flavors and colors market, valued at $5.853 billion in 2025, is projected to experience steady growth, driven by increasing consumer demand for clean-label products and a growing preference for natural ingredients over artificial counterparts. The market's Compound Annual Growth Rate (CAGR) of 1.7% from 2019 to 2024 indicates a consistent, albeit moderate, expansion. This growth is fueled by several key factors, including the rising popularity of functional foods and beverages, the expanding health and wellness sector, and the increasing awareness among consumers regarding the potential health risks associated with artificial additives. Major players like Givaudan, Symrise, and McCormick are leading the market, constantly innovating to meet evolving consumer preferences and providing diverse natural flavor and color solutions across various food categories. The market segmentation likely includes categories like fruit and vegetable extracts, spice extracts, and other natural sources, each experiencing varying growth rates based on consumer demand and product applications. The moderate CAGR suggests a mature market with established players, but the continued consumer focus on natural ingredients positions it for sustained growth in the coming years, driven by ongoing product diversification and innovation.
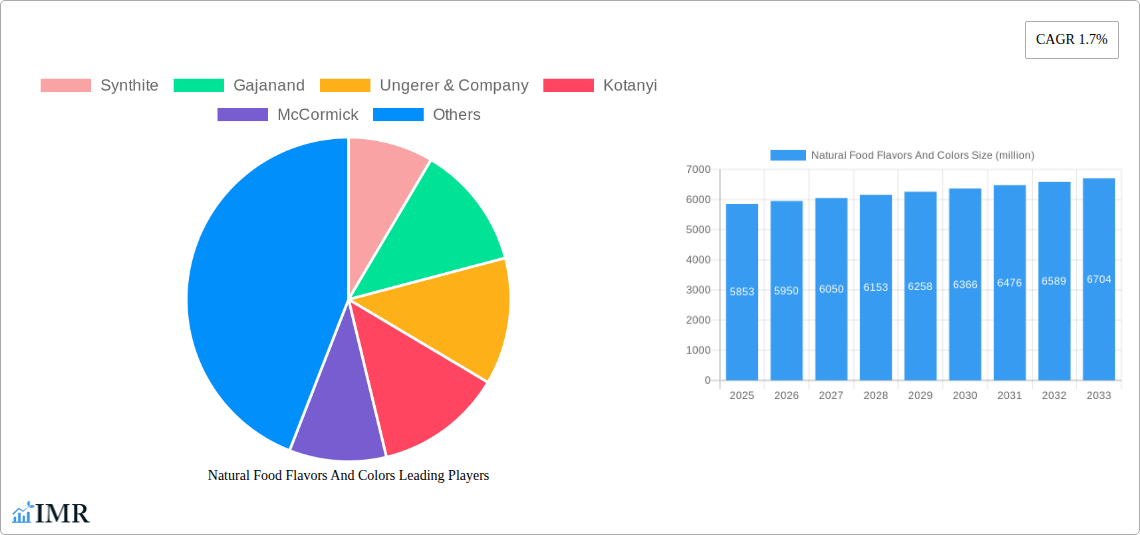
Natural Food Flavors And Colors Market Size (In Billion)
The projected forecast period (2025-2033) anticipates a continuation of this moderate growth trajectory, with the market expanding further on the foundation of its established consumer base and ongoing product innovation. Regional variations in growth are likely, with regions like North America and Europe, exhibiting strong demand due to established health-conscious consumer bases and stringent regulations surrounding food additives. However, emerging markets in Asia-Pacific are expected to show increasing growth potential as consumer awareness regarding natural ingredients increases and disposable incomes rise. Sustained investment in research and development by leading companies will be crucial to unlocking new flavor and color profiles derived from natural sources, thereby further enhancing market growth and meeting the expanding preferences of a health-conscious consumer base.
Natural Food Flavors And Colors Company Market Share
Natural Food Flavors And Colors Market Report: 2019-2033
This comprehensive report provides an in-depth analysis of the global Natural Food Flavors And Colors market, encompassing market dynamics, growth trends, regional landscapes, and key players. The study period covers 2019-2033, with a base year of 2025 and a forecast period of 2025-2033. The report leverages extensive primary and secondary research to offer invaluable insights for industry professionals, investors, and strategic decision-makers. The market is segmented by type (natural flavors, natural colors), application (beverages, food, confectionery, pharmaceuticals), and geography, providing a granular understanding of market dynamics across parent and child markets. The total market value in 2025 is estimated at xx million.
Natural Food Flavors And Colors Market Dynamics & Structure
The global Natural Food Flavors And Colors market is characterized by moderate concentration, with several multinational players commanding significant market share. Technological innovation, driven by consumer demand for clean-label products and health consciousness, is a primary growth driver. Stringent regulatory frameworks concerning food additives influence product development and market entry. Competitive pressure from synthetic alternatives necessitates continuous product differentiation and value-added service offerings. The market witnesses consistent mergers and acquisitions (M&A) activity, reflecting industry consolidation trends. The North American market holds a significant share, followed by Europe and Asia Pacific.
- Market Concentration: Moderately concentrated, with top 5 players holding approximately xx% market share in 2025.
- Technological Innovation: Focus on natural extraction methods, bio-based ingredients, and sustainable sourcing.
- Regulatory Landscape: Stringent regulations on labeling, purity, and safety standards impacting product development.
- Competitive Substitutes: Synthetic colors and flavors pose a significant competitive challenge.
- M&A Activity: xx deals recorded between 2019-2024, with a projected xx deals for 2025-2033.
- End-User Demographics: Growing health-conscious population driving demand for natural products.
Natural Food Flavors And Colors Growth Trends & Insights
The Natural Food Flavors And Colors market exhibits robust growth, driven by increasing consumer preference for natural and clean-label food products. The market size experienced significant growth during the historical period (2019-2024) and is projected to maintain a healthy Compound Annual Growth Rate (CAGR) of xx% during the forecast period (2025-2033). This growth is attributed to several factors, including rising disposable incomes, changing dietary habits, and increasing awareness of the health benefits of natural ingredients. Technological advancements, such as improved extraction techniques and novel ingredient discovery, further propel market expansion. The market penetration of natural food colors and flavors in various food and beverage categories has significantly increased, showcasing strong consumer acceptance.
Dominant Regions, Countries, or Segments in Natural Food Flavors And Colors
North America dominates the Natural Food Flavors And Colors market, driven by high consumer spending on premium food products, strong regulatory support for natural ingredients, and a well-established food processing industry. Europe follows closely, showcasing substantial demand from health-conscious consumers. The Asia-Pacific region shows strong growth potential fueled by rapid economic development and rising disposable incomes, increasing consumer awareness of food safety and health.
- North America: High consumer demand, strong regulatory framework, and well-established food processing industry.
- Europe: Significant demand from health-conscious consumers and stringent food safety regulations.
- Asia-Pacific: Rapid economic development, rising disposable incomes, and growing health awareness are driving market expansion.
- Market Share: North America holds approximately xx% market share in 2025.
Natural Food Flavors And Colors Product Landscape
The product landscape features a diverse range of natural flavors and colors derived from various sources, including fruits, vegetables, herbs, and spices. Innovations focus on enhancing taste, color stability, and cost-effectiveness. Unique selling propositions encompass clean-label certifications, sustainable sourcing, and customized flavor profiles. Technological advancements include improved extraction methods, resulting in higher purity and yield. The applications span various food and beverage segments, including beverages, confectionery, bakery, and dairy products.
Key Drivers, Barriers & Challenges in Natural Food Flavors And Colors
Key Drivers: Growing consumer demand for clean-label products, increasing health awareness, and stringent regulations against synthetic additives. Technological advancements in extraction and formulation also contribute. The rising popularity of functional foods and beverages is another key driver.
Key Challenges: High cost of production compared to synthetic alternatives, supply chain variability impacting raw material availability and price volatility, and stringent regulatory compliance requirements across different regions. Maintaining consistent color and flavor stability across different applications also poses a challenge.
Emerging Opportunities in Natural Food Flavors And Colors
Untapped markets in developing economies offer significant growth potential. The increasing demand for natural colors and flavors in health and wellness products, functional foods, and personalized nutrition further expands opportunities. Innovative applications, such as bio-based colorants and encapsulation technologies, also create opportunities for market expansion.
Growth Accelerators in the Natural Food Flavors And Colors Industry
Technological advancements in extraction and processing techniques, coupled with strategic partnerships between ingredient suppliers and food manufacturers, accelerate market growth. Focus on sustainable sourcing and eco-friendly production methods enhances brand appeal and attracts environmentally conscious consumers. Market expansion into new geographical regions and product diversification also contribute to growth acceleration.
Key Players Shaping the Natural Food Flavors And Colors Market
- Synthite
- Gajanand
- Ungerer & Company
- Kotanyi
- McCormick
- Givaudan
- DSM
- Dharampal Satyapal Group
- Fuchs
- TAKASAGO
- Haldin
- KIS
- Symrise
- Sensient
- Prova
- Akay Flavous and Aromatics
- San-Ei-Gen
- Nilon
- MDH Spices
- Mane SA
- AVT Natural
- Everest Spices
- WILD
- International Flavors&Fragrances
- ACH Food Companies
- Synergy Flavors
- Plant Lipids
- Wang Shouyi
- Anji Foodstuff
- Yongyi Food
- Zhejiang Zhengwei
- Huabao Group
- Guangxi Zhongyun
- Chenguang Biotech Group
- Chunfa Bio-Tech
Notable Milestones in Natural Food Flavors And Colors Sector
- 2020: Increased consumer focus on clean-label products boosts demand for natural ingredients.
- 2021: Several key players invest in research and development of sustainable sourcing practices.
- 2022: New regulations on food additives in several regions drive innovation in natural color and flavor technologies.
- 2023: Significant M&A activity consolidates the market landscape.
- 2024: Launch of several new products with enhanced functionalities and improved stability.
In-Depth Natural Food Flavors And Colors Market Outlook
The Natural Food Flavors And Colors market is poised for substantial growth, driven by consistent consumer demand for clean-label and healthy food options. The market is expected to benefit from continued technological advancements, strategic collaborations, and expansion into new geographical markets. Companies with a focus on sustainability and innovative product development will likely capture significant market share. The overall outlook suggests a positive trajectory, with considerable potential for sustained long-term growth.
Natural Food Flavors And Colors Segmentation
-
1. Application
- 1.1. Beverage
- 1.2. Sweet
- 1.3. Savory
- 1.4. Others
-
2. Type
- 2.1. Vegetable Flavor
- 2.2. Fruit Flavor
- 2.3. Spices
- 2.4. Natural Food Colors
- 2.5. Caramel Color
- 2.6. Lutein
- 2.7. Capsanthin
- 2.8. Others
Natural Food Flavors And Colors Segmentation By Geography
-
1. North America
- 1.1. United States
- 1.2. Canada
- 1.3. Mexico
-
2. South America
- 2.1. Brazil
- 2.2. Argentina
- 2.3. Rest of South America
-
3. Europe
- 3.1. United Kingdom
- 3.2. Germany
- 3.3. France
- 3.4. Italy
- 3.5. Spain
- 3.6. Russia
- 3.7. Benelux
- 3.8. Nordics
- 3.9. Rest of Europe
-
4. Middle East & Africa
- 4.1. Turkey
- 4.2. Israel
- 4.3. GCC
- 4.4. North Africa
- 4.5. South Africa
- 4.6. Rest of Middle East & Africa
-
5. Asia Pacific
- 5.1. China
- 5.2. India
- 5.3. Japan
- 5.4. South Korea
- 5.5. ASEAN
- 5.6. Oceania
- 5.7. Rest of Asia Pacific

Natural Food Flavors And Colors Regional Market Share
Geographic Coverage of Natural Food Flavors And Colors
Natural Food Flavors And Colors REPORT HIGHLIGHTS
| Aspects | Details |
|---|---|
| Study Period | 2020-2034 |
| Base Year | 2025 |
| Estimated Year | 2026 |
| Forecast Period | 2026-2034 |
| Historical Period | 2020-2025 |
| Growth Rate | CAGR of 1.7% from 2020-2034 |
| Segmentation |
|
Table of Contents
- 1. Introduction
- 1.1. Research Scope
- 1.2. Market Segmentation
- 1.3. Research Methodology
- 1.4. Definitions and Assumptions
- 2. Executive Summary
- 2.1. Introduction
- 3. Market Dynamics
- 3.1. Introduction
- 3.2. Market Drivers
- 3.3. Market Restrains
- 3.4. Market Trends
- 4. Market Factor Analysis
- 4.1. Porters Five Forces
- 4.2. Supply/Value Chain
- 4.3. PESTEL analysis
- 4.4. Market Entropy
- 4.5. Patent/Trademark Analysis
- 5. Global Natural Food Flavors And Colors Analysis, Insights and Forecast, 2020-2032
- 5.1. Market Analysis, Insights and Forecast - by Application
- 5.1.1. Beverage
- 5.1.2. Sweet
- 5.1.3. Savory
- 5.1.4. Others
- 5.2. Market Analysis, Insights and Forecast - by Type
- 5.2.1. Vegetable Flavor
- 5.2.2. Fruit Flavor
- 5.2.3. Spices
- 5.2.4. Natural Food Colors
- 5.2.5. Caramel Color
- 5.2.6. Lutein
- 5.2.7. Capsanthin
- 5.2.8. Others
- 5.3. Market Analysis, Insights and Forecast - by Region
- 5.3.1. North America
- 5.3.2. South America
- 5.3.3. Europe
- 5.3.4. Middle East & Africa
- 5.3.5. Asia Pacific
- 5.1. Market Analysis, Insights and Forecast - by Application
- 6. North America Natural Food Flavors And Colors Analysis, Insights and Forecast, 2020-2032
- 6.1. Market Analysis, Insights and Forecast - by Application
- 6.1.1. Beverage
- 6.1.2. Sweet
- 6.1.3. Savory
- 6.1.4. Others
- 6.2. Market Analysis, Insights and Forecast - by Type
- 6.2.1. Vegetable Flavor
- 6.2.2. Fruit Flavor
- 6.2.3. Spices
- 6.2.4. Natural Food Colors
- 6.2.5. Caramel Color
- 6.2.6. Lutein
- 6.2.7. Capsanthin
- 6.2.8. Others
- 6.1. Market Analysis, Insights and Forecast - by Application
- 7. South America Natural Food Flavors And Colors Analysis, Insights and Forecast, 2020-2032
- 7.1. Market Analysis, Insights and Forecast - by Application
- 7.1.1. Beverage
- 7.1.2. Sweet
- 7.1.3. Savory
- 7.1.4. Others
- 7.2. Market Analysis, Insights and Forecast - by Type
- 7.2.1. Vegetable Flavor
- 7.2.2. Fruit Flavor
- 7.2.3. Spices
- 7.2.4. Natural Food Colors
- 7.2.5. Caramel Color
- 7.2.6. Lutein
- 7.2.7. Capsanthin
- 7.2.8. Others
- 7.1. Market Analysis, Insights and Forecast - by Application
- 8. Europe Natural Food Flavors And Colors Analysis, Insights and Forecast, 2020-2032
- 8.1. Market Analysis, Insights and Forecast - by Application
- 8.1.1. Beverage
- 8.1.2. Sweet
- 8.1.3. Savory
- 8.1.4. Others
- 8.2. Market Analysis, Insights and Forecast - by Type
- 8.2.1. Vegetable Flavor
- 8.2.2. Fruit Flavor
- 8.2.3. Spices
- 8.2.4. Natural Food Colors
- 8.2.5. Caramel Color
- 8.2.6. Lutein
- 8.2.7. Capsanthin
- 8.2.8. Others
- 8.1. Market Analysis, Insights and Forecast - by Application
- 9. Middle East & Africa Natural Food Flavors And Colors Analysis, Insights and Forecast, 2020-2032
- 9.1. Market Analysis, Insights and Forecast - by Application
- 9.1.1. Beverage
- 9.1.2. Sweet
- 9.1.3. Savory
- 9.1.4. Others
- 9.2. Market Analysis, Insights and Forecast - by Type
- 9.2.1. Vegetable Flavor
- 9.2.2. Fruit Flavor
- 9.2.3. Spices
- 9.2.4. Natural Food Colors
- 9.2.5. Caramel Color
- 9.2.6. Lutein
- 9.2.7. Capsanthin
- 9.2.8. Others
- 9.1. Market Analysis, Insights and Forecast - by Application
- 10. Asia Pacific Natural Food Flavors And Colors Analysis, Insights and Forecast, 2020-2032
- 10.1. Market Analysis, Insights and Forecast - by Application
- 10.1.1. Beverage
- 10.1.2. Sweet
- 10.1.3. Savory
- 10.1.4. Others
- 10.2. Market Analysis, Insights and Forecast - by Type
- 10.2.1. Vegetable Flavor
- 10.2.2. Fruit Flavor
- 10.2.3. Spices
- 10.2.4. Natural Food Colors
- 10.2.5. Caramel Color
- 10.2.6. Lutein
- 10.2.7. Capsanthin
- 10.2.8. Others
- 10.1. Market Analysis, Insights and Forecast - by Application
- 11. Competitive Analysis
- 11.1. Global Market Share Analysis 2025
- 11.2. Company Profiles
- 11.2.1 Synthite
- 11.2.1.1. Overview
- 11.2.1.2. Products
- 11.2.1.3. SWOT Analysis
- 11.2.1.4. Recent Developments
- 11.2.1.5. Financials (Based on Availability)
- 11.2.2 Gajanand
- 11.2.2.1. Overview
- 11.2.2.2. Products
- 11.2.2.3. SWOT Analysis
- 11.2.2.4. Recent Developments
- 11.2.2.5. Financials (Based on Availability)
- 11.2.3 Ungerer & Company
- 11.2.3.1. Overview
- 11.2.3.2. Products
- 11.2.3.3. SWOT Analysis
- 11.2.3.4. Recent Developments
- 11.2.3.5. Financials (Based on Availability)
- 11.2.4 Kotanyi
- 11.2.4.1. Overview
- 11.2.4.2. Products
- 11.2.4.3. SWOT Analysis
- 11.2.4.4. Recent Developments
- 11.2.4.5. Financials (Based on Availability)
- 11.2.5 McCormick
- 11.2.5.1. Overview
- 11.2.5.2. Products
- 11.2.5.3. SWOT Analysis
- 11.2.5.4. Recent Developments
- 11.2.5.5. Financials (Based on Availability)
- 11.2.6 Givaudan
- 11.2.6.1. Overview
- 11.2.6.2. Products
- 11.2.6.3. SWOT Analysis
- 11.2.6.4. Recent Developments
- 11.2.6.5. Financials (Based on Availability)
- 11.2.7 DSM
- 11.2.7.1. Overview
- 11.2.7.2. Products
- 11.2.7.3. SWOT Analysis
- 11.2.7.4. Recent Developments
- 11.2.7.5. Financials (Based on Availability)
- 11.2.8 Dharampal Satyapal Group
- 11.2.8.1. Overview
- 11.2.8.2. Products
- 11.2.8.3. SWOT Analysis
- 11.2.8.4. Recent Developments
- 11.2.8.5. Financials (Based on Availability)
- 11.2.9 Fuchs
- 11.2.9.1. Overview
- 11.2.9.2. Products
- 11.2.9.3. SWOT Analysis
- 11.2.9.4. Recent Developments
- 11.2.9.5. Financials (Based on Availability)
- 11.2.10 TAKASAGO
- 11.2.10.1. Overview
- 11.2.10.2. Products
- 11.2.10.3. SWOT Analysis
- 11.2.10.4. Recent Developments
- 11.2.10.5. Financials (Based on Availability)
- 11.2.11 Haldin
- 11.2.11.1. Overview
- 11.2.11.2. Products
- 11.2.11.3. SWOT Analysis
- 11.2.11.4. Recent Developments
- 11.2.11.5. Financials (Based on Availability)
- 11.2.12 KIS
- 11.2.12.1. Overview
- 11.2.12.2. Products
- 11.2.12.3. SWOT Analysis
- 11.2.12.4. Recent Developments
- 11.2.12.5. Financials (Based on Availability)
- 11.2.13 Symrise
- 11.2.13.1. Overview
- 11.2.13.2. Products
- 11.2.13.3. SWOT Analysis
- 11.2.13.4. Recent Developments
- 11.2.13.5. Financials (Based on Availability)
- 11.2.14 Sensient
- 11.2.14.1. Overview
- 11.2.14.2. Products
- 11.2.14.3. SWOT Analysis
- 11.2.14.4. Recent Developments
- 11.2.14.5. Financials (Based on Availability)
- 11.2.15 Prova
- 11.2.15.1. Overview
- 11.2.15.2. Products
- 11.2.15.3. SWOT Analysis
- 11.2.15.4. Recent Developments
- 11.2.15.5. Financials (Based on Availability)
- 11.2.16 Akay Flavous and Aromatics
- 11.2.16.1. Overview
- 11.2.16.2. Products
- 11.2.16.3. SWOT Analysis
- 11.2.16.4. Recent Developments
- 11.2.16.5. Financials (Based on Availability)
- 11.2.17 San-Ei-Gen
- 11.2.17.1. Overview
- 11.2.17.2. Products
- 11.2.17.3. SWOT Analysis
- 11.2.17.4. Recent Developments
- 11.2.17.5. Financials (Based on Availability)
- 11.2.18 Nilon
- 11.2.18.1. Overview
- 11.2.18.2. Products
- 11.2.18.3. SWOT Analysis
- 11.2.18.4. Recent Developments
- 11.2.18.5. Financials (Based on Availability)
- 11.2.19 MDH Spices
- 11.2.19.1. Overview
- 11.2.19.2. Products
- 11.2.19.3. SWOT Analysis
- 11.2.19.4. Recent Developments
- 11.2.19.5. Financials (Based on Availability)
- 11.2.20 Mane SA
- 11.2.20.1. Overview
- 11.2.20.2. Products
- 11.2.20.3. SWOT Analysis
- 11.2.20.4. Recent Developments
- 11.2.20.5. Financials (Based on Availability)
- 11.2.21 AVT Natural
- 11.2.21.1. Overview
- 11.2.21.2. Products
- 11.2.21.3. SWOT Analysis
- 11.2.21.4. Recent Developments
- 11.2.21.5. Financials (Based on Availability)
- 11.2.22 Everest Spices
- 11.2.22.1. Overview
- 11.2.22.2. Products
- 11.2.22.3. SWOT Analysis
- 11.2.22.4. Recent Developments
- 11.2.22.5. Financials (Based on Availability)
- 11.2.23 WILD
- 11.2.23.1. Overview
- 11.2.23.2. Products
- 11.2.23.3. SWOT Analysis
- 11.2.23.4. Recent Developments
- 11.2.23.5. Financials (Based on Availability)
- 11.2.24 International Flavors&Fragrances
- 11.2.24.1. Overview
- 11.2.24.2. Products
- 11.2.24.3. SWOT Analysis
- 11.2.24.4. Recent Developments
- 11.2.24.5. Financials (Based on Availability)
- 11.2.25 ACH Food Companies
- 11.2.25.1. Overview
- 11.2.25.2. Products
- 11.2.25.3. SWOT Analysis
- 11.2.25.4. Recent Developments
- 11.2.25.5. Financials (Based on Availability)
- 11.2.26 Synergy Flavors
- 11.2.26.1. Overview
- 11.2.26.2. Products
- 11.2.26.3. SWOT Analysis
- 11.2.26.4. Recent Developments
- 11.2.26.5. Financials (Based on Availability)
- 11.2.27 Plant Lipids
- 11.2.27.1. Overview
- 11.2.27.2. Products
- 11.2.27.3. SWOT Analysis
- 11.2.27.4. Recent Developments
- 11.2.27.5. Financials (Based on Availability)
- 11.2.28 Wang Shouyi
- 11.2.28.1. Overview
- 11.2.28.2. Products
- 11.2.28.3. SWOT Analysis
- 11.2.28.4. Recent Developments
- 11.2.28.5. Financials (Based on Availability)
- 11.2.29 Anji Foodstuff
- 11.2.29.1. Overview
- 11.2.29.2. Products
- 11.2.29.3. SWOT Analysis
- 11.2.29.4. Recent Developments
- 11.2.29.5. Financials (Based on Availability)
- 11.2.30 Yongyi Food
- 11.2.30.1. Overview
- 11.2.30.2. Products
- 11.2.30.3. SWOT Analysis
- 11.2.30.4. Recent Developments
- 11.2.30.5. Financials (Based on Availability)
- 11.2.31 Zhejiang Zhengwei
- 11.2.31.1. Overview
- 11.2.31.2. Products
- 11.2.31.3. SWOT Analysis
- 11.2.31.4. Recent Developments
- 11.2.31.5. Financials (Based on Availability)
- 11.2.32 Huabao Group
- 11.2.32.1. Overview
- 11.2.32.2. Products
- 11.2.32.3. SWOT Analysis
- 11.2.32.4. Recent Developments
- 11.2.32.5. Financials (Based on Availability)
- 11.2.33 Guangxi Zhongyun
- 11.2.33.1. Overview
- 11.2.33.2. Products
- 11.2.33.3. SWOT Analysis
- 11.2.33.4. Recent Developments
- 11.2.33.5. Financials (Based on Availability)
- 11.2.34 Chenguang Biotech Group
- 11.2.34.1. Overview
- 11.2.34.2. Products
- 11.2.34.3. SWOT Analysis
- 11.2.34.4. Recent Developments
- 11.2.34.5. Financials (Based on Availability)
- 11.2.35 Chunfa Bio-Tech
- 11.2.35.1. Overview
- 11.2.35.2. Products
- 11.2.35.3. SWOT Analysis
- 11.2.35.4. Recent Developments
- 11.2.35.5. Financials (Based on Availability)
- 11.2.1 Synthite
List of Figures
- Figure 1: Global Natural Food Flavors And Colors Revenue Breakdown (million, %) by Region 2025 & 2033
- Figure 2: North America Natural Food Flavors And Colors Revenue (million), by Application 2025 & 2033
- Figure 3: North America Natural Food Flavors And Colors Revenue Share (%), by Application 2025 & 2033
- Figure 4: North America Natural Food Flavors And Colors Revenue (million), by Type 2025 & 2033
- Figure 5: North America Natural Food Flavors And Colors Revenue Share (%), by Type 2025 & 2033
- Figure 6: North America Natural Food Flavors And Colors Revenue (million), by Country 2025 & 2033
- Figure 7: North America Natural Food Flavors And Colors Revenue Share (%), by Country 2025 & 2033
- Figure 8: South America Natural Food Flavors And Colors Revenue (million), by Application 2025 & 2033
- Figure 9: South America Natural Food Flavors And Colors Revenue Share (%), by Application 2025 & 2033
- Figure 10: South America Natural Food Flavors And Colors Revenue (million), by Type 2025 & 2033
- Figure 11: South America Natural Food Flavors And Colors Revenue Share (%), by Type 2025 & 2033
- Figure 12: South America Natural Food Flavors And Colors Revenue (million), by Country 2025 & 2033
- Figure 13: South America Natural Food Flavors And Colors Revenue Share (%), by Country 2025 & 2033
- Figure 14: Europe Natural Food Flavors And Colors Revenue (million), by Application 2025 & 2033
- Figure 15: Europe Natural Food Flavors And Colors Revenue Share (%), by Application 2025 & 2033
- Figure 16: Europe Natural Food Flavors And Colors Revenue (million), by Type 2025 & 2033
- Figure 17: Europe Natural Food Flavors And Colors Revenue Share (%), by Type 2025 & 2033
- Figure 18: Europe Natural Food Flavors And Colors Revenue (million), by Country 2025 & 2033
- Figure 19: Europe Natural Food Flavors And Colors Revenue Share (%), by Country 2025 & 2033
- Figure 20: Middle East & Africa Natural Food Flavors And Colors Revenue (million), by Application 2025 & 2033
- Figure 21: Middle East & Africa Natural Food Flavors And Colors Revenue Share (%), by Application 2025 & 2033
- Figure 22: Middle East & Africa Natural Food Flavors And Colors Revenue (million), by Type 2025 & 2033
- Figure 23: Middle East & Africa Natural Food Flavors And Colors Revenue Share (%), by Type 2025 & 2033
- Figure 24: Middle East & Africa Natural Food Flavors And Colors Revenue (million), by Country 2025 & 2033
- Figure 25: Middle East & Africa Natural Food Flavors And Colors Revenue Share (%), by Country 2025 & 2033
- Figure 26: Asia Pacific Natural Food Flavors And Colors Revenue (million), by Application 2025 & 2033
- Figure 27: Asia Pacific Natural Food Flavors And Colors Revenue Share (%), by Application 2025 & 2033
- Figure 28: Asia Pacific Natural Food Flavors And Colors Revenue (million), by Type 2025 & 2033
- Figure 29: Asia Pacific Natural Food Flavors And Colors Revenue Share (%), by Type 2025 & 2033
- Figure 30: Asia Pacific Natural Food Flavors And Colors Revenue (million), by Country 2025 & 2033
- Figure 31: Asia Pacific Natural Food Flavors And Colors Revenue Share (%), by Country 2025 & 2033
List of Tables
- Table 1: Global Natural Food Flavors And Colors Revenue million Forecast, by Application 2020 & 2033
- Table 2: Global Natural Food Flavors And Colors Revenue million Forecast, by Type 2020 & 2033
- Table 3: Global Natural Food Flavors And Colors Revenue million Forecast, by Region 2020 & 2033
- Table 4: Global Natural Food Flavors And Colors Revenue million Forecast, by Application 2020 & 2033
- Table 5: Global Natural Food Flavors And Colors Revenue million Forecast, by Type 2020 & 2033
- Table 6: Global Natural Food Flavors And Colors Revenue million Forecast, by Country 2020 & 2033
- Table 7: United States Natural Food Flavors And Colors Revenue (million) Forecast, by Application 2020 & 2033
- Table 8: Canada Natural Food Flavors And Colors Revenue (million) Forecast, by Application 2020 & 2033
- Table 9: Mexico Natural Food Flavors And Colors Revenue (million) Forecast, by Application 2020 & 2033
- Table 10: Global Natural Food Flavors And Colors Revenue million Forecast, by Application 2020 & 2033
- Table 11: Global Natural Food Flavors And Colors Revenue million Forecast, by Type 2020 & 2033
- Table 12: Global Natural Food Flavors And Colors Revenue million Forecast, by Country 2020 & 2033
- Table 13: Brazil Natural Food Flavors And Colors Revenue (million) Forecast, by Application 2020 & 2033
- Table 14: Argentina Natural Food Flavors And Colors Revenue (million) Forecast, by Application 2020 & 2033
- Table 15: Rest of South America Natural Food Flavors And Colors Revenue (million) Forecast, by Application 2020 & 2033
- Table 16: Global Natural Food Flavors And Colors Revenue million Forecast, by Application 2020 & 2033
- Table 17: Global Natural Food Flavors And Colors Revenue million Forecast, by Type 2020 & 2033
- Table 18: Global Natural Food Flavors And Colors Revenue million Forecast, by Country 2020 & 2033
- Table 19: United Kingdom Natural Food Flavors And Colors Revenue (million) Forecast, by Application 2020 & 2033
- Table 20: Germany Natural Food Flavors And Colors Revenue (million) Forecast, by Application 2020 & 2033
- Table 21: France Natural Food Flavors And Colors Revenue (million) Forecast, by Application 2020 & 2033
- Table 22: Italy Natural Food Flavors And Colors Revenue (million) Forecast, by Application 2020 & 2033
- Table 23: Spain Natural Food Flavors And Colors Revenue (million) Forecast, by Application 2020 & 2033
- Table 24: Russia Natural Food Flavors And Colors Revenue (million) Forecast, by Application 2020 & 2033
- Table 25: Benelux Natural Food Flavors And Colors Revenue (million) Forecast, by Application 2020 & 2033
- Table 26: Nordics Natural Food Flavors And Colors Revenue (million) Forecast, by Application 2020 & 2033
- Table 27: Rest of Europe Natural Food Flavors And Colors Revenue (million) Forecast, by Application 2020 & 2033
- Table 28: Global Natural Food Flavors And Colors Revenue million Forecast, by Application 2020 & 2033
- Table 29: Global Natural Food Flavors And Colors Revenue million Forecast, by Type 2020 & 2033
- Table 30: Global Natural Food Flavors And Colors Revenue million Forecast, by Country 2020 & 2033
- Table 31: Turkey Natural Food Flavors And Colors Revenue (million) Forecast, by Application 2020 & 2033
- Table 32: Israel Natural Food Flavors And Colors Revenue (million) Forecast, by Application 2020 & 2033
- Table 33: GCC Natural Food Flavors And Colors Revenue (million) Forecast, by Application 2020 & 2033
- Table 34: North Africa Natural Food Flavors And Colors Revenue (million) Forecast, by Application 2020 & 2033
- Table 35: South Africa Natural Food Flavors And Colors Revenue (million) Forecast, by Application 2020 & 2033
- Table 36: Rest of Middle East & Africa Natural Food Flavors And Colors Revenue (million) Forecast, by Application 2020 & 2033
- Table 37: Global Natural Food Flavors And Colors Revenue million Forecast, by Application 2020 & 2033
- Table 38: Global Natural Food Flavors And Colors Revenue million Forecast, by Type 2020 & 2033
- Table 39: Global Natural Food Flavors And Colors Revenue million Forecast, by Country 2020 & 2033
- Table 40: China Natural Food Flavors And Colors Revenue (million) Forecast, by Application 2020 & 2033
- Table 41: India Natural Food Flavors And Colors Revenue (million) Forecast, by Application 2020 & 2033
- Table 42: Japan Natural Food Flavors And Colors Revenue (million) Forecast, by Application 2020 & 2033
- Table 43: South Korea Natural Food Flavors And Colors Revenue (million) Forecast, by Application 2020 & 2033
- Table 44: ASEAN Natural Food Flavors And Colors Revenue (million) Forecast, by Application 2020 & 2033
- Table 45: Oceania Natural Food Flavors And Colors Revenue (million) Forecast, by Application 2020 & 2033
- Table 46: Rest of Asia Pacific Natural Food Flavors And Colors Revenue (million) Forecast, by Application 2020 & 2033
Frequently Asked Questions
1. What is the projected Compound Annual Growth Rate (CAGR) of the Natural Food Flavors And Colors?
The projected CAGR is approximately 1.7%.
2. Which companies are prominent players in the Natural Food Flavors And Colors?
Key companies in the market include Synthite, Gajanand, Ungerer & Company, Kotanyi, McCormick, Givaudan, DSM, Dharampal Satyapal Group, Fuchs, TAKASAGO, Haldin, KIS, Symrise, Sensient, Prova, Akay Flavous and Aromatics, San-Ei-Gen, Nilon, MDH Spices, Mane SA, AVT Natural, Everest Spices, WILD, International Flavors&Fragrances, ACH Food Companies, Synergy Flavors, Plant Lipids, Wang Shouyi, Anji Foodstuff, Yongyi Food, Zhejiang Zhengwei, Huabao Group, Guangxi Zhongyun, Chenguang Biotech Group, Chunfa Bio-Tech.
3. What are the main segments of the Natural Food Flavors And Colors?
The market segments include Application, Type.
4. Can you provide details about the market size?
The market size is estimated to be USD 5853 million as of 2022.
5. What are some drivers contributing to market growth?
N/A
6. What are the notable trends driving market growth?
N/A
7. Are there any restraints impacting market growth?
N/A
8. Can you provide examples of recent developments in the market?
N/A
9. What pricing options are available for accessing the report?
Pricing options include single-user, multi-user, and enterprise licenses priced at USD 5900.00, USD 8850.00, and USD 11800.00 respectively.
10. Is the market size provided in terms of value or volume?
The market size is provided in terms of value, measured in million.
11. Are there any specific market keywords associated with the report?
Yes, the market keyword associated with the report is "Natural Food Flavors And Colors," which aids in identifying and referencing the specific market segment covered.
12. How do I determine which pricing option suits my needs best?
The pricing options vary based on user requirements and access needs. Individual users may opt for single-user licenses, while businesses requiring broader access may choose multi-user or enterprise licenses for cost-effective access to the report.
13. Are there any additional resources or data provided in the Natural Food Flavors And Colors report?
While the report offers comprehensive insights, it's advisable to review the specific contents or supplementary materials provided to ascertain if additional resources or data are available.
14. How can I stay updated on further developments or reports in the Natural Food Flavors And Colors?
To stay informed about further developments, trends, and reports in the Natural Food Flavors And Colors, consider subscribing to industry newsletters, following relevant companies and organizations, or regularly checking reputable industry news sources and publications.
Methodology
Step 1 - Identification of Relevant Samples Size from Population Database


Step 2 - Approaches for Defining Global Market Size (Value, Volume* & Price*)

Note*: In applicable scenarios
Step 3 - Data Sources
Primary Research
- Web Analytics
- Survey Reports
- Research Institute
- Latest Research Reports
- Opinion Leaders
Secondary Research
- Annual Reports
- White Paper
- Latest Press Release
- Industry Association
- Paid Database
- Investor Presentations

Step 4 - Data Triangulation
Involves using different sources of information in order to increase the validity of a study
These sources are likely to be stakeholders in a program - participants, other researchers, program staff, other community members, and so on.
Then we put all data in single framework & apply various statistical tools to find out the dynamic on the market.
During the analysis stage, feedback from the stakeholder groups would be compared to determine areas of agreement as well as areas of divergence