

Key Insights
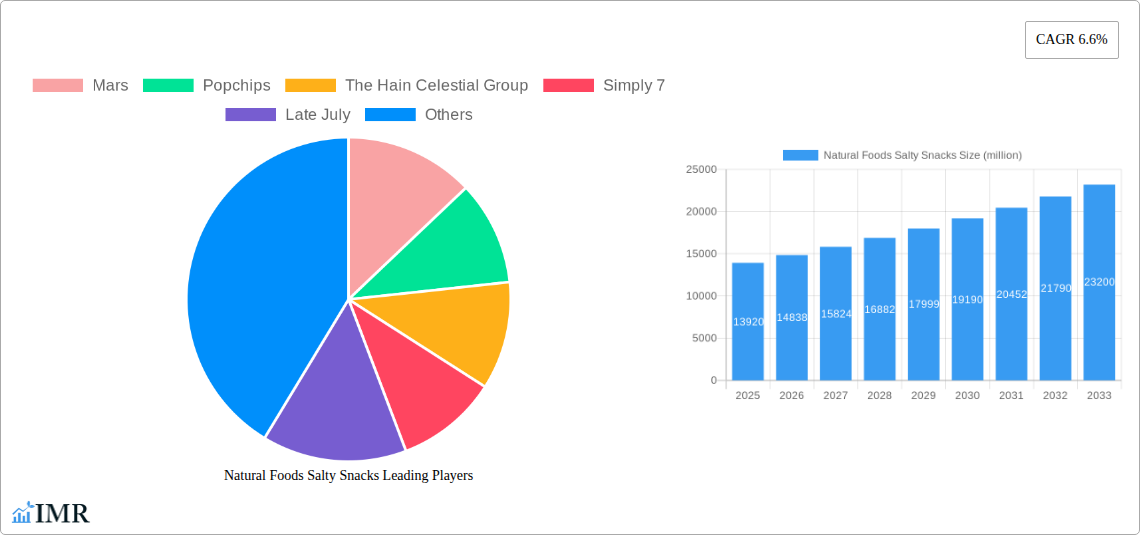
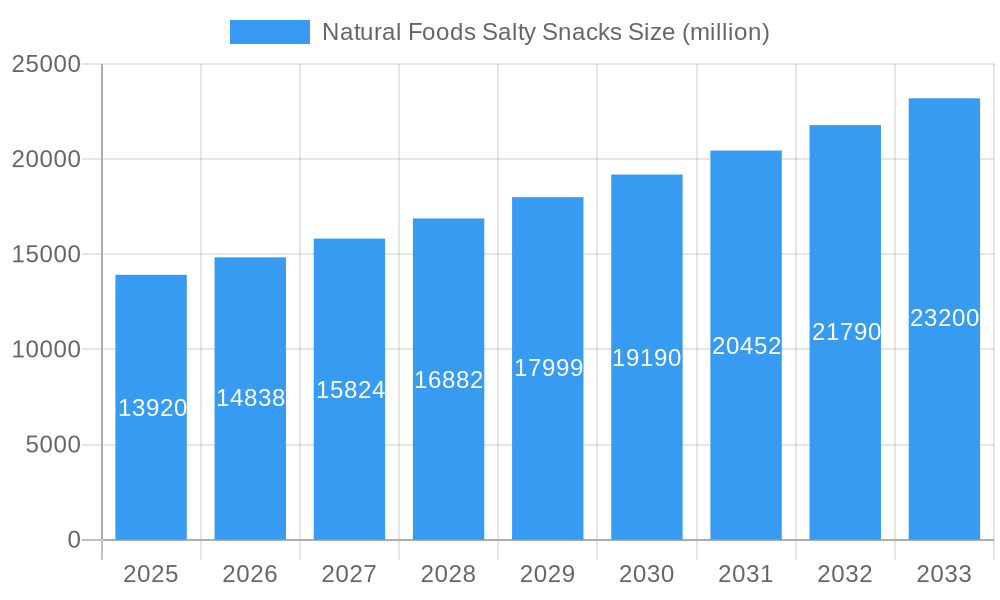
The natural foods salty snacks market, currently valued at approximately $13.92 billion in 2025, is experiencing robust growth, projected to expand at a Compound Annual Growth Rate (CAGR) of 6.6% from 2025 to 2033. This expansion is fueled by several key drivers. A rising consumer preference for healthier snack options, driven by increasing health consciousness and awareness of the negative impacts of processed foods, is a primary catalyst. The growing demand for clean-label products, featuring recognizable and natural ingredients, further supports this trend. The increasing popularity of plant-based diets and the rising prevalence of food allergies are also contributing to the market's growth, as consumers actively seek snacks that align with their dietary needs and restrictions. Innovation in product offerings, encompassing diverse flavors, textures, and convenient packaging formats, also plays a crucial role in attracting and retaining consumers. Key players like Mars, Mondelez, PepsiCo, and Kellogg's are strategically investing in research and development to introduce novel products and expand their market share within this competitive landscape.
Natural Foods Salty Snacks Market Size (In Billion)
However, the market also faces some challenges. Fluctuations in raw material prices, particularly for key ingredients like nuts, seeds, and grains, can impact profitability. Furthermore, intense competition among established brands and emerging players necessitates continuous innovation and marketing efforts to maintain market position. Maintaining consistent product quality and ensuring supply chain stability are also crucial for sustained growth. Despite these restraints, the long-term outlook for the natural foods salty snacks market remains positive, with considerable growth potential driven by evolving consumer preferences and the ongoing focus on healthier eating habits. The market is expected to witness increased consolidation, strategic partnerships, and acquisitions as larger players seek to expand their presence within this attractive segment.
Natural Foods Salty Snacks Company Market Share
Natural Foods Salty Snacks Market Report: 2019-2033
This comprehensive report provides a detailed analysis of the natural foods salty snacks market, encompassing market dynamics, growth trends, regional dominance, product landscape, key players, and future outlook. The study period spans from 2019 to 2033, with 2025 serving as the base and estimated year. The forecast period covers 2025-2033, and the historical period encompasses 2019-2024. This report is crucial for industry professionals seeking to understand and capitalize on the burgeoning opportunities within this dynamic market segment. The parent market is the broader salty snacks market, while the child market is specifically natural and organic salty snacks.
Natural Foods Salty Snacks Market Dynamics & Structure
The natural foods salty snacks market is characterized by increasing consumer demand for healthier alternatives to traditional snacks. Market concentration is moderate, with a few large players alongside numerous smaller, niche brands. Technological innovation, particularly in ingredient sourcing and processing, plays a significant role. Stringent regulatory frameworks concerning labeling and ingredient sourcing influence market dynamics. Competitive substitutes include conventional salty snacks and other healthy snack options. End-user demographics skew towards health-conscious consumers, including millennials and Gen Z. M&A activity has been moderate, with larger companies acquiring smaller, innovative brands to expand their portfolios.
- Market Concentration: Moderately concentrated, with top 5 players holding approximately xx% market share in 2025.
- Technological Innovation: Focus on clean-label ingredients, sustainable sourcing, and innovative processing techniques.
- Regulatory Frameworks: Stringent regulations regarding labeling, allergen information, and ingredient sourcing.
- Competitive Substitutes: Conventional salty snacks, fruits, vegetables, and other healthy snacks.
- End-User Demographics: Health-conscious consumers, millennials, and Gen Z.
- M&A Trends: Moderate activity, driven by larger companies seeking to expand their natural food offerings. xx M&A deals were recorded between 2019-2024.
Natural Foods Salty Snacks Growth Trends & Insights
The natural foods salty snacks market experienced significant growth during the historical period (2019-2024), driven by rising health consciousness and increased disposable incomes. This trend is expected to continue throughout the forecast period (2025-2033), albeit at a slightly moderated pace. Market size is projected to reach xx million units by 2033, exhibiting a CAGR of xx% during the forecast period. Technological disruptions, such as the introduction of novel processing methods and ingredient alternatives, are accelerating market growth. Consumer behavior shifts toward healthier, cleaner, and more ethically sourced snacks further fuel market expansion. Market penetration for natural salty snacks is expected to reach xx% by 2033.
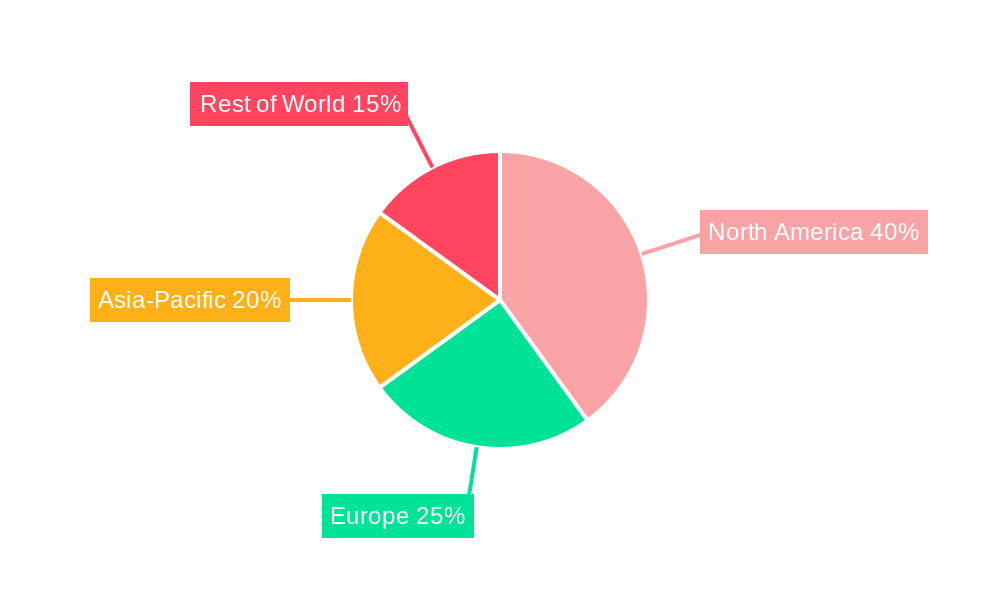
Dominant Regions, Countries, or Segments in Natural Foods Salty Snacks
North America currently dominates the natural foods salty snacks market, followed by Europe. Strong consumer demand for health-conscious products and well-established distribution networks in these regions contribute to their market leadership. However, Asia-Pacific is showing significant growth potential due to increasing disposable incomes and rising awareness of health and wellness.
- North America: Strong consumer demand, established distribution networks.
- Europe: High health consciousness, stringent regulatory environment.
- Asia-Pacific: Rapidly growing market, increasing disposable incomes.
- Key Drivers: Increased health consciousness, rising disposable incomes, and government initiatives promoting healthy eating habits.
Natural Foods Salty Snacks Product Landscape
The natural foods salty snacks market offers a diverse range of products, including baked chips, popped chips, extruded snacks, and roasted nuts. Product innovations focus on clean-label ingredients, organic certification, and unique flavor profiles. Many brands emphasize their commitment to sustainability and ethical sourcing, leading to higher perceived value. Key performance metrics include shelf life, flavor profile, texture, and nutritional content.
Key Drivers, Barriers & Challenges in Natural Foods Salty Snacks
Key Drivers:
- Growing health consciousness amongst consumers.
- Increasing demand for convenient and healthy snack options.
- Rise of veganism and plant-based diets.
- Growing availability of organic and non-GMO ingredients.
Key Challenges:
- Higher production costs compared to conventional snacks.
- Maintaining consistent product quality due to natural ingredient variability.
- Intense competition from established players and smaller niche brands.
- Ensuring sustainable and ethical sourcing practices. xx% of companies reported supply chain disruptions in 2024.
Emerging Opportunities in Natural Foods Salty Snacks
Emerging opportunities include expanding into untapped markets (such as developing countries), introducing innovative product formats (such as functional snacks with added health benefits), and catering to specific dietary restrictions (such as gluten-free or keto-friendly options). Further innovation in packaging (sustainable and shelf-life enhancing) presents another significant avenue for growth.
Growth Accelerators in the Natural Foods Salty Snacks Industry
Strategic partnerships between established food companies and smaller, innovative natural food brands are driving market growth. This enables the larger players to expand their product portfolios and reach a wider consumer base, while simultaneously offering the smaller brands crucial resources and market access. Technological advancements in ingredient processing and packaging are also accelerating market expansion.
Key Players Shaping the Natural Foods Salty Snacks Market
- Mars
- Popchips
- The Hain Celestial Group
- Simply 7
- Late July
- Siete Family Foods
- Mondelez
- Blue Diamond
- The Wonderful Company
- Brami
- Yumi's
- Propercorn
- Inka Crops
- Campbell Soup Company
- PepsiCo
- Kellogg's
- General Mills
- Calbee
- The Kraft Heinz Company
- Hormel Foods
Notable Milestones in Natural Foods Salty Snacks Sector
- 2020: Increased demand for healthier snacks during the COVID-19 pandemic.
- 2021: Launch of several new plant-based salty snack products.
- 2022: Several major mergers and acquisitions in the industry.
- 2023: Growing focus on sustainable packaging and sourcing.
- 2024: Increased regulatory scrutiny on ingredient labeling and claims.
In-Depth Natural Foods Salty Snacks Market Outlook
The future of the natural foods salty snacks market is bright, with continued growth fueled by consumer demand for healthier and more sustainable products. Strategic partnerships, technological innovation, and expansion into new markets will be crucial for success. Opportunities exist in developing innovative products and tapping into emerging consumer trends. The market is poised for further consolidation, with larger players acquiring smaller brands to expand their reach and product offerings. The market is projected to experience significant growth, reaching xx million units by 2033, showcasing a robust and promising outlook for companies operating in this sector.
Natural Foods Salty Snacks Segmentation
-
1. Application
- 1.1. Online Sales
- 1.2. Offline Sales
-
2. Type
- 2.1. Nuts
- 2.2. Grains
- 2.3. Vegetables
- 2.4. Others
Natural Foods Salty Snacks Segmentation By Geography
-
1. North America
- 1.1. United States
- 1.2. Canada
- 1.3. Mexico
-
2. South America
- 2.1. Brazil
- 2.2. Argentina
- 2.3. Rest of South America
-
3. Europe
- 3.1. United Kingdom
- 3.2. Germany
- 3.3. France
- 3.4. Italy
- 3.5. Spain
- 3.6. Russia
- 3.7. Benelux
- 3.8. Nordics
- 3.9. Rest of Europe
-
4. Middle East & Africa
- 4.1. Turkey
- 4.2. Israel
- 4.3. GCC
- 4.4. North Africa
- 4.5. South Africa
- 4.6. Rest of Middle East & Africa
-
5. Asia Pacific
- 5.1. China
- 5.2. India
- 5.3. Japan
- 5.4. South Korea
- 5.5. ASEAN
- 5.6. Oceania
- 5.7. Rest of Asia Pacific
Natural Foods Salty Snacks Regional Market Share
Geographic Coverage of Natural Foods Salty Snacks
Natural Foods Salty Snacks REPORT HIGHLIGHTS
| Aspects | Details |
|---|---|
| Study Period | 2020-2034 |
| Base Year | 2025 |
| Estimated Year | 2026 |
| Forecast Period | 2026-2034 |
| Historical Period | 2020-2025 |
| Growth Rate | CAGR of 6.6% from 2020-2034 |
| Segmentation |
|
Table of Contents
- 1. Introduction
- 1.1. Research Scope
- 1.2. Market Segmentation
- 1.3. Research Methodology
- 1.4. Definitions and Assumptions
- 2. Executive Summary
- 2.1. Introduction
- 3. Market Dynamics
- 3.1. Introduction
- 3.2. Market Drivers
- 3.3. Market Restrains
- 3.4. Market Trends
- 4. Market Factor Analysis
- 4.1. Porters Five Forces
- 4.2. Supply/Value Chain
- 4.3. PESTEL analysis
- 4.4. Market Entropy
- 4.5. Patent/Trademark Analysis
- 5. Global Natural Foods Salty Snacks Analysis, Insights and Forecast, 2020-2032
- 5.1. Market Analysis, Insights and Forecast - by Application
- 5.1.1. Online Sales
- 5.1.2. Offline Sales
- 5.2. Market Analysis, Insights and Forecast - by Type
- 5.2.1. Nuts
- 5.2.2. Grains
- 5.2.3. Vegetables
- 5.2.4. Others
- 5.3. Market Analysis, Insights and Forecast - by Region
- 5.3.1. North America
- 5.3.2. South America
- 5.3.3. Europe
- 5.3.4. Middle East & Africa
- 5.3.5. Asia Pacific
- 5.1. Market Analysis, Insights and Forecast - by Application
- 6. North America Natural Foods Salty Snacks Analysis, Insights and Forecast, 2020-2032
- 6.1. Market Analysis, Insights and Forecast - by Application
- 6.1.1. Online Sales
- 6.1.2. Offline Sales
- 6.2. Market Analysis, Insights and Forecast - by Type
- 6.2.1. Nuts
- 6.2.2. Grains
- 6.2.3. Vegetables
- 6.2.4. Others
- 6.1. Market Analysis, Insights and Forecast - by Application
- 7. South America Natural Foods Salty Snacks Analysis, Insights and Forecast, 2020-2032
- 7.1. Market Analysis, Insights and Forecast - by Application
- 7.1.1. Online Sales
- 7.1.2. Offline Sales
- 7.2. Market Analysis, Insights and Forecast - by Type
- 7.2.1. Nuts
- 7.2.2. Grains
- 7.2.3. Vegetables
- 7.2.4. Others
- 7.1. Market Analysis, Insights and Forecast - by Application
- 8. Europe Natural Foods Salty Snacks Analysis, Insights and Forecast, 2020-2032
- 8.1. Market Analysis, Insights and Forecast - by Application
- 8.1.1. Online Sales
- 8.1.2. Offline Sales
- 8.2. Market Analysis, Insights and Forecast - by Type
- 8.2.1. Nuts
- 8.2.2. Grains
- 8.2.3. Vegetables
- 8.2.4. Others
- 8.1. Market Analysis, Insights and Forecast - by Application
- 9. Middle East & Africa Natural Foods Salty Snacks Analysis, Insights and Forecast, 2020-2032
- 9.1. Market Analysis, Insights and Forecast - by Application
- 9.1.1. Online Sales
- 9.1.2. Offline Sales
- 9.2. Market Analysis, Insights and Forecast - by Type
- 9.2.1. Nuts
- 9.2.2. Grains
- 9.2.3. Vegetables
- 9.2.4. Others
- 9.1. Market Analysis, Insights and Forecast - by Application
- 10. Asia Pacific Natural Foods Salty Snacks Analysis, Insights and Forecast, 2020-2032
- 10.1. Market Analysis, Insights and Forecast - by Application
- 10.1.1. Online Sales
- 10.1.2. Offline Sales
- 10.2. Market Analysis, Insights and Forecast - by Type
- 10.2.1. Nuts
- 10.2.2. Grains
- 10.2.3. Vegetables
- 10.2.4. Others
- 10.1. Market Analysis, Insights and Forecast - by Application
- 11. Competitive Analysis
- 11.1. Global Market Share Analysis 2025
- 11.2. Company Profiles
- 11.2.1 Mars
- 11.2.1.1. Overview
- 11.2.1.2. Products
- 11.2.1.3. SWOT Analysis
- 11.2.1.4. Recent Developments
- 11.2.1.5. Financials (Based on Availability)
- 11.2.2 Popchips
- 11.2.2.1. Overview
- 11.2.2.2. Products
- 11.2.2.3. SWOT Analysis
- 11.2.2.4. Recent Developments
- 11.2.2.5. Financials (Based on Availability)
- 11.2.3 The Hain Celestial Group
- 11.2.3.1. Overview
- 11.2.3.2. Products
- 11.2.3.3. SWOT Analysis
- 11.2.3.4. Recent Developments
- 11.2.3.5. Financials (Based on Availability)
- 11.2.4 Simply 7
- 11.2.4.1. Overview
- 11.2.4.2. Products
- 11.2.4.3. SWOT Analysis
- 11.2.4.4. Recent Developments
- 11.2.4.5. Financials (Based on Availability)
- 11.2.5 Late July
- 11.2.5.1. Overview
- 11.2.5.2. Products
- 11.2.5.3. SWOT Analysis
- 11.2.5.4. Recent Developments
- 11.2.5.5. Financials (Based on Availability)
- 11.2.6 Siete Family Foods
- 11.2.6.1. Overview
- 11.2.6.2. Products
- 11.2.6.3. SWOT Analysis
- 11.2.6.4. Recent Developments
- 11.2.6.5. Financials (Based on Availability)
- 11.2.7 Mondelez
- 11.2.7.1. Overview
- 11.2.7.2. Products
- 11.2.7.3. SWOT Analysis
- 11.2.7.4. Recent Developments
- 11.2.7.5. Financials (Based on Availability)
- 11.2.8 Blue Diamond
- 11.2.8.1. Overview
- 11.2.8.2. Products
- 11.2.8.3. SWOT Analysis
- 11.2.8.4. Recent Developments
- 11.2.8.5. Financials (Based on Availability)
- 11.2.9 The Wonderful Company
- 11.2.9.1. Overview
- 11.2.9.2. Products
- 11.2.9.3. SWOT Analysis
- 11.2.9.4. Recent Developments
- 11.2.9.5. Financials (Based on Availability)
- 11.2.10 Brami
- 11.2.10.1. Overview
- 11.2.10.2. Products
- 11.2.10.3. SWOT Analysis
- 11.2.10.4. Recent Developments
- 11.2.10.5. Financials (Based on Availability)
- 11.2.11 Yumi's
- 11.2.11.1. Overview
- 11.2.11.2. Products
- 11.2.11.3. SWOT Analysis
- 11.2.11.4. Recent Developments
- 11.2.11.5. Financials (Based on Availability)
- 11.2.12 Propercorn
- 11.2.12.1. Overview
- 11.2.12.2. Products
- 11.2.12.3. SWOT Analysis
- 11.2.12.4. Recent Developments
- 11.2.12.5. Financials (Based on Availability)
- 11.2.13 Inka Crops
- 11.2.13.1. Overview
- 11.2.13.2. Products
- 11.2.13.3. SWOT Analysis
- 11.2.13.4. Recent Developments
- 11.2.13.5. Financials (Based on Availability)
- 11.2.14 Campbell Soup Company
- 11.2.14.1. Overview
- 11.2.14.2. Products
- 11.2.14.3. SWOT Analysis
- 11.2.14.4. Recent Developments
- 11.2.14.5. Financials (Based on Availability)
- 11.2.15 PepsiCo
- 11.2.15.1. Overview
- 11.2.15.2. Products
- 11.2.15.3. SWOT Analysis
- 11.2.15.4. Recent Developments
- 11.2.15.5. Financials (Based on Availability)
- 11.2.16 Kellogg's
- 11.2.16.1. Overview
- 11.2.16.2. Products
- 11.2.16.3. SWOT Analysis
- 11.2.16.4. Recent Developments
- 11.2.16.5. Financials (Based on Availability)
- 11.2.17 General Mills
- 11.2.17.1. Overview
- 11.2.17.2. Products
- 11.2.17.3. SWOT Analysis
- 11.2.17.4. Recent Developments
- 11.2.17.5. Financials (Based on Availability)
- 11.2.18 Calbee
- 11.2.18.1. Overview
- 11.2.18.2. Products
- 11.2.18.3. SWOT Analysis
- 11.2.18.4. Recent Developments
- 11.2.18.5. Financials (Based on Availability)
- 11.2.19 The Kraft Heinz Company
- 11.2.19.1. Overview
- 11.2.19.2. Products
- 11.2.19.3. SWOT Analysis
- 11.2.19.4. Recent Developments
- 11.2.19.5. Financials (Based on Availability)
- 11.2.20 Hormel Foods
- 11.2.20.1. Overview
- 11.2.20.2. Products
- 11.2.20.3. SWOT Analysis
- 11.2.20.4. Recent Developments
- 11.2.20.5. Financials (Based on Availability)
- 11.2.1 Mars
List of Figures
- Figure 1: Global Natural Foods Salty Snacks Revenue Breakdown (million, %) by Region 2025 & 2033
- Figure 2: Global Natural Foods Salty Snacks Volume Breakdown (K, %) by Region 2025 & 2033
- Figure 3: North America Natural Foods Salty Snacks Revenue (million), by Application 2025 & 2033
- Figure 4: North America Natural Foods Salty Snacks Volume (K), by Application 2025 & 2033
- Figure 5: North America Natural Foods Salty Snacks Revenue Share (%), by Application 2025 & 2033
- Figure 6: North America Natural Foods Salty Snacks Volume Share (%), by Application 2025 & 2033
- Figure 7: North America Natural Foods Salty Snacks Revenue (million), by Type 2025 & 2033
- Figure 8: North America Natural Foods Salty Snacks Volume (K), by Type 2025 & 2033
- Figure 9: North America Natural Foods Salty Snacks Revenue Share (%), by Type 2025 & 2033
- Figure 10: North America Natural Foods Salty Snacks Volume Share (%), by Type 2025 & 2033
- Figure 11: North America Natural Foods Salty Snacks Revenue (million), by Country 2025 & 2033
- Figure 12: North America Natural Foods Salty Snacks Volume (K), by Country 2025 & 2033
- Figure 13: North America Natural Foods Salty Snacks Revenue Share (%), by Country 2025 & 2033
- Figure 14: North America Natural Foods Salty Snacks Volume Share (%), by Country 2025 & 2033
- Figure 15: South America Natural Foods Salty Snacks Revenue (million), by Application 2025 & 2033
- Figure 16: South America Natural Foods Salty Snacks Volume (K), by Application 2025 & 2033
- Figure 17: South America Natural Foods Salty Snacks Revenue Share (%), by Application 2025 & 2033
- Figure 18: South America Natural Foods Salty Snacks Volume Share (%), by Application 2025 & 2033
- Figure 19: South America Natural Foods Salty Snacks Revenue (million), by Type 2025 & 2033
- Figure 20: South America Natural Foods Salty Snacks Volume (K), by Type 2025 & 2033
- Figure 21: South America Natural Foods Salty Snacks Revenue Share (%), by Type 2025 & 2033
- Figure 22: South America Natural Foods Salty Snacks Volume Share (%), by Type 2025 & 2033
- Figure 23: South America Natural Foods Salty Snacks Revenue (million), by Country 2025 & 2033
- Figure 24: South America Natural Foods Salty Snacks Volume (K), by Country 2025 & 2033
- Figure 25: South America Natural Foods Salty Snacks Revenue Share (%), by Country 2025 & 2033
- Figure 26: South America Natural Foods Salty Snacks Volume Share (%), by Country 2025 & 2033
- Figure 27: Europe Natural Foods Salty Snacks Revenue (million), by Application 2025 & 2033
- Figure 28: Europe Natural Foods Salty Snacks Volume (K), by Application 2025 & 2033
- Figure 29: Europe Natural Foods Salty Snacks Revenue Share (%), by Application 2025 & 2033
- Figure 30: Europe Natural Foods Salty Snacks Volume Share (%), by Application 2025 & 2033
- Figure 31: Europe Natural Foods Salty Snacks Revenue (million), by Type 2025 & 2033
- Figure 32: Europe Natural Foods Salty Snacks Volume (K), by Type 2025 & 2033
- Figure 33: Europe Natural Foods Salty Snacks Revenue Share (%), by Type 2025 & 2033
- Figure 34: Europe Natural Foods Salty Snacks Volume Share (%), by Type 2025 & 2033
- Figure 35: Europe Natural Foods Salty Snacks Revenue (million), by Country 2025 & 2033
- Figure 36: Europe Natural Foods Salty Snacks Volume (K), by Country 2025 & 2033
- Figure 37: Europe Natural Foods Salty Snacks Revenue Share (%), by Country 2025 & 2033
- Figure 38: Europe Natural Foods Salty Snacks Volume Share (%), by Country 2025 & 2033
- Figure 39: Middle East & Africa Natural Foods Salty Snacks Revenue (million), by Application 2025 & 2033
- Figure 40: Middle East & Africa Natural Foods Salty Snacks Volume (K), by Application 2025 & 2033
- Figure 41: Middle East & Africa Natural Foods Salty Snacks Revenue Share (%), by Application 2025 & 2033
- Figure 42: Middle East & Africa Natural Foods Salty Snacks Volume Share (%), by Application 2025 & 2033
- Figure 43: Middle East & Africa Natural Foods Salty Snacks Revenue (million), by Type 2025 & 2033
- Figure 44: Middle East & Africa Natural Foods Salty Snacks Volume (K), by Type 2025 & 2033
- Figure 45: Middle East & Africa Natural Foods Salty Snacks Revenue Share (%), by Type 2025 & 2033
- Figure 46: Middle East & Africa Natural Foods Salty Snacks Volume Share (%), by Type 2025 & 2033
- Figure 47: Middle East & Africa Natural Foods Salty Snacks Revenue (million), by Country 2025 & 2033
- Figure 48: Middle East & Africa Natural Foods Salty Snacks Volume (K), by Country 2025 & 2033
- Figure 49: Middle East & Africa Natural Foods Salty Snacks Revenue Share (%), by Country 2025 & 2033
- Figure 50: Middle East & Africa Natural Foods Salty Snacks Volume Share (%), by Country 2025 & 2033
- Figure 51: Asia Pacific Natural Foods Salty Snacks Revenue (million), by Application 2025 & 2033
- Figure 52: Asia Pacific Natural Foods Salty Snacks Volume (K), by Application 2025 & 2033
- Figure 53: Asia Pacific Natural Foods Salty Snacks Revenue Share (%), by Application 2025 & 2033
- Figure 54: Asia Pacific Natural Foods Salty Snacks Volume Share (%), by Application 2025 & 2033
- Figure 55: Asia Pacific Natural Foods Salty Snacks Revenue (million), by Type 2025 & 2033
- Figure 56: Asia Pacific Natural Foods Salty Snacks Volume (K), by Type 2025 & 2033
- Figure 57: Asia Pacific Natural Foods Salty Snacks Revenue Share (%), by Type 2025 & 2033
- Figure 58: Asia Pacific Natural Foods Salty Snacks Volume Share (%), by Type 2025 & 2033
- Figure 59: Asia Pacific Natural Foods Salty Snacks Revenue (million), by Country 2025 & 2033
- Figure 60: Asia Pacific Natural Foods Salty Snacks Volume (K), by Country 2025 & 2033
- Figure 61: Asia Pacific Natural Foods Salty Snacks Revenue Share (%), by Country 2025 & 2033
- Figure 62: Asia Pacific Natural Foods Salty Snacks Volume Share (%), by Country 2025 & 2033
List of Tables
- Table 1: Global Natural Foods Salty Snacks Revenue million Forecast, by Application 2020 & 2033
- Table 2: Global Natural Foods Salty Snacks Volume K Forecast, by Application 2020 & 2033
- Table 3: Global Natural Foods Salty Snacks Revenue million Forecast, by Type 2020 & 2033
- Table 4: Global Natural Foods Salty Snacks Volume K Forecast, by Type 2020 & 2033
- Table 5: Global Natural Foods Salty Snacks Revenue million Forecast, by Region 2020 & 2033
- Table 6: Global Natural Foods Salty Snacks Volume K Forecast, by Region 2020 & 2033
- Table 7: Global Natural Foods Salty Snacks Revenue million Forecast, by Application 2020 & 2033
- Table 8: Global Natural Foods Salty Snacks Volume K Forecast, by Application 2020 & 2033
- Table 9: Global Natural Foods Salty Snacks Revenue million Forecast, by Type 2020 & 2033
- Table 10: Global Natural Foods Salty Snacks Volume K Forecast, by Type 2020 & 2033
- Table 11: Global Natural Foods Salty Snacks Revenue million Forecast, by Country 2020 & 2033
- Table 12: Global Natural Foods Salty Snacks Volume K Forecast, by Country 2020 & 2033
- Table 13: United States Natural Foods Salty Snacks Revenue (million) Forecast, by Application 2020 & 2033
- Table 14: United States Natural Foods Salty Snacks Volume (K) Forecast, by Application 2020 & 2033
- Table 15: Canada Natural Foods Salty Snacks Revenue (million) Forecast, by Application 2020 & 2033
- Table 16: Canada Natural Foods Salty Snacks Volume (K) Forecast, by Application 2020 & 2033
- Table 17: Mexico Natural Foods Salty Snacks Revenue (million) Forecast, by Application 2020 & 2033
- Table 18: Mexico Natural Foods Salty Snacks Volume (K) Forecast, by Application 2020 & 2033
- Table 19: Global Natural Foods Salty Snacks Revenue million Forecast, by Application 2020 & 2033
- Table 20: Global Natural Foods Salty Snacks Volume K Forecast, by Application 2020 & 2033
- Table 21: Global Natural Foods Salty Snacks Revenue million Forecast, by Type 2020 & 2033
- Table 22: Global Natural Foods Salty Snacks Volume K Forecast, by Type 2020 & 2033
- Table 23: Global Natural Foods Salty Snacks Revenue million Forecast, by Country 2020 & 2033
- Table 24: Global Natural Foods Salty Snacks Volume K Forecast, by Country 2020 & 2033
- Table 25: Brazil Natural Foods Salty Snacks Revenue (million) Forecast, by Application 2020 & 2033
- Table 26: Brazil Natural Foods Salty Snacks Volume (K) Forecast, by Application 2020 & 2033
- Table 27: Argentina Natural Foods Salty Snacks Revenue (million) Forecast, by Application 2020 & 2033
- Table 28: Argentina Natural Foods Salty Snacks Volume (K) Forecast, by Application 2020 & 2033
- Table 29: Rest of South America Natural Foods Salty Snacks Revenue (million) Forecast, by Application 2020 & 2033
- Table 30: Rest of South America Natural Foods Salty Snacks Volume (K) Forecast, by Application 2020 & 2033
- Table 31: Global Natural Foods Salty Snacks Revenue million Forecast, by Application 2020 & 2033
- Table 32: Global Natural Foods Salty Snacks Volume K Forecast, by Application 2020 & 2033
- Table 33: Global Natural Foods Salty Snacks Revenue million Forecast, by Type 2020 & 2033
- Table 34: Global Natural Foods Salty Snacks Volume K Forecast, by Type 2020 & 2033
- Table 35: Global Natural Foods Salty Snacks Revenue million Forecast, by Country 2020 & 2033
- Table 36: Global Natural Foods Salty Snacks Volume K Forecast, by Country 2020 & 2033
- Table 37: United Kingdom Natural Foods Salty Snacks Revenue (million) Forecast, by Application 2020 & 2033
- Table 38: United Kingdom Natural Foods Salty Snacks Volume (K) Forecast, by Application 2020 & 2033
- Table 39: Germany Natural Foods Salty Snacks Revenue (million) Forecast, by Application 2020 & 2033
- Table 40: Germany Natural Foods Salty Snacks Volume (K) Forecast, by Application 2020 & 2033
- Table 41: France Natural Foods Salty Snacks Revenue (million) Forecast, by Application 2020 & 2033
- Table 42: France Natural Foods Salty Snacks Volume (K) Forecast, by Application 2020 & 2033
- Table 43: Italy Natural Foods Salty Snacks Revenue (million) Forecast, by Application 2020 & 2033
- Table 44: Italy Natural Foods Salty Snacks Volume (K) Forecast, by Application 2020 & 2033
- Table 45: Spain Natural Foods Salty Snacks Revenue (million) Forecast, by Application 2020 & 2033
- Table 46: Spain Natural Foods Salty Snacks Volume (K) Forecast, by Application 2020 & 2033
- Table 47: Russia Natural Foods Salty Snacks Revenue (million) Forecast, by Application 2020 & 2033
- Table 48: Russia Natural Foods Salty Snacks Volume (K) Forecast, by Application 2020 & 2033
- Table 49: Benelux Natural Foods Salty Snacks Revenue (million) Forecast, by Application 2020 & 2033
- Table 50: Benelux Natural Foods Salty Snacks Volume (K) Forecast, by Application 2020 & 2033
- Table 51: Nordics Natural Foods Salty Snacks Revenue (million) Forecast, by Application 2020 & 2033
- Table 52: Nordics Natural Foods Salty Snacks Volume (K) Forecast, by Application 2020 & 2033
- Table 53: Rest of Europe Natural Foods Salty Snacks Revenue (million) Forecast, by Application 2020 & 2033
- Table 54: Rest of Europe Natural Foods Salty Snacks Volume (K) Forecast, by Application 2020 & 2033
- Table 55: Global Natural Foods Salty Snacks Revenue million Forecast, by Application 2020 & 2033
- Table 56: Global Natural Foods Salty Snacks Volume K Forecast, by Application 2020 & 2033
- Table 57: Global Natural Foods Salty Snacks Revenue million Forecast, by Type 2020 & 2033
- Table 58: Global Natural Foods Salty Snacks Volume K Forecast, by Type 2020 & 2033
- Table 59: Global Natural Foods Salty Snacks Revenue million Forecast, by Country 2020 & 2033
- Table 60: Global Natural Foods Salty Snacks Volume K Forecast, by Country 2020 & 2033
- Table 61: Turkey Natural Foods Salty Snacks Revenue (million) Forecast, by Application 2020 & 2033
- Table 62: Turkey Natural Foods Salty Snacks Volume (K) Forecast, by Application 2020 & 2033
- Table 63: Israel Natural Foods Salty Snacks Revenue (million) Forecast, by Application 2020 & 2033
- Table 64: Israel Natural Foods Salty Snacks Volume (K) Forecast, by Application 2020 & 2033
- Table 65: GCC Natural Foods Salty Snacks Revenue (million) Forecast, by Application 2020 & 2033
- Table 66: GCC Natural Foods Salty Snacks Volume (K) Forecast, by Application 2020 & 2033
- Table 67: North Africa Natural Foods Salty Snacks Revenue (million) Forecast, by Application 2020 & 2033
- Table 68: North Africa Natural Foods Salty Snacks Volume (K) Forecast, by Application 2020 & 2033
- Table 69: South Africa Natural Foods Salty Snacks Revenue (million) Forecast, by Application 2020 & 2033
- Table 70: South Africa Natural Foods Salty Snacks Volume (K) Forecast, by Application 2020 & 2033
- Table 71: Rest of Middle East & Africa Natural Foods Salty Snacks Revenue (million) Forecast, by Application 2020 & 2033
- Table 72: Rest of Middle East & Africa Natural Foods Salty Snacks Volume (K) Forecast, by Application 2020 & 2033
- Table 73: Global Natural Foods Salty Snacks Revenue million Forecast, by Application 2020 & 2033
- Table 74: Global Natural Foods Salty Snacks Volume K Forecast, by Application 2020 & 2033
- Table 75: Global Natural Foods Salty Snacks Revenue million Forecast, by Type 2020 & 2033
- Table 76: Global Natural Foods Salty Snacks Volume K Forecast, by Type 2020 & 2033
- Table 77: Global Natural Foods Salty Snacks Revenue million Forecast, by Country 2020 & 2033
- Table 78: Global Natural Foods Salty Snacks Volume K Forecast, by Country 2020 & 2033
- Table 79: China Natural Foods Salty Snacks Revenue (million) Forecast, by Application 2020 & 2033
- Table 80: China Natural Foods Salty Snacks Volume (K) Forecast, by Application 2020 & 2033
- Table 81: India Natural Foods Salty Snacks Revenue (million) Forecast, by Application 2020 & 2033
- Table 82: India Natural Foods Salty Snacks Volume (K) Forecast, by Application 2020 & 2033
- Table 83: Japan Natural Foods Salty Snacks Revenue (million) Forecast, by Application 2020 & 2033
- Table 84: Japan Natural Foods Salty Snacks Volume (K) Forecast, by Application 2020 & 2033
- Table 85: South Korea Natural Foods Salty Snacks Revenue (million) Forecast, by Application 2020 & 2033
- Table 86: South Korea Natural Foods Salty Snacks Volume (K) Forecast, by Application 2020 & 2033
- Table 87: ASEAN Natural Foods Salty Snacks Revenue (million) Forecast, by Application 2020 & 2033
- Table 88: ASEAN Natural Foods Salty Snacks Volume (K) Forecast, by Application 2020 & 2033
- Table 89: Oceania Natural Foods Salty Snacks Revenue (million) Forecast, by Application 2020 & 2033
- Table 90: Oceania Natural Foods Salty Snacks Volume (K) Forecast, by Application 2020 & 2033
- Table 91: Rest of Asia Pacific Natural Foods Salty Snacks Revenue (million) Forecast, by Application 2020 & 2033
- Table 92: Rest of Asia Pacific Natural Foods Salty Snacks Volume (K) Forecast, by Application 2020 & 2033
Frequently Asked Questions
1. What is the projected Compound Annual Growth Rate (CAGR) of the Natural Foods Salty Snacks?
The projected CAGR is approximately 6.6%.
2. Which companies are prominent players in the Natural Foods Salty Snacks?
Key companies in the market include Mars, Popchips, The Hain Celestial Group, Simply 7, Late July, Siete Family Foods, Mondelez, Blue Diamond, The Wonderful Company, Brami, Yumi's, Propercorn, Inka Crops, Campbell Soup Company, PepsiCo, Kellogg's, General Mills, Calbee, The Kraft Heinz Company, Hormel Foods.
3. What are the main segments of the Natural Foods Salty Snacks?
The market segments include Application, Type.
4. Can you provide details about the market size?
The market size is estimated to be USD 13920 million as of 2022.
5. What are some drivers contributing to market growth?
N/A
6. What are the notable trends driving market growth?
N/A
7. Are there any restraints impacting market growth?
N/A
8. Can you provide examples of recent developments in the market?
N/A
9. What pricing options are available for accessing the report?
Pricing options include single-user, multi-user, and enterprise licenses priced at USD 3950.00, USD 5925.00, and USD 7900.00 respectively.
10. Is the market size provided in terms of value or volume?
The market size is provided in terms of value, measured in million and volume, measured in K.
11. Are there any specific market keywords associated with the report?
Yes, the market keyword associated with the report is "Natural Foods Salty Snacks," which aids in identifying and referencing the specific market segment covered.
12. How do I determine which pricing option suits my needs best?
The pricing options vary based on user requirements and access needs. Individual users may opt for single-user licenses, while businesses requiring broader access may choose multi-user or enterprise licenses for cost-effective access to the report.
13. Are there any additional resources or data provided in the Natural Foods Salty Snacks report?
While the report offers comprehensive insights, it's advisable to review the specific contents or supplementary materials provided to ascertain if additional resources or data are available.
14. How can I stay updated on further developments or reports in the Natural Foods Salty Snacks?
To stay informed about further developments, trends, and reports in the Natural Foods Salty Snacks, consider subscribing to industry newsletters, following relevant companies and organizations, or regularly checking reputable industry news sources and publications.
Methodology
Step 1 - Identification of Relevant Samples Size from Population Database


Step 2 - Approaches for Defining Global Market Size (Value, Volume* & Price*)

Note*: In applicable scenarios
Step 3 - Data Sources
Primary Research
- Web Analytics
- Survey Reports
- Research Institute
- Latest Research Reports
- Opinion Leaders
Secondary Research
- Annual Reports
- White Paper
- Latest Press Release
- Industry Association
- Paid Database
- Investor Presentations

Step 4 - Data Triangulation
Involves using different sources of information in order to increase the validity of a study
These sources are likely to be stakeholders in a program - participants, other researchers, program staff, other community members, and so on.
Then we put all data in single framework & apply various statistical tools to find out the dynamic on the market.
During the analysis stage, feedback from the stakeholder groups would be compared to determine areas of agreement as well as areas of divergence