

Key Insights
The global natural flavoring market is projected for significant expansion, reaching an estimated market size of 9.64 billion by 2025. A robust Compound Annual Growth Rate (CAGR) of 9.39% is anticipated from 2025 to 2033. This growth is primarily driven by increasing consumer demand for healthier, transparent food and beverage options and growing awareness of the adverse effects of artificial additives. Manufacturers are increasingly opting for natural flavors from fruits, vegetables, and spices, with the beverage and confectionery sectors leading adoption. The preference for clean-label products and rising disposable incomes in emerging economies further fuel market expansion. Innovations in extraction and encapsulation technologies are enhancing the stability and applicability of natural flavors across a wider range of food products.
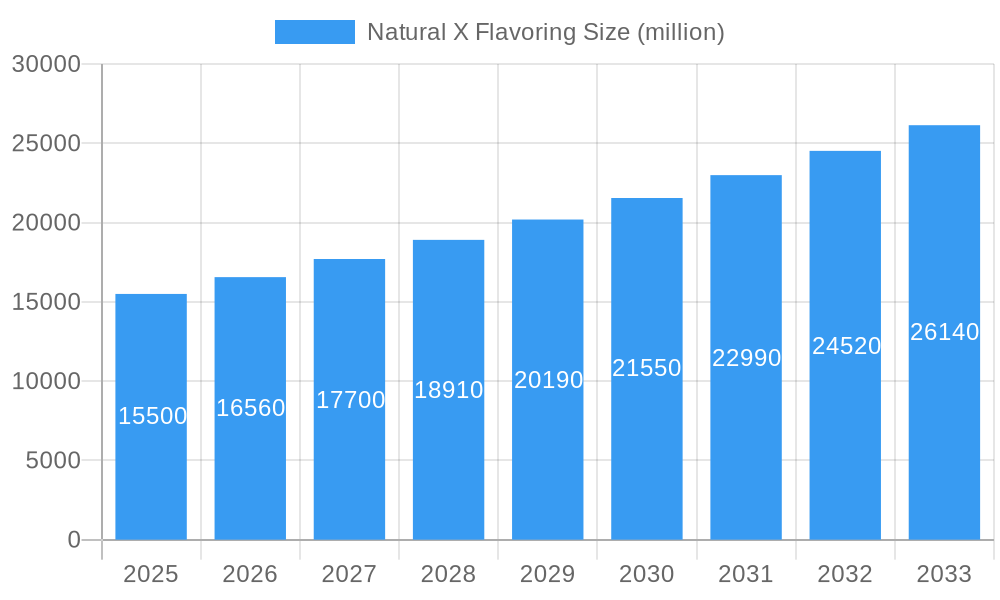
Natural X Flavoring Market Size (In Billion)
While substantial growth is evident, potential restraints include inherent variability in natural ingredient sourcing and processing, leading to flavor inconsistencies and higher production costs compared to synthetic alternatives. Stringent regional regulations for sourcing, processing, and labeling natural flavors also present challenges. However, ongoing research and development efforts are focused on improving scalability and cost-effectiveness. Leading players like Givaudan, Firmenich, and Symrise are investing in sustainable sourcing and advanced technologies. The emergence of niche segments such as water essence and emulsified flavors caters to specific product development needs, contributing to sustained market dynamism.
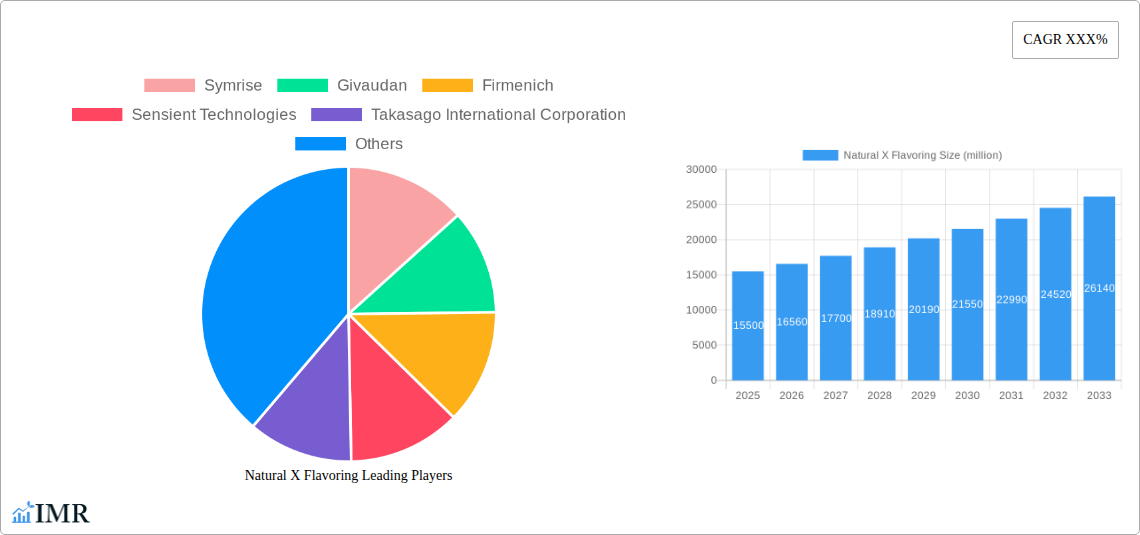
Natural X Flavoring Company Market Share
Global Natural Flavoring Market Analysis: 2025-2033 Growth Outlook
This comprehensive report provides critical analysis and actionable insights for stakeholders in the dynamic natural flavoring market. Covering the period from 2019 to 2033, with a base year of 2025, it leverages extensive data to detail market size, growth drivers, regional trends, competitive landscape, and emerging opportunities. The forecast for 2025-2033 offers crucial strategic guidance for the global flavor and fragrance industry.
Natural X Flavoring Market Dynamics & Structure
The Natural X Flavoring market exhibits a moderately concentrated structure, with key players like Symrise, Givaudan, and Firmenich holding significant market shares, estimated at around 25% combined in the base year of 2025. Technological innovation is primarily driven by advancements in extraction techniques, encapsulation technologies, and the identification of novel natural flavor compounds. Regulatory frameworks, particularly in regions like Europe and North America, are increasingly stringent, favoring natural and clean-label ingredients, which acts as both a driver and a barrier to entry. Competitive product substitutes are largely synthetic flavorings, though growing consumer preference for natural alternatives is diminishing their appeal. End-user demographics are shifting towards health-conscious consumers seeking transparent ingredient lists and naturally derived products. Mergers and acquisitions (M&A) are an ongoing trend, with an estimated 3-5 significant deals annually between 2019-2024, aimed at consolidating market share and expanding product portfolios. For example, the acquisition of smaller specialty flavor houses by larger corporations has been prevalent. Innovation barriers include the high cost of sourcing natural raw materials, complex extraction processes, and ensuring consistent flavor profiles.
- Market Concentration: Moderately concentrated with key players holding substantial shares.
- Technological Innovation Drivers: Advancements in extraction, encapsulation, and novel compound identification.
- Regulatory Frameworks: Increasingly stringent, favoring natural and clean-label ingredients.
- Competitive Product Substitutes: Primarily synthetic flavorings, with declining consumer preference.
- End-User Demographics: Shift towards health-conscious consumers.
- M&A Trends: Ongoing consolidation, with an estimated 3-5 significant deals annually.
- Innovation Barriers: High raw material costs, complex processing, and consistency challenges.
Natural X Flavoring Growth Trends & Insights
The Natural X Flavoring market is poised for substantial growth, driven by evolving consumer preferences and industry innovation. Market size is projected to grow from an estimated $12,500 million units in 2025 to $21,800 million units by 2033, exhibiting a Compound Annual Growth Rate (CAGR) of approximately 7.2% during the forecast period. This expansion is fueled by a significant increase in adoption rates for natural flavorings across various applications, particularly in the food and beverage sector. The estimated market penetration of natural flavorings within the broader flavoring market was around 45% in 2025 and is expected to reach 58% by 2033. Technological disruptions, such as precision fermentation and AI-driven flavor discovery, are playing a pivotal role in enhancing efficiency, sustainability, and the range of available natural flavor profiles. Consumer behavior shifts are deeply influencing this market; there's a pronounced demand for "clean label" products, with consumers actively seeking ingredients they can recognize and trust. This preference extends beyond mere absence of artificial additives, emphasizing natural sourcing, ethical production, and perceived health benefits. The "free-from" trend, while initially focused on allergens, has broadened to encompass artificial colors, flavors, and preservatives, directly benefiting the Natural X Flavoring segment. Furthermore, the increasing global awareness of the potential health impacts of synthetic chemicals is accelerating the transition towards natural alternatives. The base year, 2025, represents a crucial juncture where manufacturers are increasingly investing in R&D to meet these evolving demands, exploring novel botanical extracts and fermentation-derived flavors. The growth trajectory indicates that Natural X Flavorings are no longer a niche segment but a mainstream imperative for brand differentiation and consumer appeal. The forecast period (2025-2033) will likely witness intensified competition and further innovation, as companies strive to capture market share by offering unique, sustainable, and high-quality natural flavor solutions that align with the overarching global trend towards healthier and more natural consumption patterns. This sustained demand, coupled with ongoing technological advancements, solidifies the strong growth outlook for the Natural X Flavoring market.
Dominant Regions, Countries, or Segments in Natural X Flavoring
The Drinks segment, projected to account for approximately 35% of the Natural X Flavoring market in 2025, stands as the dominant application driving global growth. This dominance stems from the beverage industry's relentless pursuit of healthier, natural-tasting options to cater to a health-conscious global consumer base. Countries within North America, particularly the United States, and Europe, including Germany and the United Kingdom, are leading this expansion due to strong consumer demand for natural beverages, including juices, teas, and functional drinks. Economic policies in these regions often favor the development and labeling of natural food products, further stimulating demand. Infrastructure supporting the production and distribution of natural ingredients is also well-established.
Within the Drinks segment, the sub-segment of Water Essence is exhibiting remarkable growth, driven by the burgeoning market for flavored waters and enhanced hydration beverages. The estimated market share of Water Essence within the Drinks segment is approximately 40% in 2025, expected to reach 48% by 2033. Asia-Pacific, particularly China and India, is emerging as a significant growth frontier for natural flavorings in drinks, propelled by a rapidly expanding middle class with increasing disposable income and a growing awareness of health and wellness trends. Local manufacturers are actively incorporating natural flavorings to differentiate their products in a crowded market.
The Oily Essence type, holding an estimated 30% market share in 2025, also plays a crucial role, especially in dairy products and confectionery. Countries with established dairy industries, such as France and the Netherlands, are significant consumers of oily natural essences.
- Dominant Application Segment: Drinks, representing approximately 35% of the market in 2025.
- Key Growth Regions for Drinks: North America (United States) and Europe (Germany, UK).
- Emerging Growth Frontier: Asia-Pacific (China, India) for natural flavorings in beverages.
- Dominant Type within Drinks: Water Essence, with an estimated 40% share in 2025.
- Key Role of Oily Essence: Significant in dairy products and confectionery, holding ~30% market share in 2025.
- Economic & Policy Influence: Favorable policies in developed regions supporting natural product development.
- Infrastructure Advantage: Well-developed infrastructure in leading regions for natural ingredient production.
Natural X Flavoring Product Landscape
The Natural X Flavoring product landscape is characterized by continuous innovation aimed at enhancing sensory experiences and meeting evolving consumer demands for clean labels. Key product innovations include the development of complex natural flavor blends that mimic traditional artificial profiles with greater authenticity, advancements in natural aroma compounds derived from fermentation processes, and the creation of highly soluble and stable natural extracts for diverse applications. Applications range from crafting nuanced fruit and floral notes in beverages and confectionery to providing authentic savory profiles in seasonings and processed foods. Performance metrics focus on flavor intensity, stability under processing conditions, and shelf-life extension. Unique selling propositions often lie in the traceability of ingredients, sustainable sourcing practices, and the creation of proprietary flavor profiles that offer a competitive edge. Technological advancements are enabling the encapsulation of sensitive natural flavors, improving their delivery and longevity in various food matrices.
Key Drivers, Barriers & Challenges in Natural X Flavoring
Key Drivers:
- Rising Consumer Demand for Natural and Clean Label Products: A primary catalyst, driven by health consciousness and ingredient transparency.
- Technological Advancements in Extraction and Synthesis: Enabling wider availability and improved quality of natural flavorings.
- Regulatory Support for Natural Ingredients: Policies favoring natural and organic certifications incentivize market growth.
- Growing Awareness of Health Benefits: Perception of natural flavors as healthier alternatives to synthetic ones.
- Innovation in Food and Beverage Industry: New product development increasingly relies on natural flavor profiles.
Key Barriers & Challenges:
- High Cost of Raw Materials: Natural sourcing can be more expensive than synthetic production.
- Supply Chain Volatility and Sustainability Concerns: Dependence on agricultural output, susceptible to climate change and geopolitical factors.
- Regulatory Hurdles and Labeling Complexity: Navigating diverse international regulations for "natural" claims.
- Consistency and Stability Issues: Achieving uniform flavor profiles and stability across different batches and applications.
- Competition from Established Synthetic Flavors: While declining, synthetic flavors still offer cost advantages for some applications.
- Limited Flavor Spectrum and Intensity: Some natural sources may offer a narrower range of notes or lower intensity compared to synthetics.
Emerging Opportunities in Natural X Flavoring
Emerging opportunities in the Natural X Flavoring market are centered around untapped regions, innovative applications, and evolving consumer preferences. The burgeoning demand for plant-based foods and beverages presents a significant opportunity, as natural flavorings are crucial for replicating traditional tastes and enhancing the appeal of these products. Furthermore, the growing interest in functional foods and beverages, fortified with natural ingredients for specific health benefits, opens new avenues for specialized natural flavor profiles. The expansion of e-commerce and direct-to-consumer models for food products also creates opportunities for premium, artisanal natural flavorings. There is also a notable opportunity in developing natural flavor solutions for emerging food categories like alternative proteins and cultured meats, where authentic taste profiles are paramount for consumer acceptance.
Growth Accelerators in the Natural X Flavoring Industry
Long-term growth in the Natural X Flavoring industry is being accelerated by several key factors. Technological breakthroughs in biotechnology, particularly in the realm of precision fermentation and enzymatic modification of natural compounds, are enabling the creation of novel, cost-effective, and sustainable natural flavors. Strategic partnerships between flavor houses, ingredient suppliers, and food manufacturers are fostering co-creation and faster market penetration for new products. Market expansion strategies targeting developing economies, where consumer awareness and demand for natural products are rapidly increasing, represent a significant growth accelerator. The increasing focus on sustainability and traceability throughout the supply chain is also driving innovation and creating a competitive advantage for companies that can demonstrate responsible sourcing and production practices.
Key Players Shaping the Natural X Flavoring Market
- Symrise
- Givaudan
- Firmenich
- Sensient Technologies
- Takasago International Corporation
- Synergy Flavors
- International Flavors & Fragrances
- Robertet Group
- Bell Flavors & Fragrances
- Blue Pacific Flavors
Notable Milestones in Natural X Flavoring Sector
- 2019: Increased investment in research and development for botanical extracts by major flavor houses.
- 2020: Growing consumer backlash against artificial ingredients, leading to a surge in demand for natural alternatives.
- 2021: Advancements in fermentation technology enabling production of complex natural flavor molecules.
- 2022: Strategic acquisitions of smaller, specialized natural ingredient companies by larger players.
- 2023: Launch of new product lines focused on clean-label solutions and sustainable sourcing.
- 2024: Increased regulatory scrutiny and clarity on "natural" labeling standards in key markets.
In-Depth Natural X Flavoring Market Outlook
The outlook for the Natural X Flavoring market remains exceptionally strong, driven by sustained consumer preference for natural and healthy products. Growth accelerators like biotechnological innovations in precision fermentation and enzyme technology will continue to unlock new flavor possibilities and improve production efficiency, thereby mitigating cost barriers. Strategic collaborations between ingredient suppliers, flavor houses, and food and beverage manufacturers will be crucial for expedited product development and market penetration, especially in emerging economies where demand is rapidly rising. The industry's commitment to sustainability and transparent sourcing is becoming a significant competitive advantage, aligning with global ESG (Environmental, Social, and Governance) trends. Future market potential lies in expanding applications within the plant-based and functional food sectors, alongside continuous innovation in flavor profiles that cater to diverse cultural palates and evolving consumer lifestyles. This confluence of factors positions the Natural X Flavoring market for robust and sustained growth through 2033 and beyond.
Natural X Flavoring Segmentation
-
1. Application
- 1.1. Drinks
- 1.2. Candy
- 1.3. Seasoning
- 1.4. Dairy Products
- 1.5. Canned Food
- 1.6. Liquor
-
2. Type
- 2.1. Water Essence
- 2.2. Oily Essence
- 2.3. Emulsified Flavor
- 2.4. Powder Essence
Natural X Flavoring Segmentation By Geography
-
1. North America
- 1.1. United States
- 1.2. Canada
- 1.3. Mexico
-
2. South America
- 2.1. Brazil
- 2.2. Argentina
- 2.3. Rest of South America
-
3. Europe
- 3.1. United Kingdom
- 3.2. Germany
- 3.3. France
- 3.4. Italy
- 3.5. Spain
- 3.6. Russia
- 3.7. Benelux
- 3.8. Nordics
- 3.9. Rest of Europe
-
4. Middle East & Africa
- 4.1. Turkey
- 4.2. Israel
- 4.3. GCC
- 4.4. North Africa
- 4.5. South Africa
- 4.6. Rest of Middle East & Africa
-
5. Asia Pacific
- 5.1. China
- 5.2. India
- 5.3. Japan
- 5.4. South Korea
- 5.5. ASEAN
- 5.6. Oceania
- 5.7. Rest of Asia Pacific
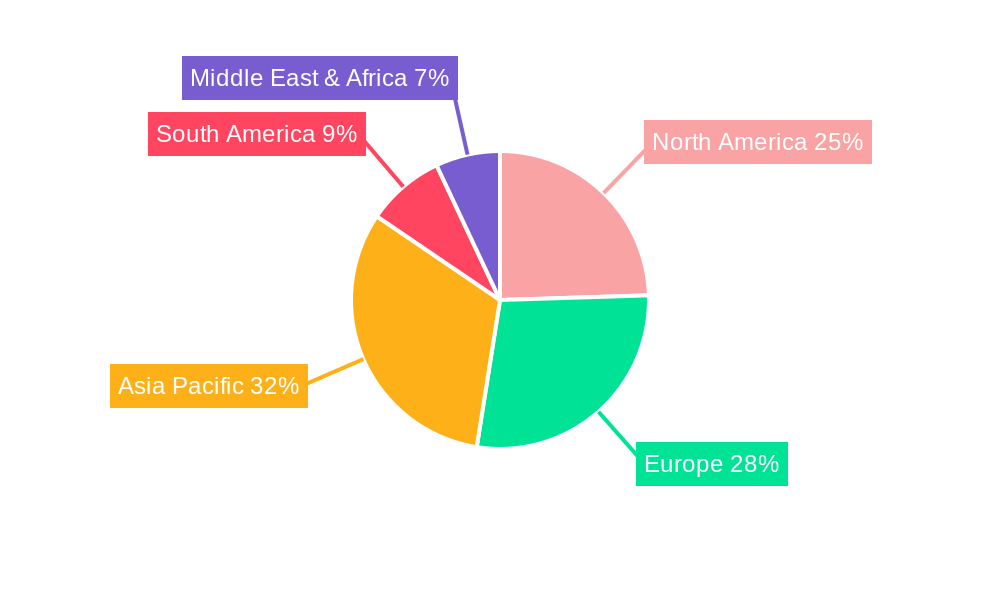
Natural X Flavoring Regional Market Share
Geographic Coverage of Natural X Flavoring
Natural X Flavoring REPORT HIGHLIGHTS
| Aspects | Details |
|---|---|
| Study Period | 2020-2034 |
| Base Year | 2025 |
| Estimated Year | 2026 |
| Forecast Period | 2026-2034 |
| Historical Period | 2020-2025 |
| Growth Rate | CAGR of 9.39% from 2020-2034 |
| Segmentation |
|
Table of Contents
- 1. Introduction
- 1.1. Research Scope
- 1.2. Market Segmentation
- 1.3. Research Methodology
- 1.4. Definitions and Assumptions
- 2. Executive Summary
- 2.1. Introduction
- 3. Market Dynamics
- 3.1. Introduction
- 3.2. Market Drivers
- 3.3. Market Restrains
- 3.4. Market Trends
- 4. Market Factor Analysis
- 4.1. Porters Five Forces
- 4.2. Supply/Value Chain
- 4.3. PESTEL analysis
- 4.4. Market Entropy
- 4.5. Patent/Trademark Analysis
- 5. Global Natural X Flavoring Analysis, Insights and Forecast, 2020-2032
- 5.1. Market Analysis, Insights and Forecast - by Application
- 5.1.1. Drinks
- 5.1.2. Candy
- 5.1.3. Seasoning
- 5.1.4. Dairy Products
- 5.1.5. Canned Food
- 5.1.6. Liquor
- 5.2. Market Analysis, Insights and Forecast - by Type
- 5.2.1. Water Essence
- 5.2.2. Oily Essence
- 5.2.3. Emulsified Flavor
- 5.2.4. Powder Essence
- 5.3. Market Analysis, Insights and Forecast - by Region
- 5.3.1. North America
- 5.3.2. South America
- 5.3.3. Europe
- 5.3.4. Middle East & Africa
- 5.3.5. Asia Pacific
- 5.1. Market Analysis, Insights and Forecast - by Application
- 6. North America Natural X Flavoring Analysis, Insights and Forecast, 2020-2032
- 6.1. Market Analysis, Insights and Forecast - by Application
- 6.1.1. Drinks
- 6.1.2. Candy
- 6.1.3. Seasoning
- 6.1.4. Dairy Products
- 6.1.5. Canned Food
- 6.1.6. Liquor
- 6.2. Market Analysis, Insights and Forecast - by Type
- 6.2.1. Water Essence
- 6.2.2. Oily Essence
- 6.2.3. Emulsified Flavor
- 6.2.4. Powder Essence
- 6.1. Market Analysis, Insights and Forecast - by Application
- 7. South America Natural X Flavoring Analysis, Insights and Forecast, 2020-2032
- 7.1. Market Analysis, Insights and Forecast - by Application
- 7.1.1. Drinks
- 7.1.2. Candy
- 7.1.3. Seasoning
- 7.1.4. Dairy Products
- 7.1.5. Canned Food
- 7.1.6. Liquor
- 7.2. Market Analysis, Insights and Forecast - by Type
- 7.2.1. Water Essence
- 7.2.2. Oily Essence
- 7.2.3. Emulsified Flavor
- 7.2.4. Powder Essence
- 7.1. Market Analysis, Insights and Forecast - by Application
- 8. Europe Natural X Flavoring Analysis, Insights and Forecast, 2020-2032
- 8.1. Market Analysis, Insights and Forecast - by Application
- 8.1.1. Drinks
- 8.1.2. Candy
- 8.1.3. Seasoning
- 8.1.4. Dairy Products
- 8.1.5. Canned Food
- 8.1.6. Liquor
- 8.2. Market Analysis, Insights and Forecast - by Type
- 8.2.1. Water Essence
- 8.2.2. Oily Essence
- 8.2.3. Emulsified Flavor
- 8.2.4. Powder Essence
- 8.1. Market Analysis, Insights and Forecast - by Application
- 9. Middle East & Africa Natural X Flavoring Analysis, Insights and Forecast, 2020-2032
- 9.1. Market Analysis, Insights and Forecast - by Application
- 9.1.1. Drinks
- 9.1.2. Candy
- 9.1.3. Seasoning
- 9.1.4. Dairy Products
- 9.1.5. Canned Food
- 9.1.6. Liquor
- 9.2. Market Analysis, Insights and Forecast - by Type
- 9.2.1. Water Essence
- 9.2.2. Oily Essence
- 9.2.3. Emulsified Flavor
- 9.2.4. Powder Essence
- 9.1. Market Analysis, Insights and Forecast - by Application
- 10. Asia Pacific Natural X Flavoring Analysis, Insights and Forecast, 2020-2032
- 10.1. Market Analysis, Insights and Forecast - by Application
- 10.1.1. Drinks
- 10.1.2. Candy
- 10.1.3. Seasoning
- 10.1.4. Dairy Products
- 10.1.5. Canned Food
- 10.1.6. Liquor
- 10.2. Market Analysis, Insights and Forecast - by Type
- 10.2.1. Water Essence
- 10.2.2. Oily Essence
- 10.2.3. Emulsified Flavor
- 10.2.4. Powder Essence
- 10.1. Market Analysis, Insights and Forecast - by Application
- 11. Competitive Analysis
- 11.1. Global Market Share Analysis 2025
- 11.2. Company Profiles
- 11.2.1 Symrise
- 11.2.1.1. Overview
- 11.2.1.2. Products
- 11.2.1.3. SWOT Analysis
- 11.2.1.4. Recent Developments
- 11.2.1.5. Financials (Based on Availability)
- 11.2.2 Givaudan
- 11.2.2.1. Overview
- 11.2.2.2. Products
- 11.2.2.3. SWOT Analysis
- 11.2.2.4. Recent Developments
- 11.2.2.5. Financials (Based on Availability)
- 11.2.3 Firmenich
- 11.2.3.1. Overview
- 11.2.3.2. Products
- 11.2.3.3. SWOT Analysis
- 11.2.3.4. Recent Developments
- 11.2.3.5. Financials (Based on Availability)
- 11.2.4 Sensient Technologies
- 11.2.4.1. Overview
- 11.2.4.2. Products
- 11.2.4.3. SWOT Analysis
- 11.2.4.4. Recent Developments
- 11.2.4.5. Financials (Based on Availability)
- 11.2.5 Takasago International Corporation
- 11.2.5.1. Overview
- 11.2.5.2. Products
- 11.2.5.3. SWOT Analysis
- 11.2.5.4. Recent Developments
- 11.2.5.5. Financials (Based on Availability)
- 11.2.6 Synergy Flavors
- 11.2.6.1. Overview
- 11.2.6.2. Products
- 11.2.6.3. SWOT Analysis
- 11.2.6.4. Recent Developments
- 11.2.6.5. Financials (Based on Availability)
- 11.2.7 International Flavors & Fragrances
- 11.2.7.1. Overview
- 11.2.7.2. Products
- 11.2.7.3. SWOT Analysis
- 11.2.7.4. Recent Developments
- 11.2.7.5. Financials (Based on Availability)
- 11.2.8 Robertet Group
- 11.2.8.1. Overview
- 11.2.8.2. Products
- 11.2.8.3. SWOT Analysis
- 11.2.8.4. Recent Developments
- 11.2.8.5. Financials (Based on Availability)
- 11.2.9 Bell Flavors & Fragrances
- 11.2.9.1. Overview
- 11.2.9.2. Products
- 11.2.9.3. SWOT Analysis
- 11.2.9.4. Recent Developments
- 11.2.9.5. Financials (Based on Availability)
- 11.2.10 Blue Pacific Flavors
- 11.2.10.1. Overview
- 11.2.10.2. Products
- 11.2.10.3. SWOT Analysis
- 11.2.10.4. Recent Developments
- 11.2.10.5. Financials (Based on Availability)
- 11.2.1 Symrise
List of Figures
- Figure 1: Global Natural X Flavoring Revenue Breakdown (billion, %) by Region 2025 & 2033
- Figure 2: North America Natural X Flavoring Revenue (billion), by Application 2025 & 2033
- Figure 3: North America Natural X Flavoring Revenue Share (%), by Application 2025 & 2033
- Figure 4: North America Natural X Flavoring Revenue (billion), by Type 2025 & 2033
- Figure 5: North America Natural X Flavoring Revenue Share (%), by Type 2025 & 2033
- Figure 6: North America Natural X Flavoring Revenue (billion), by Country 2025 & 2033
- Figure 7: North America Natural X Flavoring Revenue Share (%), by Country 2025 & 2033
- Figure 8: South America Natural X Flavoring Revenue (billion), by Application 2025 & 2033
- Figure 9: South America Natural X Flavoring Revenue Share (%), by Application 2025 & 2033
- Figure 10: South America Natural X Flavoring Revenue (billion), by Type 2025 & 2033
- Figure 11: South America Natural X Flavoring Revenue Share (%), by Type 2025 & 2033
- Figure 12: South America Natural X Flavoring Revenue (billion), by Country 2025 & 2033
- Figure 13: South America Natural X Flavoring Revenue Share (%), by Country 2025 & 2033
- Figure 14: Europe Natural X Flavoring Revenue (billion), by Application 2025 & 2033
- Figure 15: Europe Natural X Flavoring Revenue Share (%), by Application 2025 & 2033
- Figure 16: Europe Natural X Flavoring Revenue (billion), by Type 2025 & 2033
- Figure 17: Europe Natural X Flavoring Revenue Share (%), by Type 2025 & 2033
- Figure 18: Europe Natural X Flavoring Revenue (billion), by Country 2025 & 2033
- Figure 19: Europe Natural X Flavoring Revenue Share (%), by Country 2025 & 2033
- Figure 20: Middle East & Africa Natural X Flavoring Revenue (billion), by Application 2025 & 2033
- Figure 21: Middle East & Africa Natural X Flavoring Revenue Share (%), by Application 2025 & 2033
- Figure 22: Middle East & Africa Natural X Flavoring Revenue (billion), by Type 2025 & 2033
- Figure 23: Middle East & Africa Natural X Flavoring Revenue Share (%), by Type 2025 & 2033
- Figure 24: Middle East & Africa Natural X Flavoring Revenue (billion), by Country 2025 & 2033
- Figure 25: Middle East & Africa Natural X Flavoring Revenue Share (%), by Country 2025 & 2033
- Figure 26: Asia Pacific Natural X Flavoring Revenue (billion), by Application 2025 & 2033
- Figure 27: Asia Pacific Natural X Flavoring Revenue Share (%), by Application 2025 & 2033
- Figure 28: Asia Pacific Natural X Flavoring Revenue (billion), by Type 2025 & 2033
- Figure 29: Asia Pacific Natural X Flavoring Revenue Share (%), by Type 2025 & 2033
- Figure 30: Asia Pacific Natural X Flavoring Revenue (billion), by Country 2025 & 2033
- Figure 31: Asia Pacific Natural X Flavoring Revenue Share (%), by Country 2025 & 2033
List of Tables
- Table 1: Global Natural X Flavoring Revenue billion Forecast, by Application 2020 & 2033
- Table 2: Global Natural X Flavoring Revenue billion Forecast, by Type 2020 & 2033
- Table 3: Global Natural X Flavoring Revenue billion Forecast, by Region 2020 & 2033
- Table 4: Global Natural X Flavoring Revenue billion Forecast, by Application 2020 & 2033
- Table 5: Global Natural X Flavoring Revenue billion Forecast, by Type 2020 & 2033
- Table 6: Global Natural X Flavoring Revenue billion Forecast, by Country 2020 & 2033
- Table 7: United States Natural X Flavoring Revenue (billion) Forecast, by Application 2020 & 2033
- Table 8: Canada Natural X Flavoring Revenue (billion) Forecast, by Application 2020 & 2033
- Table 9: Mexico Natural X Flavoring Revenue (billion) Forecast, by Application 2020 & 2033
- Table 10: Global Natural X Flavoring Revenue billion Forecast, by Application 2020 & 2033
- Table 11: Global Natural X Flavoring Revenue billion Forecast, by Type 2020 & 2033
- Table 12: Global Natural X Flavoring Revenue billion Forecast, by Country 2020 & 2033
- Table 13: Brazil Natural X Flavoring Revenue (billion) Forecast, by Application 2020 & 2033
- Table 14: Argentina Natural X Flavoring Revenue (billion) Forecast, by Application 2020 & 2033
- Table 15: Rest of South America Natural X Flavoring Revenue (billion) Forecast, by Application 2020 & 2033
- Table 16: Global Natural X Flavoring Revenue billion Forecast, by Application 2020 & 2033
- Table 17: Global Natural X Flavoring Revenue billion Forecast, by Type 2020 & 2033
- Table 18: Global Natural X Flavoring Revenue billion Forecast, by Country 2020 & 2033
- Table 19: United Kingdom Natural X Flavoring Revenue (billion) Forecast, by Application 2020 & 2033
- Table 20: Germany Natural X Flavoring Revenue (billion) Forecast, by Application 2020 & 2033
- Table 21: France Natural X Flavoring Revenue (billion) Forecast, by Application 2020 & 2033
- Table 22: Italy Natural X Flavoring Revenue (billion) Forecast, by Application 2020 & 2033
- Table 23: Spain Natural X Flavoring Revenue (billion) Forecast, by Application 2020 & 2033
- Table 24: Russia Natural X Flavoring Revenue (billion) Forecast, by Application 2020 & 2033
- Table 25: Benelux Natural X Flavoring Revenue (billion) Forecast, by Application 2020 & 2033
- Table 26: Nordics Natural X Flavoring Revenue (billion) Forecast, by Application 2020 & 2033
- Table 27: Rest of Europe Natural X Flavoring Revenue (billion) Forecast, by Application 2020 & 2033
- Table 28: Global Natural X Flavoring Revenue billion Forecast, by Application 2020 & 2033
- Table 29: Global Natural X Flavoring Revenue billion Forecast, by Type 2020 & 2033
- Table 30: Global Natural X Flavoring Revenue billion Forecast, by Country 2020 & 2033
- Table 31: Turkey Natural X Flavoring Revenue (billion) Forecast, by Application 2020 & 2033
- Table 32: Israel Natural X Flavoring Revenue (billion) Forecast, by Application 2020 & 2033
- Table 33: GCC Natural X Flavoring Revenue (billion) Forecast, by Application 2020 & 2033
- Table 34: North Africa Natural X Flavoring Revenue (billion) Forecast, by Application 2020 & 2033
- Table 35: South Africa Natural X Flavoring Revenue (billion) Forecast, by Application 2020 & 2033
- Table 36: Rest of Middle East & Africa Natural X Flavoring Revenue (billion) Forecast, by Application 2020 & 2033
- Table 37: Global Natural X Flavoring Revenue billion Forecast, by Application 2020 & 2033
- Table 38: Global Natural X Flavoring Revenue billion Forecast, by Type 2020 & 2033
- Table 39: Global Natural X Flavoring Revenue billion Forecast, by Country 2020 & 2033
- Table 40: China Natural X Flavoring Revenue (billion) Forecast, by Application 2020 & 2033
- Table 41: India Natural X Flavoring Revenue (billion) Forecast, by Application 2020 & 2033
- Table 42: Japan Natural X Flavoring Revenue (billion) Forecast, by Application 2020 & 2033
- Table 43: South Korea Natural X Flavoring Revenue (billion) Forecast, by Application 2020 & 2033
- Table 44: ASEAN Natural X Flavoring Revenue (billion) Forecast, by Application 2020 & 2033
- Table 45: Oceania Natural X Flavoring Revenue (billion) Forecast, by Application 2020 & 2033
- Table 46: Rest of Asia Pacific Natural X Flavoring Revenue (billion) Forecast, by Application 2020 & 2033
Frequently Asked Questions
1. What is the projected Compound Annual Growth Rate (CAGR) of the Natural X Flavoring?
The projected CAGR is approximately 9.39%.
2. Which companies are prominent players in the Natural X Flavoring?
Key companies in the market include Symrise, Givaudan, Firmenich, Sensient Technologies, Takasago International Corporation, Synergy Flavors, International Flavors & Fragrances, Robertet Group, Bell Flavors & Fragrances, Blue Pacific Flavors.
3. What are the main segments of the Natural X Flavoring?
The market segments include Application, Type.
4. Can you provide details about the market size?
The market size is estimated to be USD 9.64 billion as of 2022.
5. What are some drivers contributing to market growth?
N/A
6. What are the notable trends driving market growth?
N/A
7. Are there any restraints impacting market growth?
N/A
8. Can you provide examples of recent developments in the market?
N/A
9. What pricing options are available for accessing the report?
Pricing options include single-user, multi-user, and enterprise licenses priced at USD 2900.00, USD 4350.00, and USD 5800.00 respectively.
10. Is the market size provided in terms of value or volume?
The market size is provided in terms of value, measured in billion.
11. Are there any specific market keywords associated with the report?
Yes, the market keyword associated with the report is "Natural X Flavoring," which aids in identifying and referencing the specific market segment covered.
12. How do I determine which pricing option suits my needs best?
The pricing options vary based on user requirements and access needs. Individual users may opt for single-user licenses, while businesses requiring broader access may choose multi-user or enterprise licenses for cost-effective access to the report.
13. Are there any additional resources or data provided in the Natural X Flavoring report?
While the report offers comprehensive insights, it's advisable to review the specific contents or supplementary materials provided to ascertain if additional resources or data are available.
14. How can I stay updated on further developments or reports in the Natural X Flavoring?
To stay informed about further developments, trends, and reports in the Natural X Flavoring, consider subscribing to industry newsletters, following relevant companies and organizations, or regularly checking reputable industry news sources and publications.
Methodology
Step 1 - Identification of Relevant Samples Size from Population Database


Step 2 - Approaches for Defining Global Market Size (Value, Volume* & Price*)

Note*: In applicable scenarios
Step 3 - Data Sources
Primary Research
- Web Analytics
- Survey Reports
- Research Institute
- Latest Research Reports
- Opinion Leaders
Secondary Research
- Annual Reports
- White Paper
- Latest Press Release
- Industry Association
- Paid Database
- Investor Presentations

Step 4 - Data Triangulation
Involves using different sources of information in order to increase the validity of a study
These sources are likely to be stakeholders in a program - participants, other researchers, program staff, other community members, and so on.
Then we put all data in single framework & apply various statistical tools to find out the dynamic on the market.
During the analysis stage, feedback from the stakeholder groups would be compared to determine areas of agreement as well as areas of divergence