

Key Insights
The Residential Battery Market is set for significant expansion, projected to grow from a base market size of $17.4 billion in 2025. This growth will be fueled by a Compound Annual Growth Rate (CAGR) of 10.9%. Key market drivers include the rising adoption of renewable energy, particularly solar power, which requires efficient battery storage for grid independence and optimized energy management. Additionally, escalating electricity costs, increased consumer focus on energy conservation, and the demand for reliable backup power solutions are accelerating market penetration. Technological advancements are also contributing, with improvements in battery performance, extended lifespans, and reduced costs making residential energy storage more accessible.
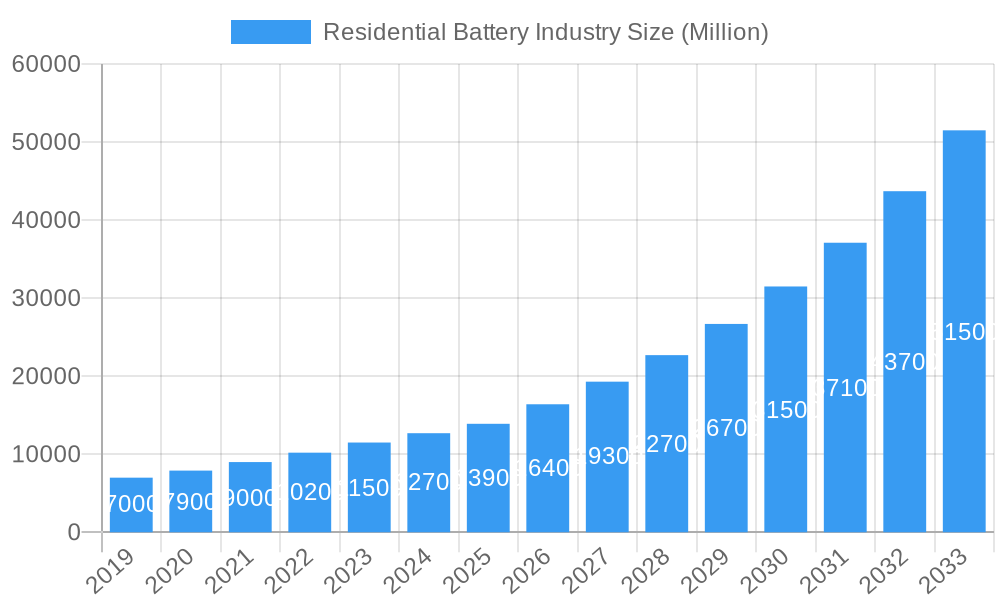
Residential Battery Industry Market Size (In Billion)
The market is characterized by diverse battery technologies, with Lithium-ion batteries leading due to their high energy density, efficiency, and durability. Lead-acid batteries remain relevant in specific cost-sensitive applications. Prominent global players, including BYD Co. Ltd., Samsung SDI Co. Ltd., LG Energy Solution Ltd., and Tesla Inc., alongside established companies such as Siemens AG and Delta Electronics Ltd., shape the competitive landscape. Regional growth is anticipated to be led by North America and Asia Pacific, supported by strong renewable energy policies and government incentives. Europe also offers substantial opportunities, driven by ambitious climate goals and growing consumer preference for sustainable energy solutions.
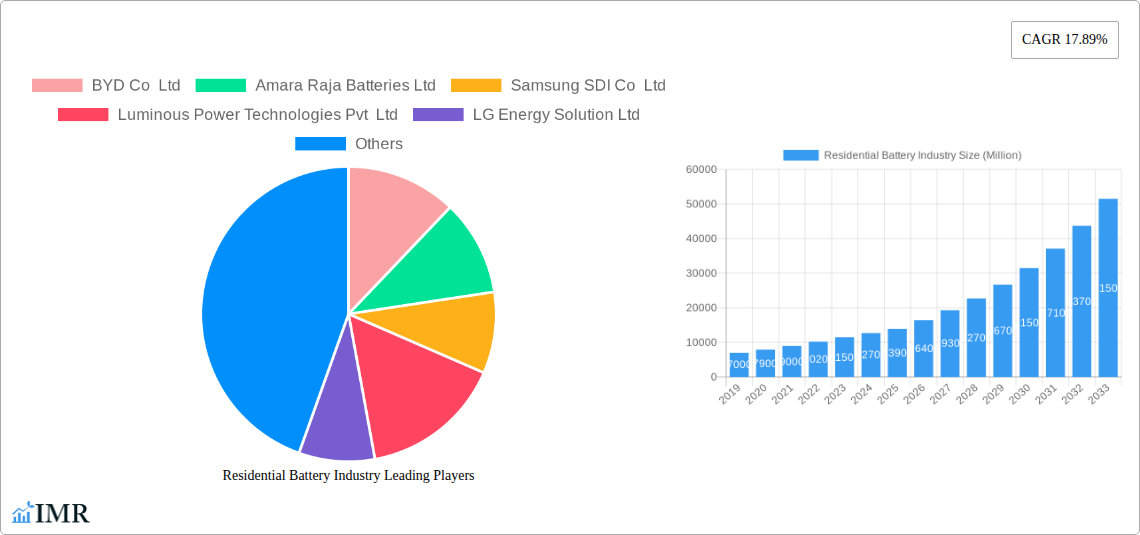
Residential Battery Industry Company Market Share
Residential Battery Industry Market Dynamics & Structure
The residential battery industry is characterized by a moderately concentrated market, with key players like BYD Co Ltd, Samsung SDI Co Ltd, and LG Energy Solution Ltd holding significant market share. Technological innovation, particularly in lithium-ion battery chemistries, remains a primary driver, pushing for higher energy density, faster charging, and enhanced safety. Regulatory frameworks, such as renewable energy incentives and grid modernization initiatives, play a crucial role in shaping market adoption. Competitive product substitutes, including traditional grid reliance and emerging energy storage solutions, present ongoing challenges. End-user demographics are shifting, with a growing interest from environmentally conscious homeowners, those in regions with unreliable grids, and individuals seeking to optimize solar energy self-consumption. Mergers and acquisitions (M&A) are becoming more prevalent as companies seek to expand their product portfolios, gain access to new technologies, and consolidate market presence. The M&A landscape saw approximately 5 significant deals in the historical period (2019-2024), indicating a trend towards consolidation. Innovation barriers, such as high upfront costs for advanced battery technologies and the need for robust charging infrastructure, continue to influence market penetration.
- Market Concentration: Dominated by a few large players, with an estimated combined market share of 65% in 2025.
- Technological Innovation Drivers: Advancements in lithium-ion battery technology (e.g., solid-state batteries) and cost reduction strategies.
- Regulatory Frameworks: Government subsidies for renewable energy integration, net metering policies, and grid-tied energy storage mandates.
- Competitive Product Substitutes: Grid power, other forms of backup power (e.g., generators), and thermal energy storage.
- End-User Demographics: Homeowners in areas with high electricity prices, frequent power outages, or strong environmental consciousness.
- M&A Trends: Strategic acquisitions to secure supply chains, acquire intellectual property, and expand geographical reach.
Residential Battery Industry Growth Trends & Insights
The residential battery industry is experiencing robust growth, projected to expand at a Compound Annual Growth Rate (CAGR) of 18.5% from 2025 to 2033. This upward trajectory is fueled by a confluence of factors, including declining battery costs, increasing awareness of energy independence, and the expanding integration of renewable energy sources like solar photovoltaics into homes. In the base year 2025, the global residential battery market is estimated to reach approximately 12,500 million units in capacity. The adoption rates are rapidly accelerating, driven by homeowners seeking to mitigate rising electricity prices and enhance their resilience against grid outages. Technological disruptions, such as improvements in battery management systems (BMS) and the development of more efficient inverters, are further enhancing the value proposition of residential battery storage. Consumer behavior is also shifting, with a growing preference for integrated home energy solutions that combine solar generation, battery storage, and smart home management. This shift is particularly evident in regions with favorable solar irradiance and supportive government policies. The market penetration of residential battery systems, while still relatively low in some regions, is projected to increase significantly over the forecast period, driven by decreasing total cost of ownership and increasing consumer education. The historical period (2019-2024) witnessed a CAGR of approximately 15.2%, setting a strong foundation for the accelerated growth anticipated in the coming years. Key market insights indicate that the average residential battery system size is increasing, reflecting a demand for greater energy storage capacity to support entire household loads and electric vehicle charging. Furthermore, the increasing demand for backup power solutions in the wake of extreme weather events is also a significant growth accelerator. The integration of smart grid functionalities and vehicle-to-grid (V2G) capabilities within residential battery systems is an emerging trend that promises to unlock new revenue streams and further incentivize adoption. The overall market size is expected to more than double from its 2025 estimate by the end of the forecast period in 2033, reaching an estimated capacity of over 28,000 million units.
Dominant Regions, Countries, or Segments in Residential Battery Industry
The Lithium-ion Battery segment is unequivocally the dominant force driving growth within the residential battery industry. In the base year 2025, this segment is estimated to account for over 90% of the global market volume, translating to approximately 11,250 million units of capacity. The continued dominance of lithium-ion batteries is attributed to their superior energy density, longer lifespan, and faster charging capabilities compared to lead-acid and other battery chemistries. This technological advantage makes them the preferred choice for homeowners seeking efficient and long-lasting energy storage solutions, particularly when paired with solar photovoltaic (PV) systems.
North America, particularly the United States, emerged as the leading region in 2025, driven by a combination of supportive government incentives, increasing electricity costs, and a growing awareness of energy independence. The market penetration in this region is estimated to be around 25% of the total global residential battery market capacity. Key drivers within North America include:
- Economic Policies: Federal tax credits (e.g., Investment Tax Credit for solar and storage) and state-level renewable energy mandates significantly reduce the upfront cost of residential battery installations.
- Infrastructure: The presence of a well-established residential solar installation industry and the increasing deployment of smart grid technologies facilitate the integration of battery storage.
- Consumer Behavior: A strong propensity among homeowners to invest in energy resilience and cost savings, especially in regions prone to grid instability or with high time-of-use electricity pricing.
Europe also represents a substantial and rapidly growing market, with Germany, Australia, and the United Kingdom leading the charge. The region's dominance is underpinned by:
- Environmental Regulations: Stringent climate change targets and policies promoting the decarbonization of the energy sector.
- Subsidies and Feed-in Tariffs: Generous financial support for solar PV and battery storage systems, making them economically attractive.
- Grid Modernization: Investments in smart grids and distributed energy resource management systems that enable seamless integration of residential batteries.
In terms of market share growth potential, Asia-Pacific is poised for significant expansion, particularly in countries like Australia, Japan, and South Korea. Factors contributing to this growth include:
- Rising Energy Demand: Increasing residential energy consumption due to population growth and a rising middle class.
- Reliability Concerns: A need for reliable power supply in areas experiencing grid instability or frequent outages.
- Government Support: Growing government initiatives to promote renewable energy and energy storage solutions.
The Lithium-ion Battery segment's dominance is further reinforced by ongoing research and development efforts focused on improving performance, safety, and cost-effectiveness, including advancements in chemistries like Lithium Iron Phosphate (LFP) and the exploration of solid-state battery technologies for future residential applications.
Residential Battery Industry Product Landscape
The residential battery industry's product landscape is defined by continuous innovation in lithium-ion battery technologies, primarily focusing on enhancing energy density, cycle life, and safety. Products range from compact, modular systems designed for single-family homes to larger, scalable solutions for multi-unit dwellings. Key applications include solar self-consumption optimization, backup power during grid outages, and participation in grid services through demand response programs. Notable product advancements include the integration of advanced battery management systems (BMS) for optimal performance and longevity, as well as the development of aesthetically pleasing, indoor-friendly designs. Samsung SDI Co Ltd, LG Energy Solution Ltd, and Tesla Inc are at the forefront of introducing high-performance battery packs with extended warranties, often exceeding 10 years.
Key Drivers, Barriers & Challenges in Residential Battery Industry
Key Drivers:
- Declining Battery Costs: Reductions in lithium-ion battery manufacturing costs, driven by economies of scale and technological advancements, are making residential battery systems more financially accessible.
- Renewable Energy Integration: The widespread adoption of rooftop solar PV systems is creating a strong demand for energy storage to maximize self-consumption and grid independence.
- Grid Reliability Concerns: Increasing frequency and severity of power outages due to extreme weather events are driving demand for backup power solutions.
- Government Incentives and Policies: Subsidies, tax credits, and favorable net-metering policies in various regions significantly improve the economic viability of residential battery installations.
Barriers & Challenges:
- High Upfront Costs: Despite declining prices, the initial investment for a residential battery system remains a significant barrier for many households.
- Installation Complexity and Permitting: The process of installing battery systems can be complex, involving specialized electrical work and navigating local permitting requirements.
- Supply Chain Volatility: Dependence on raw materials like lithium and cobalt can lead to supply chain disruptions and price fluctuations.
- Consumer Education and Awareness: A lack of widespread understanding regarding the benefits and operation of residential battery systems can hinder adoption.
- Interoperability and Standardization: Ensuring seamless integration with existing home energy systems and adherence to evolving grid interconnection standards presents ongoing challenges.
Emerging Opportunities in Residential Battery Industry
Emerging opportunities in the residential battery industry are centered around the increasing demand for integrated home energy management systems. This includes the development of smart battery solutions that can dynamically manage energy flow from solar panels, the grid, and electric vehicles. The growth of the electric vehicle (EV) market presents a significant opportunity for vehicle-to-grid (V2G) and vehicle-to-home (V2H) capabilities, allowing homeowners to utilize their EV batteries for home energy storage. Furthermore, untapped markets in developing regions with unreliable power grids and growing renewable energy penetration represent substantial growth potential. The development of more sustainable battery chemistries and improved recycling processes also offers an opportunity to address environmental concerns and enhance the long-term appeal of the technology.
Growth Accelerators in the Residential Battery Industry Industry
The long-term growth of the residential battery industry is being accelerated by several key factors. Technological breakthroughs in battery chemistries, such as the advancement of solid-state batteries offering higher energy density and improved safety, are poised to revolutionize the market. Strategic partnerships between battery manufacturers, solar installers, and utility companies are creating more comprehensive and accessible energy solutions for homeowners. Market expansion strategies, including innovative financing models and subscription-based services, are lowering the barrier to entry and making battery storage more affordable. Furthermore, the increasing integration of AI and machine learning in battery management systems to optimize performance and predict maintenance needs will further enhance the value proposition and drive wider adoption.
Key Players Shaping the Residential Battery Industry Market
- BYD Co Ltd
- Amara Raja Batteries Ltd
- Samsung SDI Co Ltd
- Luminous Power Technologies Pvt Ltd
- LG Energy Solution Ltd
- FIMER SpA
- Siemens AG
- Tesla Inc
- Delta Electronics Ltd
- NEC Corporation
- Energizer Holding Inc
- Duracell Inc
- Panasonic Corporation
Notable Milestones in Residential Battery Industry Sector
- 2019: Tesla Inc. launches Powerwall 2 with enhanced capacity and integration capabilities, driving consumer interest.
- 2020: LG Energy Solution Ltd. introduces advanced battery modules with improved safety features for residential applications.
- 2021: BYD Co Ltd. expands its energy storage solutions portfolio with new residential battery systems.
- 2022: Amara Raja Batteries Ltd. announces significant investment in lithium-ion battery technology research and development.
- 2023: Samsung SDI Co Ltd. unveils next-generation battery technologies promising higher energy density and longer lifespan.
- 2024 (Q1): Luminous Power Technologies Pvt Ltd. partners with a leading solar installer to offer bundled solar and battery solutions.
In-Depth Residential Battery Industry Market Outlook
The future outlook for the residential battery industry is exceptionally strong, driven by an unwavering demand for clean, reliable, and cost-effective energy solutions. Growth accelerators such as continuous technological advancements in battery chemistry, leading to higher performance and lower costs, will be pivotal. Strategic alliances and collaborations among key industry players, including battery manufacturers, solar installers, and utility providers, will foster market expansion and create more integrated home energy ecosystems. The increasing focus on sustainability and the circular economy will also drive innovation in battery recycling and the development of more environmentally friendly materials. As regulatory landscapes continue to evolve favorably and consumer awareness grows, the residential battery market is poised for substantial growth, creating significant opportunities for innovation and investment.
Residential Battery Industry Segmentation
-
1. Type
- 1.1. Lithium-ion Battery
- 1.2. Lead-acid Battery
- 1.3. Others Types
Residential Battery Industry Segmentation By Geography
- 1. North America
- 2. Asia Pacific
- 3. Europe
- 4. South America
- 5. Middle East and Africa
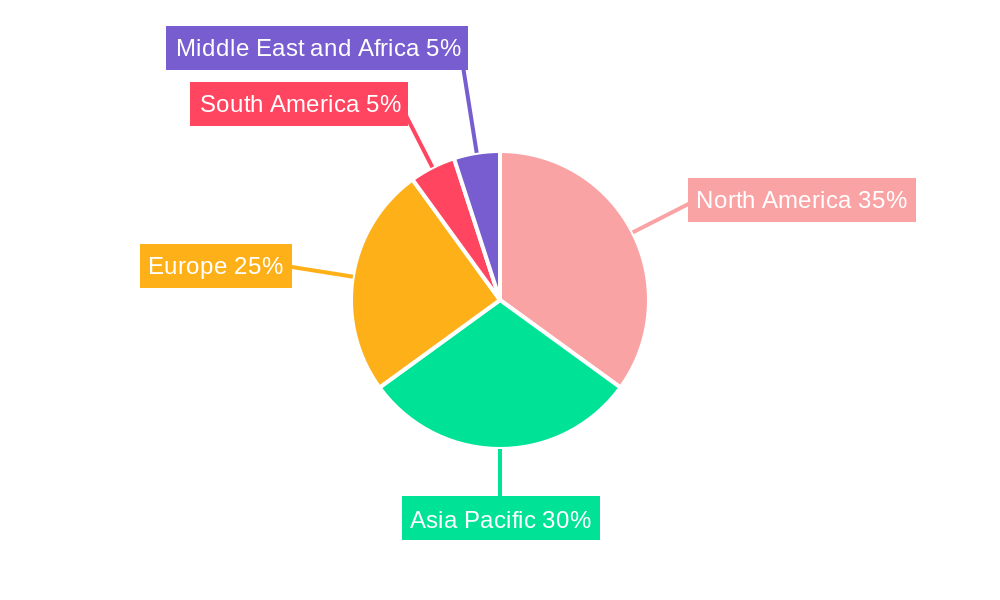
Residential Battery Industry Regional Market Share
Geographic Coverage of Residential Battery Industry
Residential Battery Industry REPORT HIGHLIGHTS
| Aspects | Details |
|---|---|
| Study Period | 2020-2034 |
| Base Year | 2025 |
| Estimated Year | 2026 |
| Forecast Period | 2026-2034 |
| Historical Period | 2020-2025 |
| Growth Rate | CAGR of 10.9% from 2020-2034 |
| Segmentation |
|
Table of Contents
- 1. Introduction
- 1.1. Research Scope
- 1.2. Market Segmentation
- 1.3. Research Objective
- 1.4. Definitions and Assumptions
- 2. Executive Summary
- 2.1. Market Snapshot
- 3. Market Dynamics
- 3.1. Market Drivers
- 3.2. Market Restrains
- 3.3. Market Trends
- 3.4. Market Opportunities
- 4. Market Factor Analysis
- 4.1. Porters Five Forces
- 4.1.1. Bargaining Power of Suppliers
- 4.1.2. Bargaining Power of Buyers
- 4.1.3. Threat of New Entrants
- 4.1.4. Threat of Substitutes
- 4.1.5. Competitive Rivalry
- 4.2. PESTEL analysis
- 4.3. BCG Analysis
- 4.3.1. Stars (High Growth, High Market Share)
- 4.3.2. Cash Cows (Low Growth, High Market Share)
- 4.3.3. Question Mark (High Growth, Low Market Share)
- 4.3.4. Dogs (Low Growth, Low Market Share)
- 4.4. Ansoff Matrix Analysis
- 4.5. Supply Chain Analysis
- 4.6. Regulatory Landscape
- 4.7. Current Market Potential and Opportunity Assessment (TAM–SAM–SOM Framework)
- 4.8. IMR Analyst Note
- 4.1. Porters Five Forces
- 5. Market Analysis, Insights and Forecast 2021-2033
- 5.1. Market Analysis, Insights and Forecast - by Type
- 5.1.1. Lithium-ion Battery
- 5.1.2. Lead-acid Battery
- 5.1.3. Others Types
- 5.2. Market Analysis, Insights and Forecast - by Region
- 5.2.1. North America
- 5.2.2. Asia Pacific
- 5.2.3. Europe
- 5.2.4. South America
- 5.2.5. Middle East and Africa
- 5.1. Market Analysis, Insights and Forecast - by Type
- 6. Global Residential Battery Industry Analysis, Insights and Forecast, 2021-2033
- 6.1. Market Analysis, Insights and Forecast - by Type
- 6.1.1. Lithium-ion Battery
- 6.1.2. Lead-acid Battery
- 6.1.3. Others Types
- 6.1. Market Analysis, Insights and Forecast - by Type
- 7. North America Residential Battery Industry Analysis, Insights and Forecast, 2020-2032
- 7.1. Market Analysis, Insights and Forecast - by Type
- 7.1.1. Lithium-ion Battery
- 7.1.2. Lead-acid Battery
- 7.1.3. Others Types
- 7.1. Market Analysis, Insights and Forecast - by Type
- 8. Asia Pacific Residential Battery Industry Analysis, Insights and Forecast, 2020-2032
- 8.1. Market Analysis, Insights and Forecast - by Type
- 8.1.1. Lithium-ion Battery
- 8.1.2. Lead-acid Battery
- 8.1.3. Others Types
- 8.1. Market Analysis, Insights and Forecast - by Type
- 9. Europe Residential Battery Industry Analysis, Insights and Forecast, 2020-2032
- 9.1. Market Analysis, Insights and Forecast - by Type
- 9.1.1. Lithium-ion Battery
- 9.1.2. Lead-acid Battery
- 9.1.3. Others Types
- 9.1. Market Analysis, Insights and Forecast - by Type
- 10. South America Residential Battery Industry Analysis, Insights and Forecast, 2020-2032
- 10.1. Market Analysis, Insights and Forecast - by Type
- 10.1.1. Lithium-ion Battery
- 10.1.2. Lead-acid Battery
- 10.1.3. Others Types
- 10.1. Market Analysis, Insights and Forecast - by Type
- 11. Middle East and Africa Residential Battery Industry Analysis, Insights and Forecast, 2020-2032
- 11.1. Market Analysis, Insights and Forecast - by Type
- 11.1.1. Lithium-ion Battery
- 11.1.2. Lead-acid Battery
- 11.1.3. Others Types
- 11.1. Market Analysis, Insights and Forecast - by Type
- 12. Competitive Analysis
- 12.1. Company Profiles
- 12.1.1 BYD Co Ltd
- 12.1.1.1. Company Overview
- 12.1.1.2. Products
- 12.1.1.3. Company Financials
- 12.1.1.4. SWOT Analysis
- 12.1.2 Amara Raja Batteries Ltd
- 12.1.2.1. Company Overview
- 12.1.2.2. Products
- 12.1.2.3. Company Financials
- 12.1.2.4. SWOT Analysis
- 12.1.3 Samsung SDI Co Ltd
- 12.1.3.1. Company Overview
- 12.1.3.2. Products
- 12.1.3.3. Company Financials
- 12.1.3.4. SWOT Analysis
- 12.1.4 Luminous Power Technologies Pvt Ltd
- 12.1.4.1. Company Overview
- 12.1.4.2. Products
- 12.1.4.3. Company Financials
- 12.1.4.4. SWOT Analysis
- 12.1.5 LG Energy Solution Ltd
- 12.1.5.1. Company Overview
- 12.1.5.2. Products
- 12.1.5.3. Company Financials
- 12.1.5.4. SWOT Analysis
- 12.1.6 FIMER SpA
- 12.1.6.1. Company Overview
- 12.1.6.2. Products
- 12.1.6.3. Company Financials
- 12.1.6.4. SWOT Analysis
- 12.1.7 Siemens AG
- 12.1.7.1. Company Overview
- 12.1.7.2. Products
- 12.1.7.3. Company Financials
- 12.1.7.4. SWOT Analysis
- 12.1.8 Tesla Inc
- 12.1.8.1. Company Overview
- 12.1.8.2. Products
- 12.1.8.3. Company Financials
- 12.1.8.4. SWOT Analysis
- 12.1.9 Delta Electronics Ltd
- 12.1.9.1. Company Overview
- 12.1.9.2. Products
- 12.1.9.3. Company Financials
- 12.1.9.4. SWOT Analysis
- 12.1.10 NEC Corporation
- 12.1.10.1. Company Overview
- 12.1.10.2. Products
- 12.1.10.3. Company Financials
- 12.1.10.4. SWOT Analysis
- 12.1.11 Energizer Holding Inc
- 12.1.11.1. Company Overview
- 12.1.11.2. Products
- 12.1.11.3. Company Financials
- 12.1.11.4. SWOT Analysis
- 12.1.12 Duracell Inc
- 12.1.12.1. Company Overview
- 12.1.12.2. Products
- 12.1.12.3. Company Financials
- 12.1.12.4. SWOT Analysis
- 12.1.13 Panasonic Corporation
- 12.1.13.1. Company Overview
- 12.1.13.2. Products
- 12.1.13.3. Company Financials
- 12.1.13.4. SWOT Analysis
- 12.1.1 BYD Co Ltd
- 12.2. Market Entropy
- 12.2.1 Company's Key Areas Served
- 12.2.2 Recent Developments
- 12.3. Company Market Share Analysis 2025
- 12.3.1 Top 5 Companies Market Share Analysis
- 12.3.2 Top 3 Companies Market Share Analysis
- 12.4. List of Potential Customers
- 13. Research Methodology
List of Figures
- Figure 1: Global Residential Battery Industry Revenue Breakdown (billion, %) by Region 2025 & 2033
- Figure 2: Global Residential Battery Industry Volume Breakdown (K Tons, %) by Region 2025 & 2033
- Figure 3: North America Residential Battery Industry Revenue (billion), by Type 2025 & 2033
- Figure 4: North America Residential Battery Industry Volume (K Tons), by Type 2025 & 2033
- Figure 5: North America Residential Battery Industry Revenue Share (%), by Type 2025 & 2033
- Figure 6: North America Residential Battery Industry Volume Share (%), by Type 2025 & 2033
- Figure 7: North America Residential Battery Industry Revenue (billion), by Country 2025 & 2033
- Figure 8: North America Residential Battery Industry Volume (K Tons), by Country 2025 & 2033
- Figure 9: North America Residential Battery Industry Revenue Share (%), by Country 2025 & 2033
- Figure 10: North America Residential Battery Industry Volume Share (%), by Country 2025 & 2033
- Figure 11: Asia Pacific Residential Battery Industry Revenue (billion), by Type 2025 & 2033
- Figure 12: Asia Pacific Residential Battery Industry Volume (K Tons), by Type 2025 & 2033
- Figure 13: Asia Pacific Residential Battery Industry Revenue Share (%), by Type 2025 & 2033
- Figure 14: Asia Pacific Residential Battery Industry Volume Share (%), by Type 2025 & 2033
- Figure 15: Asia Pacific Residential Battery Industry Revenue (billion), by Country 2025 & 2033
- Figure 16: Asia Pacific Residential Battery Industry Volume (K Tons), by Country 2025 & 2033
- Figure 17: Asia Pacific Residential Battery Industry Revenue Share (%), by Country 2025 & 2033
- Figure 18: Asia Pacific Residential Battery Industry Volume Share (%), by Country 2025 & 2033
- Figure 19: Europe Residential Battery Industry Revenue (billion), by Type 2025 & 2033
- Figure 20: Europe Residential Battery Industry Volume (K Tons), by Type 2025 & 2033
- Figure 21: Europe Residential Battery Industry Revenue Share (%), by Type 2025 & 2033
- Figure 22: Europe Residential Battery Industry Volume Share (%), by Type 2025 & 2033
- Figure 23: Europe Residential Battery Industry Revenue (billion), by Country 2025 & 2033
- Figure 24: Europe Residential Battery Industry Volume (K Tons), by Country 2025 & 2033
- Figure 25: Europe Residential Battery Industry Revenue Share (%), by Country 2025 & 2033
- Figure 26: Europe Residential Battery Industry Volume Share (%), by Country 2025 & 2033
- Figure 27: South America Residential Battery Industry Revenue (billion), by Type 2025 & 2033
- Figure 28: South America Residential Battery Industry Volume (K Tons), by Type 2025 & 2033
- Figure 29: South America Residential Battery Industry Revenue Share (%), by Type 2025 & 2033
- Figure 30: South America Residential Battery Industry Volume Share (%), by Type 2025 & 2033
- Figure 31: South America Residential Battery Industry Revenue (billion), by Country 2025 & 2033
- Figure 32: South America Residential Battery Industry Volume (K Tons), by Country 2025 & 2033
- Figure 33: South America Residential Battery Industry Revenue Share (%), by Country 2025 & 2033
- Figure 34: South America Residential Battery Industry Volume Share (%), by Country 2025 & 2033
- Figure 35: Middle East and Africa Residential Battery Industry Revenue (billion), by Type 2025 & 2033
- Figure 36: Middle East and Africa Residential Battery Industry Volume (K Tons), by Type 2025 & 2033
- Figure 37: Middle East and Africa Residential Battery Industry Revenue Share (%), by Type 2025 & 2033
- Figure 38: Middle East and Africa Residential Battery Industry Volume Share (%), by Type 2025 & 2033
- Figure 39: Middle East and Africa Residential Battery Industry Revenue (billion), by Country 2025 & 2033
- Figure 40: Middle East and Africa Residential Battery Industry Volume (K Tons), by Country 2025 & 2033
- Figure 41: Middle East and Africa Residential Battery Industry Revenue Share (%), by Country 2025 & 2033
- Figure 42: Middle East and Africa Residential Battery Industry Volume Share (%), by Country 2025 & 2033
List of Tables
- Table 1: Global Residential Battery Industry Revenue billion Forecast, by Type 2020 & 2033
- Table 2: Global Residential Battery Industry Volume K Tons Forecast, by Type 2020 & 2033
- Table 3: Global Residential Battery Industry Revenue billion Forecast, by Region 2020 & 2033
- Table 4: Global Residential Battery Industry Volume K Tons Forecast, by Region 2020 & 2033
- Table 5: Global Residential Battery Industry Revenue billion Forecast, by Type 2020 & 2033
- Table 6: Global Residential Battery Industry Volume K Tons Forecast, by Type 2020 & 2033
- Table 7: Global Residential Battery Industry Revenue billion Forecast, by Country 2020 & 2033
- Table 8: Global Residential Battery Industry Volume K Tons Forecast, by Country 2020 & 2033
- Table 9: Global Residential Battery Industry Revenue billion Forecast, by Type 2020 & 2033
- Table 10: Global Residential Battery Industry Volume K Tons Forecast, by Type 2020 & 2033
- Table 11: Global Residential Battery Industry Revenue billion Forecast, by Country 2020 & 2033
- Table 12: Global Residential Battery Industry Volume K Tons Forecast, by Country 2020 & 2033
- Table 13: Global Residential Battery Industry Revenue billion Forecast, by Type 2020 & 2033
- Table 14: Global Residential Battery Industry Volume K Tons Forecast, by Type 2020 & 2033
- Table 15: Global Residential Battery Industry Revenue billion Forecast, by Country 2020 & 2033
- Table 16: Global Residential Battery Industry Volume K Tons Forecast, by Country 2020 & 2033
- Table 17: Global Residential Battery Industry Revenue billion Forecast, by Type 2020 & 2033
- Table 18: Global Residential Battery Industry Volume K Tons Forecast, by Type 2020 & 2033
- Table 19: Global Residential Battery Industry Revenue billion Forecast, by Country 2020 & 2033
- Table 20: Global Residential Battery Industry Volume K Tons Forecast, by Country 2020 & 2033
- Table 21: Global Residential Battery Industry Revenue billion Forecast, by Type 2020 & 2033
- Table 22: Global Residential Battery Industry Volume K Tons Forecast, by Type 2020 & 2033
- Table 23: Global Residential Battery Industry Revenue billion Forecast, by Country 2020 & 2033
- Table 24: Global Residential Battery Industry Volume K Tons Forecast, by Country 2020 & 2033
Frequently Asked Questions
1. What is the projected Compound Annual Growth Rate (CAGR) of the Residential Battery Industry?
The projected CAGR is approximately 10.9%.
2. Which companies are prominent players in the Residential Battery Industry?
Key companies in the market include BYD Co Ltd, Amara Raja Batteries Ltd, Samsung SDI Co Ltd, Luminous Power Technologies Pvt Ltd, LG Energy Solution Ltd, FIMER SpA, Siemens AG, Tesla Inc, Delta Electronics Ltd, NEC Corporation, Energizer Holding Inc, Duracell Inc, Panasonic Corporation.
3. What are the main segments of the Residential Battery Industry?
The market segments include Type.
4. Can you provide details about the market size?
The market size is estimated to be USD 17.4 billion as of 2022.
5. What are some drivers contributing to market growth?
4.; Increasing Investments in Water Treatment by Developing Countries4.; Growing Demand for the Various End-Use Sectors.
6. What are the notable trends driving market growth?
Lithium-ion Battery Segment Expected to Dominate the Market.
7. Are there any restraints impacting market growth?
4.; Availability of Cheap and Alternative Pumps.
8. Can you provide examples of recent developments in the market?
N/A
9. What pricing options are available for accessing the report?
Pricing options include single-user, multi-user, and enterprise licenses priced at USD 4750, USD 5250, and USD 8750 respectively.
10. Is the market size provided in terms of value or volume?
The market size is provided in terms of value, measured in billion and volume, measured in K Tons.
11. Are there any specific market keywords associated with the report?
Yes, the market keyword associated with the report is "Residential Battery Industry," which aids in identifying and referencing the specific market segment covered.
12. How do I determine which pricing option suits my needs best?
The pricing options vary based on user requirements and access needs. Individual users may opt for single-user licenses, while businesses requiring broader access may choose multi-user or enterprise licenses for cost-effective access to the report.
13. Are there any additional resources or data provided in the Residential Battery Industry report?
While the report offers comprehensive insights, it's advisable to review the specific contents or supplementary materials provided to ascertain if additional resources or data are available.
14. How can I stay updated on further developments or reports in the Residential Battery Industry?
To stay informed about further developments, trends, and reports in the Residential Battery Industry, consider subscribing to industry newsletters, following relevant companies and organizations, or regularly checking reputable industry news sources and publications.
Methodology
Step 1 - Identification of Relevant Samples Size from Population Database


Step 2 - Approaches for Defining Global Market Size (Value, Volume* & Price*)

Note*: In applicable scenarios
Step 3 - Data Sources
Primary Research
- Web Analytics
- Survey Reports
- Research Institute
- Latest Research Reports
- Opinion Leaders
Secondary Research
- Annual Reports
- White Paper
- Latest Press Release
- Industry Association
- Paid Database
- Investor Presentations

Step 4 - Data Triangulation
Involves using different sources of information in order to increase the validity of a study
These sources are likely to be stakeholders in a program - participants, other researchers, program staff, other community members, and so on.
Then we put all data in single framework & apply various statistical tools to find out the dynamic on the market.
During the analysis stage, feedback from the stakeholder groups would be compared to determine areas of agreement as well as areas of divergence