

Key Insights
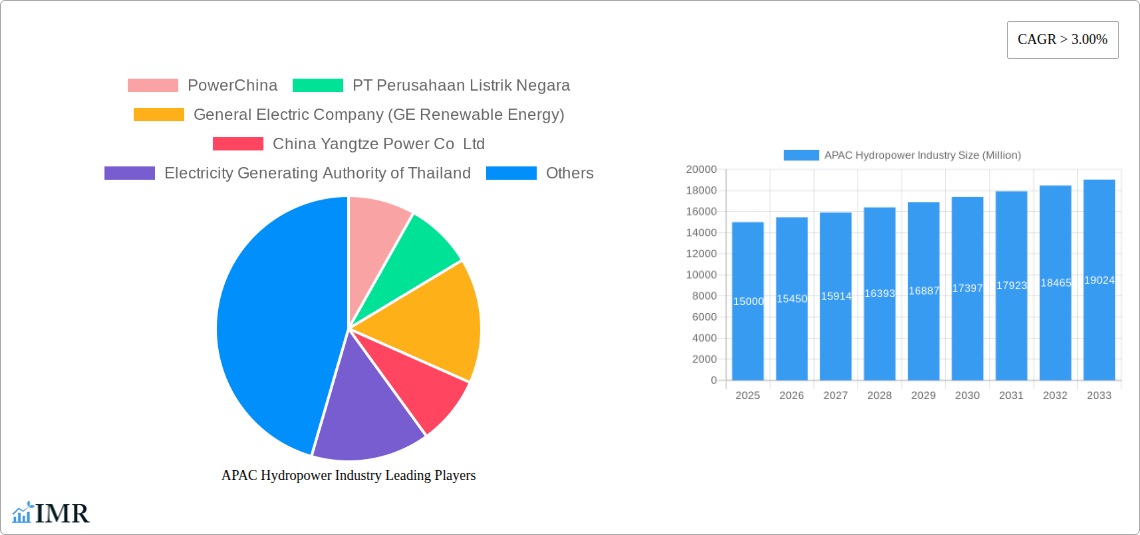
The Asia-Pacific (APAC) hydropower market is projected to experience substantial growth, driven by increasing energy demand and supportive government initiatives. With a current market size of $98.5 billion in the base year 2023, the sector is anticipated to expand at a Compound Annual Growth Rate (CAGR) of 12.1% from 2023 to 2033. Key factors propelling this expansion include the escalating need for clean and sustainable energy sources in rapidly developing economies such as China, India, and Southeast Asia. Hydropower's established infrastructure and low carbon footprint position it as a critical solution. Furthermore, favorable government policies, financial incentives, and streamlined regulations are accelerating project development. Technological advancements in turbine design and energy storage are enhancing efficiency and attractiveness. Despite these advantages, the market faces challenges including environmental concerns associated with dam construction and geographical limitations for large-scale projects. Strategic diversification, encompassing both large and small-scale hydropower, is essential for mitigating environmental impacts and maximizing energy production. Leading companies such as PowerChina, PT Perusahaan Listrik Negara, and General Electric are instrumental in shaping the market through project development, technology provision, and operational expertise.
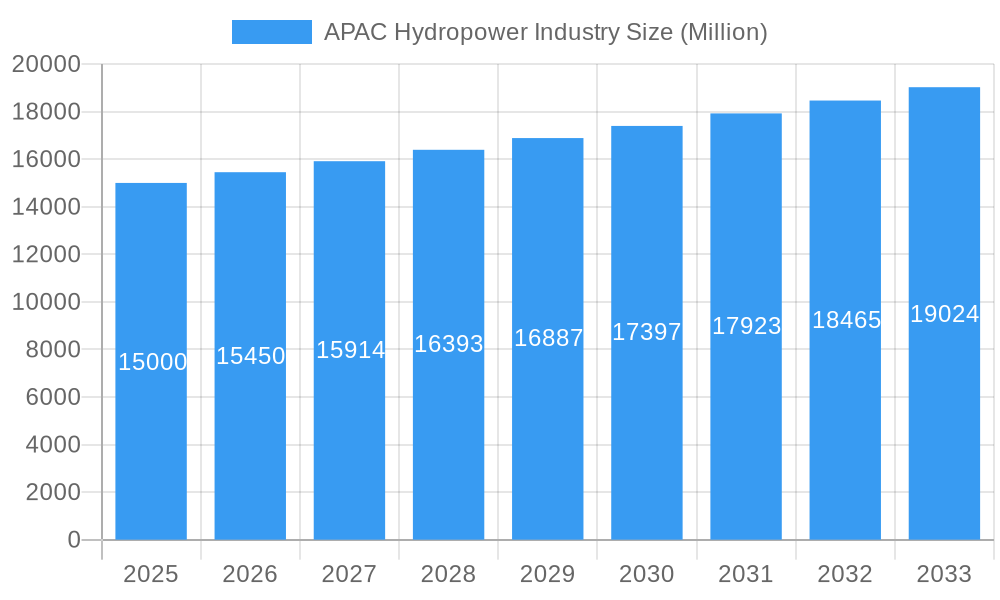
APAC Hydropower Industry Market Size (In Billion)
The forecast period (2023-2033) anticipates significant market expansion fueled by continuous energy consumption growth in major APAC economies, with China, India, and Southeast Asia leading the trend. Government support for renewables, technological advancements improving efficiency and cost-effectiveness, and a growing emphasis on energy security will further stimulate this growth. The sector will continue to address environmental impact assessments and regulatory hurdles. The integration of smaller hydropower projects alongside larger ones will be vital for sustainable and balanced growth. The competitive landscape will remain dynamic, fostering innovation and continued development within the APAC hydropower sector.
APAC Hydropower Industry Company Market Share
APAC Hydropower Industry Market Report: 2019-2033
This comprehensive report provides a detailed analysis of the Asia-Pacific (APAC) hydropower industry, encompassing market dynamics, growth trends, key players, and future outlook. With a focus on both large and small hydropower segments, this report is an essential resource for industry professionals, investors, and policymakers seeking to navigate this dynamic sector. The study period covers 2019-2033, with 2025 as the base and estimated year.
Study Period: 2019–2033 Base Year: 2025 Estimated Year: 2025 Forecast Period: 2025–2033 Historical Period: 2019–2024
APAC Hydropower Industry Market Dynamics & Structure
The APAC hydropower market is characterized by a complex interplay of factors impacting its structure and growth trajectory. Market concentration varies significantly across countries, with some dominated by state-owned enterprises while others exhibit a more fragmented landscape. Technological advancements, particularly in turbine design and grid integration, are key innovation drivers, alongside government policies promoting renewable energy. However, regulatory hurdles, environmental concerns, and the availability of competing energy sources (e.g., solar, wind) present significant challenges. Mergers and acquisitions (M&A) activity is increasing, as larger players consolidate their positions and seek to expand their geographical reach.
- Market Concentration: xx% of the market is controlled by the top 5 players in 2025. This concentration is expected to increase slightly by 2033.
- Technological Innovation: Focus on improving turbine efficiency, smart grid integration, and reducing environmental impact (e.g., fish-friendly turbines).
- Regulatory Framework: Varied across APAC countries, with some regions offering strong incentives for hydropower development while others face stricter environmental regulations.
- Competitive Substitutes: Solar, wind, and natural gas power generation pose significant competition.
- End-User Demographics: Primarily electricity generation companies (GenCos), industrial users, and residential consumers.
- M&A Trends: An estimated xx M&A deals occurred between 2019-2024, with an expected increase to xx deals during 2025-2033. This reflects consolidation efforts within the industry.
APAC Hydropower Industry Growth Trends & Insights
The APAC hydropower market experienced significant growth during the historical period (2019-2024), driven by increasing energy demand, government support for renewable energy, and ongoing investments in infrastructure development. The market size is projected to grow at a Compound Annual Growth Rate (CAGR) of xx% from 2025 to 2033, reaching a value of xx Million by 2033. This growth is fueled by several key factors, including the rising adoption of hydropower as a clean energy source, technological advancements that enhance efficiency and reduce costs, and supportive government policies designed to promote renewable energy targets. However, challenges such as environmental concerns and the availability of alternative renewable energy sources might temper growth in certain sub-regions. Consumer behavior shifts towards sustainability are creating a favorable market environment for hydropower.
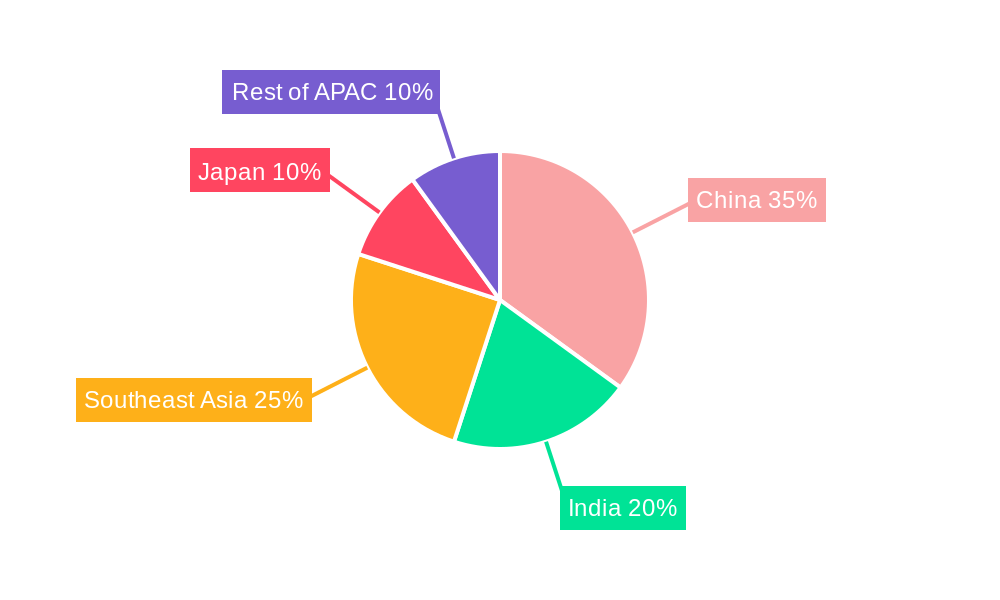
Dominant Regions, Countries, or Segments in APAC Hydropower Industry
China, India, and Southeast Asian nations are leading the APAC hydropower market, driven by substantial investments in large-scale hydropower projects and supportive government policies. Large hydropower projects dominate the market share, but small hydropower is experiencing increased adoption in remote areas with limited grid access.
- China: Largest market share, driven by significant government investment and technological advancements.
- India: High growth potential fueled by rising energy demand and ongoing infrastructure development.
- Southeast Asia: Rapid growth in countries like Vietnam, Indonesia, and the Philippines, driven by increasing renewable energy targets.
- Segment Dominance: Large hydropower projects constitute the largest segment (xx Million in 2025), followed by small hydropower (xx Million in 2025) and other sizes (xx Million in 2025). Small hydropower is expected to experience faster growth during the forecast period.
Key drivers include:
- Government Policies: Incentives, subsidies, and supportive regulations promoting renewable energy adoption.
- Infrastructure Development: Investments in transmission lines and grid infrastructure facilitate hydropower integration.
- Economic Growth: Rising energy demand stimulates investments in new hydropower capacity.
APAC Hydropower Industry Product Landscape
The APAC hydropower industry is characterized by a diverse range of products, including turbines, generators, and related equipment. Recent innovations focus on enhancing efficiency, reducing environmental impact, and improving grid integration capabilities. Manufacturers are increasingly emphasizing features such as higher energy conversion efficiency, reduced maintenance requirements, and improved durability to meet the demands of the market. Technological advancements, such as the use of advanced materials and digital control systems, are driving product innovation and enhancing overall system performance.
Key Drivers, Barriers & Challenges in APAC Hydropower Industry
Key Drivers:
- Growing energy demand: Fueled by rapid economic growth and population increase across the APAC region.
- Government support for renewable energy: Policies and incentives promoting hydropower development.
- Technological advancements: Improving efficiency and reducing costs of hydropower systems.
Key Challenges:
- Environmental concerns: Impact on ecosystems, biodiversity, and water resources.
- High capital costs: Significant upfront investments required for large-scale projects.
- Regulatory hurdles and permitting delays: Complex approval processes and bureaucratic bottlenecks can hinder project development.
- Competition from other renewable energy sources: Solar and wind power are becoming increasingly cost-competitive.
Emerging Opportunities in APAP Hydropower Industry
- Small hydropower development: Significant potential in rural and remote areas with limited grid access.
- Pumped hydro storage: Addressing grid stability concerns and enabling better integration of intermittent renewable energy sources.
- Hybrid hydropower projects: Combining hydropower with other renewable energy technologies (e.g., solar, wind) to create diversified energy systems.
Growth Accelerators in the APAC Hydropower Industry
Technological advancements, such as the development of more efficient turbines and improved grid integration technologies, are playing a crucial role in accelerating growth. Strategic partnerships between developers, manufacturers, and investors are facilitating project financing and deployment. Government initiatives to streamline permitting processes and provide financial incentives further enhance market expansion.
Key Players Shaping the APAC Hydropower Industry Market
- PowerChina
- PT Perusahaan Listrik Negara
- General Electric Company (GE Renewable Energy)
- China Yangtze Power Co Ltd
- Electricity Generating Authority of Thailand
- Aboitiz Power Corporation
- NTPC Limited
- NHPC Ltd
- Tenaga Nasional Berhad
- Tokyo Electric Power Company Holdings Inc
Notable Milestones in APAC Hydropower Industry Sector
- July 2022: The Development Bank of the Philippines (DBP) approved USD 11.7 million in funding for the 4.6 MW Dupinga Mini Hydropower project.
- March 2022: ANDRITZ and the Electricity Generating Authority of Thailand (EGAT) signed a MoU to explore hydropower project opportunities.
In-Depth APAC Hydropower Industry Market Outlook
The APAC hydropower industry is poised for continued growth, driven by strong government support, increasing energy demand, and technological advancements. Strategic investments in new projects, coupled with ongoing efforts to improve efficiency and reduce environmental impacts, will shape the market landscape in the coming years. Opportunities exist in developing small hydropower projects, exploring pumped hydro storage solutions, and integrating hydropower with other renewable energy sources. The market is expected to witness significant consolidation, with larger players acquiring smaller companies to expand their market share and diversify their portfolio.
APAC Hydropower Industry Segmentation
-
1. Size
- 1.1. Large Hydropower
- 1.2. Small Hydropower
- 1.3. Other Sizes
-
2. Geography
- 2.1. China
- 2.2. India
- 2.3. Japan
- 2.4. Vietnam
- 2.5. Rest of Asia-Pacific
APAC Hydropower Industry Segmentation By Geography
- 1. China
- 2. India
- 3. Japan
- 4. Vietnam
- 5. Rest of Asia Pacific
APAC Hydropower Industry Regional Market Share
Geographic Coverage of APAC Hydropower Industry
APAC Hydropower Industry REPORT HIGHLIGHTS
| Aspects | Details |
|---|---|
| Study Period | 2020-2034 |
| Base Year | 2025 |
| Estimated Year | 2026 |
| Forecast Period | 2026-2034 |
| Historical Period | 2020-2025 |
| Growth Rate | CAGR of 12.1% from 2020-2034 |
| Segmentation |
|
Table of Contents
- 1. Introduction
- 1.1. Research Scope
- 1.2. Market Segmentation
- 1.3. Research Methodology
- 1.4. Definitions and Assumptions
- 2. Executive Summary
- 2.1. Introduction
- 3. Market Dynamics
- 3.1. Introduction
- 3.2. Market Drivers
- 3.2.1. 4.; Increasing Power Generation Capacity Plans and Increasing Electricity Demand4.; Rapidly Growing Industrial and Infrastructural Development Activities
- 3.3. Market Restrains
- 3.3.1. 4.; Coal Substituted with Clean Energy Sources
- 3.4. Market Trends
- 3.4.1. Small Hydropower Segment Anticipated to Dominate the Market During the Forecast Period
- 4. Market Factor Analysis
- 4.1. Porters Five Forces
- 4.2. Supply/Value Chain
- 4.3. PESTEL analysis
- 4.4. Market Entropy
- 4.5. Patent/Trademark Analysis
- 5. Global APAC Hydropower Industry Analysis, Insights and Forecast, 2020-2032
- 5.1. Market Analysis, Insights and Forecast - by Size
- 5.1.1. Large Hydropower
- 5.1.2. Small Hydropower
- 5.1.3. Other Sizes
- 5.2. Market Analysis, Insights and Forecast - by Geography
- 5.2.1. China
- 5.2.2. India
- 5.2.3. Japan
- 5.2.4. Vietnam
- 5.2.5. Rest of Asia-Pacific
- 5.3. Market Analysis, Insights and Forecast - by Region
- 5.3.1. China
- 5.3.2. India
- 5.3.3. Japan
- 5.3.4. Vietnam
- 5.3.5. Rest of Asia Pacific
- 5.1. Market Analysis, Insights and Forecast - by Size
- 6. China APAC Hydropower Industry Analysis, Insights and Forecast, 2020-2032
- 6.1. Market Analysis, Insights and Forecast - by Size
- 6.1.1. Large Hydropower
- 6.1.2. Small Hydropower
- 6.1.3. Other Sizes
- 6.2. Market Analysis, Insights and Forecast - by Geography
- 6.2.1. China
- 6.2.2. India
- 6.2.3. Japan
- 6.2.4. Vietnam
- 6.2.5. Rest of Asia-Pacific
- 6.1. Market Analysis, Insights and Forecast - by Size
- 7. India APAC Hydropower Industry Analysis, Insights and Forecast, 2020-2032
- 7.1. Market Analysis, Insights and Forecast - by Size
- 7.1.1. Large Hydropower
- 7.1.2. Small Hydropower
- 7.1.3. Other Sizes
- 7.2. Market Analysis, Insights and Forecast - by Geography
- 7.2.1. China
- 7.2.2. India
- 7.2.3. Japan
- 7.2.4. Vietnam
- 7.2.5. Rest of Asia-Pacific
- 7.1. Market Analysis, Insights and Forecast - by Size
- 8. Japan APAC Hydropower Industry Analysis, Insights and Forecast, 2020-2032
- 8.1. Market Analysis, Insights and Forecast - by Size
- 8.1.1. Large Hydropower
- 8.1.2. Small Hydropower
- 8.1.3. Other Sizes
- 8.2. Market Analysis, Insights and Forecast - by Geography
- 8.2.1. China
- 8.2.2. India
- 8.2.3. Japan
- 8.2.4. Vietnam
- 8.2.5. Rest of Asia-Pacific
- 8.1. Market Analysis, Insights and Forecast - by Size
- 9. Vietnam APAC Hydropower Industry Analysis, Insights and Forecast, 2020-2032
- 9.1. Market Analysis, Insights and Forecast - by Size
- 9.1.1. Large Hydropower
- 9.1.2. Small Hydropower
- 9.1.3. Other Sizes
- 9.2. Market Analysis, Insights and Forecast - by Geography
- 9.2.1. China
- 9.2.2. India
- 9.2.3. Japan
- 9.2.4. Vietnam
- 9.2.5. Rest of Asia-Pacific
- 9.1. Market Analysis, Insights and Forecast - by Size
- 10. Rest of Asia Pacific APAC Hydropower Industry Analysis, Insights and Forecast, 2020-2032
- 10.1. Market Analysis, Insights and Forecast - by Size
- 10.1.1. Large Hydropower
- 10.1.2. Small Hydropower
- 10.1.3. Other Sizes
- 10.2. Market Analysis, Insights and Forecast - by Geography
- 10.2.1. China
- 10.2.2. India
- 10.2.3. Japan
- 10.2.4. Vietnam
- 10.2.5. Rest of Asia-Pacific
- 10.1. Market Analysis, Insights and Forecast - by Size
- 11. Competitive Analysis
- 11.1. Global Market Share Analysis 2025
- 11.2. Company Profiles
- 11.2.1 PowerChina
- 11.2.1.1. Overview
- 11.2.1.2. Products
- 11.2.1.3. SWOT Analysis
- 11.2.1.4. Recent Developments
- 11.2.1.5. Financials (Based on Availability)
- 11.2.2 PT Perusahaan Listrik Negara
- 11.2.2.1. Overview
- 11.2.2.2. Products
- 11.2.2.3. SWOT Analysis
- 11.2.2.4. Recent Developments
- 11.2.2.5. Financials (Based on Availability)
- 11.2.3 General Electric Company (GE Renewable Energy)
- 11.2.3.1. Overview
- 11.2.3.2. Products
- 11.2.3.3. SWOT Analysis
- 11.2.3.4. Recent Developments
- 11.2.3.5. Financials (Based on Availability)
- 11.2.4 China Yangtze Power Co Ltd
- 11.2.4.1. Overview
- 11.2.4.2. Products
- 11.2.4.3. SWOT Analysis
- 11.2.4.4. Recent Developments
- 11.2.4.5. Financials (Based on Availability)
- 11.2.5 Electricity Generating Authority of Thailand
- 11.2.5.1. Overview
- 11.2.5.2. Products
- 11.2.5.3. SWOT Analysis
- 11.2.5.4. Recent Developments
- 11.2.5.5. Financials (Based on Availability)
- 11.2.6 Aboitiz Power Corporation
- 11.2.6.1. Overview
- 11.2.6.2. Products
- 11.2.6.3. SWOT Analysis
- 11.2.6.4. Recent Developments
- 11.2.6.5. Financials (Based on Availability)
- 11.2.7 NTPC Limited
- 11.2.7.1. Overview
- 11.2.7.2. Products
- 11.2.7.3. SWOT Analysis
- 11.2.7.4. Recent Developments
- 11.2.7.5. Financials (Based on Availability)
- 11.2.8 NHPC Ltd
- 11.2.8.1. Overview
- 11.2.8.2. Products
- 11.2.8.3. SWOT Analysis
- 11.2.8.4. Recent Developments
- 11.2.8.5. Financials (Based on Availability)
- 11.2.9 Tenaga Nasional Berhad
- 11.2.9.1. Overview
- 11.2.9.2. Products
- 11.2.9.3. SWOT Analysis
- 11.2.9.4. Recent Developments
- 11.2.9.5. Financials (Based on Availability)
- 11.2.10 Tokyo Electric Power Company Holdings Inc
- 11.2.10.1. Overview
- 11.2.10.2. Products
- 11.2.10.3. SWOT Analysis
- 11.2.10.4. Recent Developments
- 11.2.10.5. Financials (Based on Availability)
- 11.2.1 PowerChina
List of Figures
- Figure 1: Global APAC Hydropower Industry Revenue Breakdown (billion, %) by Region 2025 & 2033
- Figure 2: Global APAC Hydropower Industry Volume Breakdown (terawatt, %) by Region 2025 & 2033
- Figure 3: China APAC Hydropower Industry Revenue (billion), by Size 2025 & 2033
- Figure 4: China APAC Hydropower Industry Volume (terawatt), by Size 2025 & 2033
- Figure 5: China APAC Hydropower Industry Revenue Share (%), by Size 2025 & 2033
- Figure 6: China APAC Hydropower Industry Volume Share (%), by Size 2025 & 2033
- Figure 7: China APAC Hydropower Industry Revenue (billion), by Geography 2025 & 2033
- Figure 8: China APAC Hydropower Industry Volume (terawatt), by Geography 2025 & 2033
- Figure 9: China APAC Hydropower Industry Revenue Share (%), by Geography 2025 & 2033
- Figure 10: China APAC Hydropower Industry Volume Share (%), by Geography 2025 & 2033
- Figure 11: China APAC Hydropower Industry Revenue (billion), by Country 2025 & 2033
- Figure 12: China APAC Hydropower Industry Volume (terawatt), by Country 2025 & 2033
- Figure 13: China APAC Hydropower Industry Revenue Share (%), by Country 2025 & 2033
- Figure 14: China APAC Hydropower Industry Volume Share (%), by Country 2025 & 2033
- Figure 15: India APAC Hydropower Industry Revenue (billion), by Size 2025 & 2033
- Figure 16: India APAC Hydropower Industry Volume (terawatt), by Size 2025 & 2033
- Figure 17: India APAC Hydropower Industry Revenue Share (%), by Size 2025 & 2033
- Figure 18: India APAC Hydropower Industry Volume Share (%), by Size 2025 & 2033
- Figure 19: India APAC Hydropower Industry Revenue (billion), by Geography 2025 & 2033
- Figure 20: India APAC Hydropower Industry Volume (terawatt), by Geography 2025 & 2033
- Figure 21: India APAC Hydropower Industry Revenue Share (%), by Geography 2025 & 2033
- Figure 22: India APAC Hydropower Industry Volume Share (%), by Geography 2025 & 2033
- Figure 23: India APAC Hydropower Industry Revenue (billion), by Country 2025 & 2033
- Figure 24: India APAC Hydropower Industry Volume (terawatt), by Country 2025 & 2033
- Figure 25: India APAC Hydropower Industry Revenue Share (%), by Country 2025 & 2033
- Figure 26: India APAC Hydropower Industry Volume Share (%), by Country 2025 & 2033
- Figure 27: Japan APAC Hydropower Industry Revenue (billion), by Size 2025 & 2033
- Figure 28: Japan APAC Hydropower Industry Volume (terawatt), by Size 2025 & 2033
- Figure 29: Japan APAC Hydropower Industry Revenue Share (%), by Size 2025 & 2033
- Figure 30: Japan APAC Hydropower Industry Volume Share (%), by Size 2025 & 2033
- Figure 31: Japan APAC Hydropower Industry Revenue (billion), by Geography 2025 & 2033
- Figure 32: Japan APAC Hydropower Industry Volume (terawatt), by Geography 2025 & 2033
- Figure 33: Japan APAC Hydropower Industry Revenue Share (%), by Geography 2025 & 2033
- Figure 34: Japan APAC Hydropower Industry Volume Share (%), by Geography 2025 & 2033
- Figure 35: Japan APAC Hydropower Industry Revenue (billion), by Country 2025 & 2033
- Figure 36: Japan APAC Hydropower Industry Volume (terawatt), by Country 2025 & 2033
- Figure 37: Japan APAC Hydropower Industry Revenue Share (%), by Country 2025 & 2033
- Figure 38: Japan APAC Hydropower Industry Volume Share (%), by Country 2025 & 2033
- Figure 39: Vietnam APAC Hydropower Industry Revenue (billion), by Size 2025 & 2033
- Figure 40: Vietnam APAC Hydropower Industry Volume (terawatt), by Size 2025 & 2033
- Figure 41: Vietnam APAC Hydropower Industry Revenue Share (%), by Size 2025 & 2033
- Figure 42: Vietnam APAC Hydropower Industry Volume Share (%), by Size 2025 & 2033
- Figure 43: Vietnam APAC Hydropower Industry Revenue (billion), by Geography 2025 & 2033
- Figure 44: Vietnam APAC Hydropower Industry Volume (terawatt), by Geography 2025 & 2033
- Figure 45: Vietnam APAC Hydropower Industry Revenue Share (%), by Geography 2025 & 2033
- Figure 46: Vietnam APAC Hydropower Industry Volume Share (%), by Geography 2025 & 2033
- Figure 47: Vietnam APAC Hydropower Industry Revenue (billion), by Country 2025 & 2033
- Figure 48: Vietnam APAC Hydropower Industry Volume (terawatt), by Country 2025 & 2033
- Figure 49: Vietnam APAC Hydropower Industry Revenue Share (%), by Country 2025 & 2033
- Figure 50: Vietnam APAC Hydropower Industry Volume Share (%), by Country 2025 & 2033
- Figure 51: Rest of Asia Pacific APAC Hydropower Industry Revenue (billion), by Size 2025 & 2033
- Figure 52: Rest of Asia Pacific APAC Hydropower Industry Volume (terawatt), by Size 2025 & 2033
- Figure 53: Rest of Asia Pacific APAC Hydropower Industry Revenue Share (%), by Size 2025 & 2033
- Figure 54: Rest of Asia Pacific APAC Hydropower Industry Volume Share (%), by Size 2025 & 2033
- Figure 55: Rest of Asia Pacific APAC Hydropower Industry Revenue (billion), by Geography 2025 & 2033
- Figure 56: Rest of Asia Pacific APAC Hydropower Industry Volume (terawatt), by Geography 2025 & 2033
- Figure 57: Rest of Asia Pacific APAC Hydropower Industry Revenue Share (%), by Geography 2025 & 2033
- Figure 58: Rest of Asia Pacific APAC Hydropower Industry Volume Share (%), by Geography 2025 & 2033
- Figure 59: Rest of Asia Pacific APAC Hydropower Industry Revenue (billion), by Country 2025 & 2033
- Figure 60: Rest of Asia Pacific APAC Hydropower Industry Volume (terawatt), by Country 2025 & 2033
- Figure 61: Rest of Asia Pacific APAC Hydropower Industry Revenue Share (%), by Country 2025 & 2033
- Figure 62: Rest of Asia Pacific APAC Hydropower Industry Volume Share (%), by Country 2025 & 2033
List of Tables
- Table 1: Global APAC Hydropower Industry Revenue billion Forecast, by Size 2020 & 2033
- Table 2: Global APAC Hydropower Industry Volume terawatt Forecast, by Size 2020 & 2033
- Table 3: Global APAC Hydropower Industry Revenue billion Forecast, by Geography 2020 & 2033
- Table 4: Global APAC Hydropower Industry Volume terawatt Forecast, by Geography 2020 & 2033
- Table 5: Global APAC Hydropower Industry Revenue billion Forecast, by Region 2020 & 2033
- Table 6: Global APAC Hydropower Industry Volume terawatt Forecast, by Region 2020 & 2033
- Table 7: Global APAC Hydropower Industry Revenue billion Forecast, by Size 2020 & 2033
- Table 8: Global APAC Hydropower Industry Volume terawatt Forecast, by Size 2020 & 2033
- Table 9: Global APAC Hydropower Industry Revenue billion Forecast, by Geography 2020 & 2033
- Table 10: Global APAC Hydropower Industry Volume terawatt Forecast, by Geography 2020 & 2033
- Table 11: Global APAC Hydropower Industry Revenue billion Forecast, by Country 2020 & 2033
- Table 12: Global APAC Hydropower Industry Volume terawatt Forecast, by Country 2020 & 2033
- Table 13: Global APAC Hydropower Industry Revenue billion Forecast, by Size 2020 & 2033
- Table 14: Global APAC Hydropower Industry Volume terawatt Forecast, by Size 2020 & 2033
- Table 15: Global APAC Hydropower Industry Revenue billion Forecast, by Geography 2020 & 2033
- Table 16: Global APAC Hydropower Industry Volume terawatt Forecast, by Geography 2020 & 2033
- Table 17: Global APAC Hydropower Industry Revenue billion Forecast, by Country 2020 & 2033
- Table 18: Global APAC Hydropower Industry Volume terawatt Forecast, by Country 2020 & 2033
- Table 19: Global APAC Hydropower Industry Revenue billion Forecast, by Size 2020 & 2033
- Table 20: Global APAC Hydropower Industry Volume terawatt Forecast, by Size 2020 & 2033
- Table 21: Global APAC Hydropower Industry Revenue billion Forecast, by Geography 2020 & 2033
- Table 22: Global APAC Hydropower Industry Volume terawatt Forecast, by Geography 2020 & 2033
- Table 23: Global APAC Hydropower Industry Revenue billion Forecast, by Country 2020 & 2033
- Table 24: Global APAC Hydropower Industry Volume terawatt Forecast, by Country 2020 & 2033
- Table 25: Global APAC Hydropower Industry Revenue billion Forecast, by Size 2020 & 2033
- Table 26: Global APAC Hydropower Industry Volume terawatt Forecast, by Size 2020 & 2033
- Table 27: Global APAC Hydropower Industry Revenue billion Forecast, by Geography 2020 & 2033
- Table 28: Global APAC Hydropower Industry Volume terawatt Forecast, by Geography 2020 & 2033
- Table 29: Global APAC Hydropower Industry Revenue billion Forecast, by Country 2020 & 2033
- Table 30: Global APAC Hydropower Industry Volume terawatt Forecast, by Country 2020 & 2033
- Table 31: Global APAC Hydropower Industry Revenue billion Forecast, by Size 2020 & 2033
- Table 32: Global APAC Hydropower Industry Volume terawatt Forecast, by Size 2020 & 2033
- Table 33: Global APAC Hydropower Industry Revenue billion Forecast, by Geography 2020 & 2033
- Table 34: Global APAC Hydropower Industry Volume terawatt Forecast, by Geography 2020 & 2033
- Table 35: Global APAC Hydropower Industry Revenue billion Forecast, by Country 2020 & 2033
- Table 36: Global APAC Hydropower Industry Volume terawatt Forecast, by Country 2020 & 2033
Frequently Asked Questions
1. What is the projected Compound Annual Growth Rate (CAGR) of the APAC Hydropower Industry?
The projected CAGR is approximately 12.1%.
2. Which companies are prominent players in the APAC Hydropower Industry?
Key companies in the market include PowerChina, PT Perusahaan Listrik Negara, General Electric Company (GE Renewable Energy), China Yangtze Power Co Ltd, Electricity Generating Authority of Thailand, Aboitiz Power Corporation, NTPC Limited, NHPC Ltd, Tenaga Nasional Berhad, Tokyo Electric Power Company Holdings Inc.
3. What are the main segments of the APAC Hydropower Industry?
The market segments include Size, Geography.
4. Can you provide details about the market size?
The market size is estimated to be USD 98.5 billion as of 2022.
5. What are some drivers contributing to market growth?
4.; Increasing Power Generation Capacity Plans and Increasing Electricity Demand4.; Rapidly Growing Industrial and Infrastructural Development Activities.
6. What are the notable trends driving market growth?
Small Hydropower Segment Anticipated to Dominate the Market During the Forecast Period.
7. Are there any restraints impacting market growth?
4.; Coal Substituted with Clean Energy Sources.
8. Can you provide examples of recent developments in the market?
In July 2022, the Development Bank of the Philippines (DBP) approved USD 11.7 million in funding to support the development of the 4.6 MW Dupinga Mini Hydropower project in Gabaldon, Nueva Ecija, in the Philippines. The DBP's financing of the Dupinga Project will help the government reach its 30% renewable energy goal by 2030.
9. What pricing options are available for accessing the report?
Pricing options include single-user, multi-user, and enterprise licenses priced at USD 4750, USD 5250, and USD 8750 respectively.
10. Is the market size provided in terms of value or volume?
The market size is provided in terms of value, measured in billion and volume, measured in terawatt.
11. Are there any specific market keywords associated with the report?
Yes, the market keyword associated with the report is "APAC Hydropower Industry," which aids in identifying and referencing the specific market segment covered.
12. How do I determine which pricing option suits my needs best?
The pricing options vary based on user requirements and access needs. Individual users may opt for single-user licenses, while businesses requiring broader access may choose multi-user or enterprise licenses for cost-effective access to the report.
13. Are there any additional resources or data provided in the APAC Hydropower Industry report?
While the report offers comprehensive insights, it's advisable to review the specific contents or supplementary materials provided to ascertain if additional resources or data are available.
14. How can I stay updated on further developments or reports in the APAC Hydropower Industry?
To stay informed about further developments, trends, and reports in the APAC Hydropower Industry, consider subscribing to industry newsletters, following relevant companies and organizations, or regularly checking reputable industry news sources and publications.
Methodology
Step 1 - Identification of Relevant Samples Size from Population Database


Step 2 - Approaches for Defining Global Market Size (Value, Volume* & Price*)

Note*: In applicable scenarios
Step 3 - Data Sources
Primary Research
- Web Analytics
- Survey Reports
- Research Institute
- Latest Research Reports
- Opinion Leaders
Secondary Research
- Annual Reports
- White Paper
- Latest Press Release
- Industry Association
- Paid Database
- Investor Presentations

Step 4 - Data Triangulation
Involves using different sources of information in order to increase the validity of a study
These sources are likely to be stakeholders in a program - participants, other researchers, program staff, other community members, and so on.
Then we put all data in single framework & apply various statistical tools to find out the dynamic on the market.
During the analysis stage, feedback from the stakeholder groups would be compared to determine areas of agreement as well as areas of divergence