

Key Insights
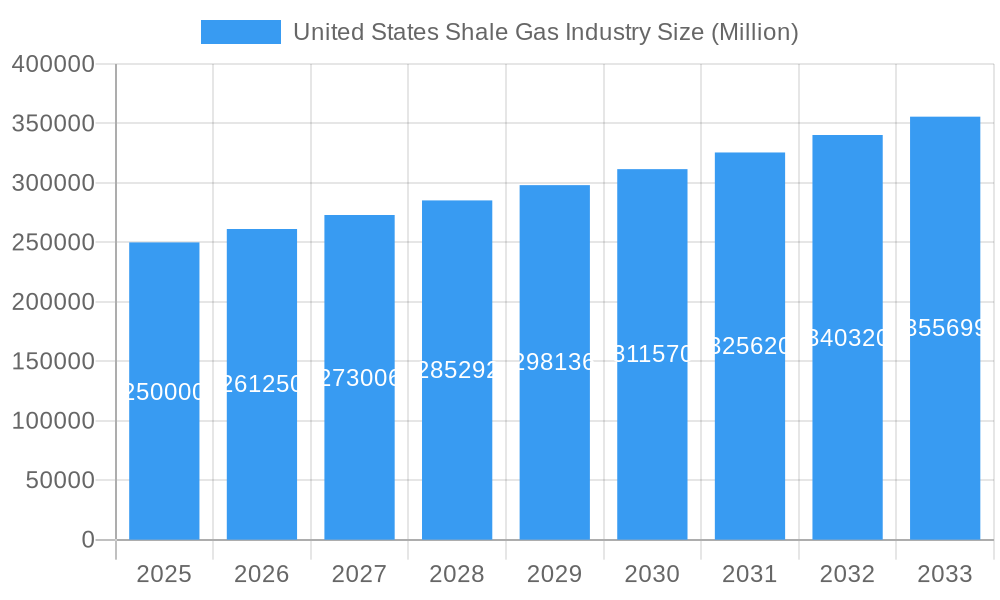
The United States shale gas sector is experiencing robust growth and is projected to maintain a significant upward trajectory through 2033. Increasing energy demand from power generation and industrial applications, coupled with advancements in drilling and extraction technologies, are key drivers. The shale gas segment dominates, surpassing shale oil due to its abundance and cost-effectiveness. Major players like Shell, ExxonMobil, Chevron, and ConocoPhillips are investing in infrastructure and exploration. While environmental concerns and regulatory pressures exist, economic advantages, including lower production costs and national energy security, outweigh these challenges. The U.S. remains the primary market, benefiting from established infrastructure and a supportive regulatory environment. The market size is estimated at $94.34 billion in 2025, with a projected CAGR of 7.05%.
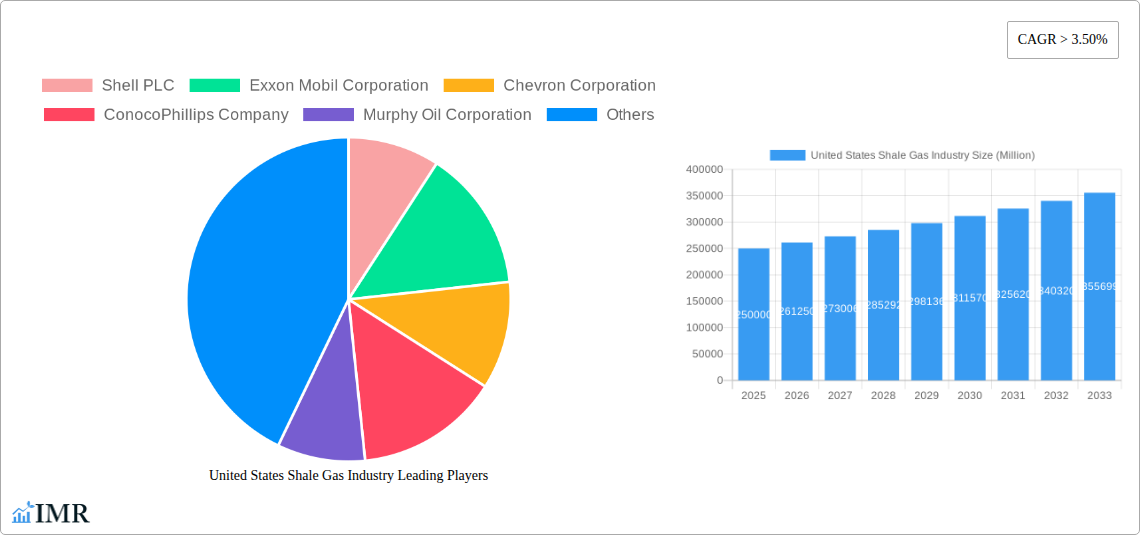
United States Shale Gas Industry Market Size (In Billion)
Despite potential fluctuations in global energy prices and government policies, the long-term outlook for the U.S. shale gas industry is positive. Technological innovations, such as horizontal drilling and hydraulic fracturing, are enhancing efficiency and reducing extraction costs, fostering profitability and investment. Intense competition drives continuous innovation, benefiting consumers. While supply chain disruptions and geopolitical factors may cause short-term uncertainties, fundamental demand drivers and technological progress are expected to sustain industry growth. Sustainability and environmental mitigation practices will increasingly influence the industry, requiring continuous improvements in performance and resource management.
United States Shale Gas Industry Company Market Share
This report offers an in-depth analysis of the United States Shale Gas Industry, covering market dynamics, growth trends, competitive landscape, and future outlook. It focuses on the parent market (Energy) and child market (Shale Gas & Shale Oil). The study period is 2019-2033, with a base year of 2025 and a forecast period of 2025-2033.
United States Shale Gas Industry Market Dynamics & Structure
This section analyzes the market structure, focusing on concentration levels, technological advancements driving innovation, regulatory landscapes, competitive substitutions, end-user demographics, and mergers & acquisitions (M&A) activity. Quantitative data such as market share percentages and M&A deal volumes, alongside qualitative factors like innovation barriers, will be presented.
- Market Concentration: The US shale gas market exhibits [xx]% concentration amongst the top 5 players in 2025, with a predicted [xx]% increase/decrease by 2033.
- Technological Innovation: Hydraulic fracturing and horizontal drilling advancements continue to drive efficiency gains, although challenges remain in [mention specific challenges, e.g., water management, induced seismicity].
- Regulatory Framework: State-level regulations significantly impact operations, leading to varying levels of production across different basins. Federal regulations regarding emissions and environmental impact are also key factors.
- Competitive Substitutes: Renewables like solar and wind power pose increasing competition, albeit with varying degrees of penetration in different regions.
- End-User Demographics: Primarily focused on power generation and industrial applications. Shifting energy demands and government policies will influence the future demand.
- M&A Trends: The period 2019-2024 witnessed [xx] significant M&A deals, totaling approximately [xx] million USD. [xx]% of these deals involved the acquisition of smaller, independent producers by larger integrated energy companies.
United States Shale Gas Industry Growth Trends & Insights
This section provides a detailed analysis of market size evolution, adoption rates, technological disruptions, and consumer behavior shifts from 2019 to 2033. Key metrics such as Compound Annual Growth Rate (CAGR) and market penetration rates are incorporated to provide insightful data. The analysis leverages [mention specific data sources and models used - e.g., proprietary databases, statistical models] to project future trends.
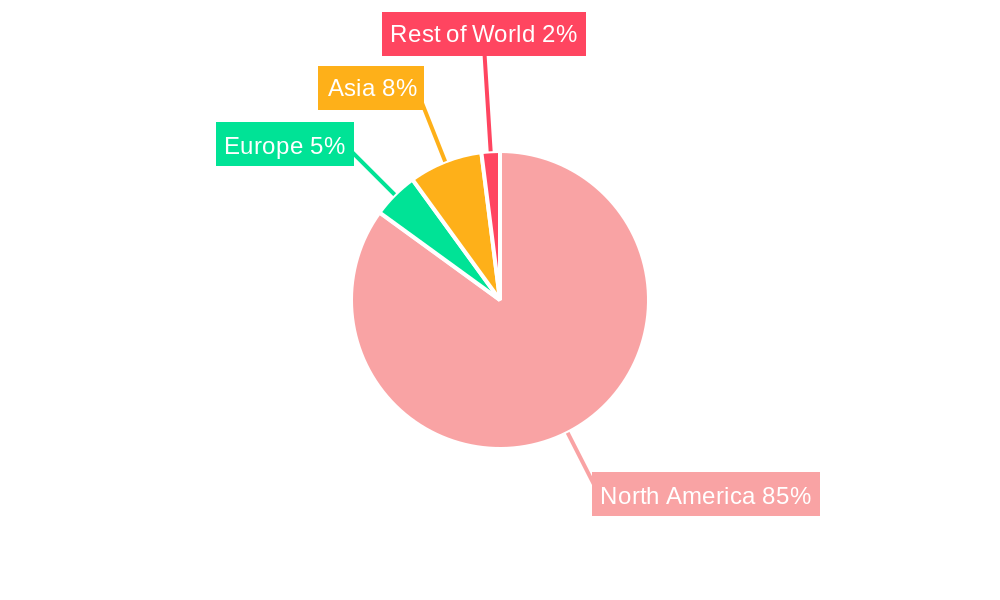
Dominant Regions, Countries, or Segments in United States Shale Gas Industry
This section identifies the leading regions, countries, or segments (Shale Gas, Shale Oil) driving market growth. Key drivers like economic policies and infrastructure development will be analyzed along with market share and growth potential.
- Leading Region: The Permian Basin remains the dominant region, accounting for [xx]% of total US shale gas production in 2025. The Appalachian Basin holds [xx]% share, while other regions contribute [xx]%.
- Shale Gas vs. Shale Oil: Shale gas continues to dominate, representing [xx]% of total production, driven by robust demand from the power sector. Shale oil production accounts for [xx]%, with fluctuations influenced by global crude oil prices.
- Key Drivers: Favorable geological conditions, existing infrastructure, and supportive government policies contribute significantly to the Permian Basin's dominance.
United States Shale Gas Industry Product Landscape
This section details product innovations, applications, and performance metrics. The focus is on unique selling propositions and technological advancements contributing to improved efficiency, reduced environmental impact, and enhanced profitability.
Key Drivers, Barriers & Challenges in United States Shale Gas Industry
This section outlines the key drivers and challenges impacting the industry.
Key Drivers:
- Technological advancements in drilling and completion techniques
- Growing demand for natural gas in power generation and industrial sectors
- Relatively lower production costs compared to other energy sources
Key Challenges and Restraints:
- Fluctuating natural gas prices
- Environmental concerns regarding methane emissions and water usage
- Stringent regulatory environment
Emerging Opportunities in United States Shale Gas Industry
This section highlights emerging trends and opportunities, including untapped markets and innovative applications. The focus is on potential future growth areas within the industry.
Growth Accelerators in the United States Shale Gas Industry Industry
This section discusses catalysts driving long-term growth, emphasizing technological breakthroughs, strategic partnerships, and market expansion strategies. The focus is on sustained growth factors within the shale gas industry.
Key Players Shaping the United States Shale Gas Industry Market
- Shell PLC
- Exxon Mobil Corporation
- Chevron Corporation
- ConocoPhillips Company
- Murphy Oil Corporation
- Baker Hughes Company
- TotalEnergies SE
Notable Milestones in United States Shale Gas Industry Sector
- September 2021: Shell PLC sold its Permian Basin assets to ConocoPhillips for USD 9.5 billion, signaling a strategic shift towards clean energy.
- January 2022: Oil India Ltd exited a US shale oil venture, selling its 20% stake for USD 25 million.
In-Depth United States Shale Gas Industry Market Outlook
This section summarizes growth accelerators, focusing on future market potential and strategic opportunities for continued expansion and development within the US Shale Gas industry. The emphasis is on long-term perspectives and potential future scenarios.
United States Shale Gas Industry Segmentation
-
1. Type
- 1.1. Shale Gas
- 1.2. Shale Oil
United States Shale Gas Industry Segmentation By Geography
- 1. United States
United States Shale Gas Industry Regional Market Share
Geographic Coverage of United States Shale Gas Industry
United States Shale Gas Industry REPORT HIGHLIGHTS
| Aspects | Details |
|---|---|
| Study Period | 2020-2034 |
| Base Year | 2025 |
| Estimated Year | 2026 |
| Forecast Period | 2026-2034 |
| Historical Period | 2020-2025 |
| Growth Rate | CAGR of 7.05% from 2020-2034 |
| Segmentation |
|
Table of Contents
- 1. Introduction
- 1.1. Research Scope
- 1.2. Market Segmentation
- 1.3. Research Methodology
- 1.4. Definitions and Assumptions
- 2. Executive Summary
- 2.1. Introduction
- 3. Market Dynamics
- 3.1. Introduction
- 3.2. Market Drivers
- 3.2.1. 4.; Modernization and Upgrades of Existing Military Aircraft Fleets4.; Increasing Defense Budgets
- 3.3. Market Restrains
- 3.3.1. 4.; Shift Toward Unmanned Aircraft
- 3.4. Market Trends
- 3.4.1. Shale Gas to Dominate the Market
- 4. Market Factor Analysis
- 4.1. Porters Five Forces
- 4.2. Supply/Value Chain
- 4.3. PESTEL analysis
- 4.4. Market Entropy
- 4.5. Patent/Trademark Analysis
- 5. United States Shale Gas Industry Analysis, Insights and Forecast, 2020-2032
- 5.1. Market Analysis, Insights and Forecast - by Type
- 5.1.1. Shale Gas
- 5.1.2. Shale Oil
- 5.2. Market Analysis, Insights and Forecast - by Region
- 5.2.1. United States
- 5.1. Market Analysis, Insights and Forecast - by Type
- 6. Competitive Analysis
- 6.1. Market Share Analysis 2025
- 6.2. Company Profiles
- 6.2.1 Shell PLC
- 6.2.1.1. Overview
- 6.2.1.2. Products
- 6.2.1.3. SWOT Analysis
- 6.2.1.4. Recent Developments
- 6.2.1.5. Financials (Based on Availability)
- 6.2.2 Exxon Mobil Corporation
- 6.2.2.1. Overview
- 6.2.2.2. Products
- 6.2.2.3. SWOT Analysis
- 6.2.2.4. Recent Developments
- 6.2.2.5. Financials (Based on Availability)
- 6.2.3 Chevron Corporation
- 6.2.3.1. Overview
- 6.2.3.2. Products
- 6.2.3.3. SWOT Analysis
- 6.2.3.4. Recent Developments
- 6.2.3.5. Financials (Based on Availability)
- 6.2.4 ConocoPhillips Company
- 6.2.4.1. Overview
- 6.2.4.2. Products
- 6.2.4.3. SWOT Analysis
- 6.2.4.4. Recent Developments
- 6.2.4.5. Financials (Based on Availability)
- 6.2.5 Murphy Oil Corporation
- 6.2.5.1. Overview
- 6.2.5.2. Products
- 6.2.5.3. SWOT Analysis
- 6.2.5.4. Recent Developments
- 6.2.5.5. Financials (Based on Availability)
- 6.2.6 Baker Hughes Company
- 6.2.6.1. Overview
- 6.2.6.2. Products
- 6.2.6.3. SWOT Analysis
- 6.2.6.4. Recent Developments
- 6.2.6.5. Financials (Based on Availability)
- 6.2.7 TotalEnergies SE
- 6.2.7.1. Overview
- 6.2.7.2. Products
- 6.2.7.3. SWOT Analysis
- 6.2.7.4. Recent Developments
- 6.2.7.5. Financials (Based on Availability)
- 6.2.1 Shell PLC
List of Figures
- Figure 1: United States Shale Gas Industry Revenue Breakdown (billion, %) by Product 2025 & 2033
- Figure 2: United States Shale Gas Industry Share (%) by Company 2025
List of Tables
- Table 1: United States Shale Gas Industry Revenue billion Forecast, by Type 2020 & 2033
- Table 2: United States Shale Gas Industry Volume Trillion Forecast, by Type 2020 & 2033
- Table 3: United States Shale Gas Industry Revenue billion Forecast, by Region 2020 & 2033
- Table 4: United States Shale Gas Industry Volume Trillion Forecast, by Region 2020 & 2033
- Table 5: United States Shale Gas Industry Revenue billion Forecast, by Type 2020 & 2033
- Table 6: United States Shale Gas Industry Volume Trillion Forecast, by Type 2020 & 2033
- Table 7: United States Shale Gas Industry Revenue billion Forecast, by Country 2020 & 2033
- Table 8: United States Shale Gas Industry Volume Trillion Forecast, by Country 2020 & 2033
Frequently Asked Questions
1. What is the projected Compound Annual Growth Rate (CAGR) of the United States Shale Gas Industry?
The projected CAGR is approximately 7.05%.
2. Which companies are prominent players in the United States Shale Gas Industry?
Key companies in the market include Shell PLC, Exxon Mobil Corporation, Chevron Corporation, ConocoPhillips Company, Murphy Oil Corporation, Baker Hughes Company, TotalEnergies SE.
3. What are the main segments of the United States Shale Gas Industry?
The market segments include Type.
4. Can you provide details about the market size?
The market size is estimated to be USD 94.34 billion as of 2022.
5. What are some drivers contributing to market growth?
4.; Modernization and Upgrades of Existing Military Aircraft Fleets4.; Increasing Defense Budgets.
6. What are the notable trends driving market growth?
Shale Gas to Dominate the Market.
7. Are there any restraints impacting market growth?
4.; Shift Toward Unmanned Aircraft.
8. Can you provide examples of recent developments in the market?
In January 2022, Oil India Ltd (OIL) exited from a US shale oil venture, selling its 20% stake to its venture partner for USD 25 million. The company had divested its entire stake in Niobrara shale asset, US.
9. What pricing options are available for accessing the report?
Pricing options include single-user, multi-user, and enterprise licenses priced at USD 3800, USD 4500, and USD 5800 respectively.
10. Is the market size provided in terms of value or volume?
The market size is provided in terms of value, measured in billion and volume, measured in Trillion.
11. Are there any specific market keywords associated with the report?
Yes, the market keyword associated with the report is "United States Shale Gas Industry," which aids in identifying and referencing the specific market segment covered.
12. How do I determine which pricing option suits my needs best?
The pricing options vary based on user requirements and access needs. Individual users may opt for single-user licenses, while businesses requiring broader access may choose multi-user or enterprise licenses for cost-effective access to the report.
13. Are there any additional resources or data provided in the United States Shale Gas Industry report?
While the report offers comprehensive insights, it's advisable to review the specific contents or supplementary materials provided to ascertain if additional resources or data are available.
14. How can I stay updated on further developments or reports in the United States Shale Gas Industry?
To stay informed about further developments, trends, and reports in the United States Shale Gas Industry, consider subscribing to industry newsletters, following relevant companies and organizations, or regularly checking reputable industry news sources and publications.
Methodology
Step 1 - Identification of Relevant Samples Size from Population Database


Step 2 - Approaches for Defining Global Market Size (Value, Volume* & Price*)

Note*: In applicable scenarios
Step 3 - Data Sources
Primary Research
- Web Analytics
- Survey Reports
- Research Institute
- Latest Research Reports
- Opinion Leaders
Secondary Research
- Annual Reports
- White Paper
- Latest Press Release
- Industry Association
- Paid Database
- Investor Presentations

Step 4 - Data Triangulation
Involves using different sources of information in order to increase the validity of a study
These sources are likely to be stakeholders in a program - participants, other researchers, program staff, other community members, and so on.
Then we put all data in single framework & apply various statistical tools to find out the dynamic on the market.
During the analysis stage, feedback from the stakeholder groups would be compared to determine areas of agreement as well as areas of divergence