

Key Insights
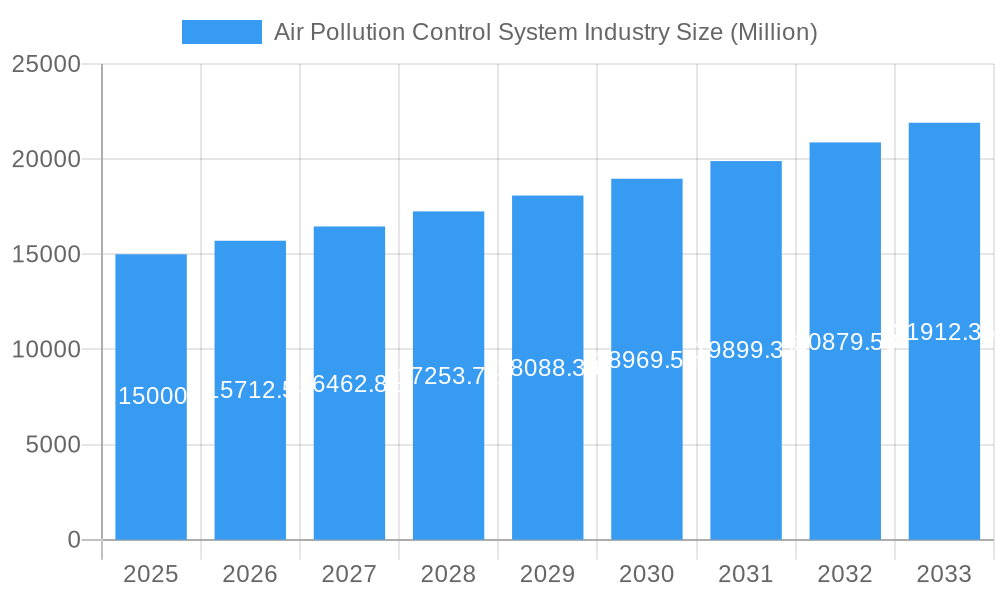
The Air Pollution Control System (APCS) market is poised for significant expansion, with a projected market size of 103.66 billion in 2025. The sector is expected to grow at a Compound Annual Growth Rate (CAGR) of 6.3% from 2025 to 2033. This robust growth trajectory is primarily propelled by increasingly stringent global regulations designed to curtail emissions from critical sectors including power generation, industrial operations, and transportation. Heightened public and governmental awareness of air pollution's adverse effects on health and the environment further stimulates demand. Key application industries contributing to market revenue include power generation, cement, iron & steel, and chemical manufacturing. Within the APCS market, Electrostatic Precipitators (ESPs), Flue Gas Desulfurization (FGD) systems, and Selective Catalytic Reduction (SCR) technologies are leading segments, reflecting diverse strategies for emission mitigation. Ongoing technological advancements, emphasizing efficiency and cost-effectiveness, are also key growth drivers. However, substantial initial investment costs and potential operational complexities represent market restraints. Geographically, North America and Asia Pacific exhibit strong market performance, fueled by vigorous industrial activity and supportive regulatory frameworks. Europe also represents a substantial market, influenced by progressively rigorous emission standards.
Air Pollution Control System Industry Market Size (In Billion)
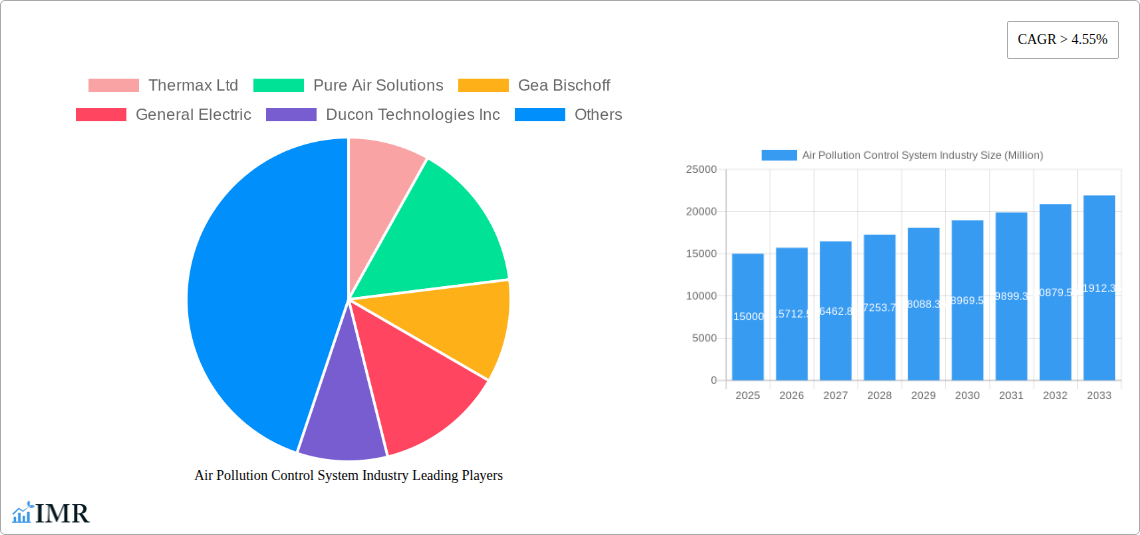
The competitive environment features a blend of established global corporations and agile regional specialists. Prominent market players, including Thermax Ltd, Pure Air Solutions, GEA Bischoff, General Electric, and Ducon Technologies Inc., command significant market share through their technological prowess and international presence. Concurrently, emerging companies are carving out market share by focusing on innovative solutions and tailored regional offerings. The future outlook for the APCS market is exceptionally positive, underpinned by a global commitment to sustainable development and the accelerating adoption of cleaner energy sources. Continuous technological innovation, evolving regulatory landscapes, and an amplified focus on environmental stewardship will shape the market's evolution. This dynamic environment will foster the development of advanced, integrated systems designed for optimized performance and minimized ecological impact.
Air Pollution Control System Industry Company Market Share
Air Pollution Control System Industry Market Report: 2019-2033
This comprehensive report provides a detailed analysis of the Air Pollution Control System industry, encompassing market dynamics, growth trends, regional segmentation, product landscape, key players, and future outlook. The study period covers 2019-2033, with 2025 as the base and estimated year. The forecast period is 2025-2033 and the historical period is 2019-2024. The market is segmented by type (Electrostatic Precipitators (ESP), Flue Gas Desulfurization (FGD), Scrubbers, Selective Catalytic Reduction (SCR), Fabric Filters) and application (Power Generation, Cement Industry, Iron & Steel Industry, Chemical Industry, Others). Key players include Thermax Ltd, Pure Air Solutions, Gea Bischoff, General Electric, Ducon Technologies Inc, Horiba Ltd, Hamon Corporation, Andritz AG, Siemens AG, Mitsubishi Hitachi Power Systems Ltd, Calgon Carbon Corporation, Fujian Longking Co Ltd, Babcock & Wilcox Enterprises Inc, Tri-mer, Amec Foster Wheeler, and Esco International. The total market size is projected to reach xx Million by 2033.
Air Pollution Control System Industry Market Dynamics & Structure
The Air Pollution Control System market is characterized by moderate concentration, with a few major players holding significant market share. Technological innovation, driven by stricter environmental regulations and the need for higher efficiency, is a key driver. Regulatory frameworks, varying across regions, significantly impact market growth. Competitive substitutes, such as alternative energy sources, pose a challenge. End-user demographics, particularly the growth of industrial sectors like power generation and cement, fuel market expansion. M&A activity is moderate, with strategic acquisitions aimed at expanding product portfolios and geographical reach.
- Market Concentration: Moderately concentrated, with top 5 players holding approximately xx% market share in 2025.
- Technological Innovation: Focus on improving efficiency, reducing energy consumption, and enhancing pollutant removal capabilities.
- Regulatory Framework: Stringent emission standards in developed regions drive adoption, while developing regions show increasing regulatory pressure.
- Competitive Substitutes: Renewable energy sources and alternative technologies represent a long-term competitive threat.
- End-User Demographics: Growth in industrial sectors like power generation and cement fuels demand.
- M&A Trends: xx M&A deals recorded between 2019-2024, primarily focused on technological integration and market expansion.
Air Pollution Control System Industry Growth Trends & Insights
The Air Pollution Control System market experienced robust growth during the historical period (2019-2024), driven by increasing environmental concerns and stringent regulatory compliance. The market size is estimated at xx Million in 2025 and is projected to exhibit a CAGR of xx% during the forecast period (2025-2033). This growth is fueled by rising industrialization, particularly in developing economies, coupled with technological advancements leading to improved system efficiency and cost-effectiveness. Adoption rates are highest in developed nations with mature regulatory landscapes and are anticipated to increase significantly in developing economies. Technological disruptions, such as the integration of AI and IoT in air pollution control systems, are reshaping the market landscape. Shifting consumer preferences towards environmentally friendly solutions are further driving market growth.
Dominant Regions, Countries, or Segments in Air Pollution Control System Industry
The Asia-Pacific region is projected to dominate the Air Pollution Control System market during the forecast period, driven by rapid industrialization and increasing investments in infrastructure development. Within this region, China and India are expected to be the leading countries. In terms of segments, the Power Generation application segment holds the largest market share, followed by the Cement Industry. The Electrostatic Precipitators (ESP) type segment also dominates in terms of market share, however, the Selective Catalytic Reduction (SCR) segment is projected to register the highest growth rate due to increasing demand for efficient NOx reduction.
- Key Drivers for Asia-Pacific Dominance: Rapid industrialization, substantial infrastructure development, and rising government investments in environmental protection.
- Power Generation Segment Dominance: Driven by the large-scale adoption of air pollution control systems in thermal power plants globally.
- ESP Segment Dominance: Cost-effectiveness and established technology contribute to its significant market share.
- SCR Segment High Growth: Increasing stringency of NOx emission standards drives demand for efficient SCR technology.
Air Pollution Control System Industry Product Landscape
The Air Pollution Control System market showcases continuous product innovation, focusing on enhanced efficiency, reduced operational costs, and improved environmental performance. Recent advancements include the integration of advanced materials, smart sensors, and data analytics for real-time monitoring and optimization. Unique selling propositions include lower energy consumption, reduced maintenance requirements, and improved dust/pollutant removal efficiency. Technological advancements like AI-powered predictive maintenance and IoT-enabled remote monitoring are gaining traction.
Key Drivers, Barriers & Challenges in Air Pollution Control System Industry
Key Drivers: Stringent environmental regulations, growing industrialization, rising energy demand, and increasing awareness of air pollution's health impacts are key drivers. Government incentives and subsidies also play a significant role.
Challenges: High initial investment costs, complex installation processes, and the need for skilled workforce can impede adoption. Technological limitations in handling specific pollutants and the fluctuating prices of raw materials pose additional challenges. Supply chain disruptions can lead to production delays and increased costs. Intense competition and the potential for regulatory changes present further uncertainty. Estimated impact of supply chain issues on market growth: xx%.
Emerging Opportunities in Air Pollution Control System Industry
Emerging opportunities lie in developing advanced air pollution control technologies for emerging pollutants, exploring innovative financing models for large-scale projects, and expanding into untapped markets in developing economies. The increasing demand for customized solutions and the integration of air pollution control systems with other environmental technologies create further opportunities. Focus on developing environmentally friendly and cost-effective solutions tailored to specific industrial needs will enhance the appeal of such systems.
Growth Accelerators in the Air Pollution Control System Industry
Strategic partnerships between technology providers and industrial end-users can facilitate faster adoption and innovation. Investments in research and development to improve efficiency and reduce costs are vital for long-term growth. Market expansion into developing economies through targeted marketing and localization strategies can unlock substantial growth potential. Technological breakthroughs, such as the application of nanotechnology and advanced materials in air pollution control systems, will drive the industry's evolution.
Key Players Shaping the Air Pollution Control System Market
- Thermax Ltd
- Pure Air Solutions
- Gea Bischoff
- General Electric
- Ducon Technologies Inc
- Horiba Ltd
- Hamon Corporation
- Andritz AG
- Siemens AG
- Mitsubishi Hitachi Power Systems Ltd
- Calgon Carbon Corporation
- Fujian Longking Co Ltd
- Babcock & Wilcox Enterprises Inc
- Tri-mer
- Amec Foster Wheeler
- Esco International
Notable Milestones in Air Pollution Control System Industry Sector
- 2020: Introduction of a new generation of ESP technology with significantly improved efficiency by Thermax Ltd.
- 2022: Merger between two key players in the FGD market, resulting in increased market share.
- 2023: Launch of an innovative SCR system with integrated AI-based monitoring by General Electric.
- 2024: Implementation of stricter emission standards in several key regions, driving demand for advanced air pollution control solutions.
In-Depth Air Pollution Control System Industry Market Outlook
The future of the Air Pollution Control System market is bright, with sustained growth projected over the forecast period. Technological advancements, coupled with stringent environmental regulations and increasing industrialization, will continue to drive demand. Strategic partnerships, focused innovation, and market expansion into developing economies present significant opportunities for growth and profitability. The market's future success hinges on the ability of companies to develop and deploy cost-effective, high-efficiency solutions that meet the diverse needs of industrial end-users.
Air Pollution Control System Industry Segmentation
-
1. Application
- 1.1. Power Generation
- 1.2. Cement Industry
- 1.3. Iron & Steel Industry
- 1.4. Chemical Industry
- 1.5. Others
-
2. Type
- 2.1. Electrostatic Precipitators (ESP)
- 2.2. Flue Gas Desulfurization (FGD)
- 2.3. Scrubbers
- 2.4. Selective Catalytic Reduction (SCR)
- 2.5. Fabric Filters
Air Pollution Control System Industry Segmentation By Geography
-
1. North America
- 1.1. United States
- 1.2. Canada
- 1.3. Rest of North America
-
2. Asia Pacific
- 2.1. India
- 2.2. China
- 2.3. Japan
- 2.4. Australia
- 2.5. Rest of Asia Pacific
-
3. Europe
- 3.1. Germany
- 3.2. France
- 3.3. United Kingdom
- 3.4. Italy
- 3.5. Rest of Europe
-
4. South America
- 4.1. Brazil
- 4.2. Argentina
- 4.3. Chile
- 4.4. Rest of South America
-
5. Middle East and Africa
- 5.1. Saudi Arabia
- 5.2. South Africa
- 5.3. Algeria
- 5.4. Rest of Middle East and Africa
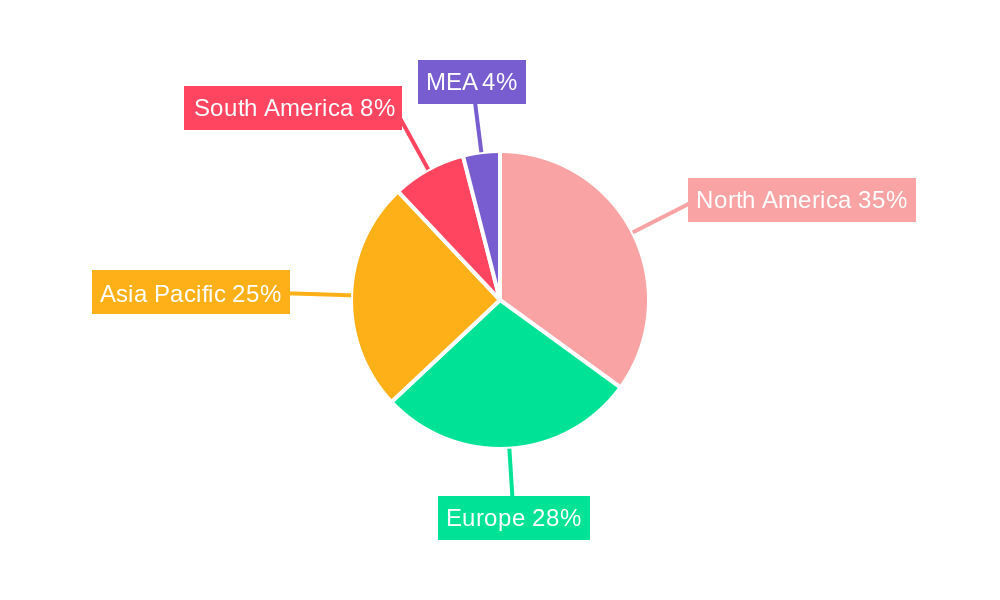
Air Pollution Control System Industry Regional Market Share
Geographic Coverage of Air Pollution Control System Industry
Air Pollution Control System Industry REPORT HIGHLIGHTS
| Aspects | Details |
|---|---|
| Study Period | 2020-2034 |
| Base Year | 2025 |
| Estimated Year | 2026 |
| Forecast Period | 2026-2034 |
| Historical Period | 2020-2025 |
| Growth Rate | CAGR of 6.3% from 2020-2034 |
| Segmentation |
|
Table of Contents
- 1. Introduction
- 1.1. Research Scope
- 1.2. Market Segmentation
- 1.3. Research Objective
- 1.4. Definitions and Assumptions
- 2. Executive Summary
- 2.1. Market Snapshot
- 3. Market Dynamics
- 3.1. Market Drivers
- 3.2. Market Restrains
- 3.3. Market Trends
- 3.4. Market Opportunities
- 4. Market Factor Analysis
- 4.1. Porters Five Forces
- 4.1.1. Bargaining Power of Suppliers
- 4.1.2. Bargaining Power of Buyers
- 4.1.3. Threat of New Entrants
- 4.1.4. Threat of Substitutes
- 4.1.5. Competitive Rivalry
- 4.2. PESTEL analysis
- 4.3. BCG Analysis
- 4.3.1. Stars (High Growth, High Market Share)
- 4.3.2. Cash Cows (Low Growth, High Market Share)
- 4.3.3. Question Mark (High Growth, Low Market Share)
- 4.3.4. Dogs (Low Growth, Low Market Share)
- 4.4. Ansoff Matrix Analysis
- 4.5. Supply Chain Analysis
- 4.6. Regulatory Landscape
- 4.7. Current Market Potential and Opportunity Assessment (TAM–SAM–SOM Framework)
- 4.8. IMR Analyst Note
- 4.1. Porters Five Forces
- 5. Market Analysis, Insights and Forecast 2021-2033
- 5.1. Market Analysis, Insights and Forecast - by Application
- 5.1.1. Power Generation
- 5.1.2. Cement Industry
- 5.1.3. Iron & Steel Industry
- 5.1.4. Chemical Industry
- 5.1.5. Others
- 5.2. Market Analysis, Insights and Forecast - by Type
- 5.2.1. Electrostatic Precipitators (ESP)
- 5.2.2. Flue Gas Desulfurization (FGD)
- 5.2.3. Scrubbers
- 5.2.4. Selective Catalytic Reduction (SCR)
- 5.2.5. Fabric Filters
- 5.3. Market Analysis, Insights and Forecast - by Region
- 5.3.1. North America
- 5.3.2. Asia Pacific
- 5.3.3. Europe
- 5.3.4. South America
- 5.3.5. Middle East and Africa
- 5.1. Market Analysis, Insights and Forecast - by Application
- 6. Global Air Pollution Control System Industry Analysis, Insights and Forecast, 2021-2033
- 6.1. Market Analysis, Insights and Forecast - by Application
- 6.1.1. Power Generation
- 6.1.2. Cement Industry
- 6.1.3. Iron & Steel Industry
- 6.1.4. Chemical Industry
- 6.1.5. Others
- 6.2. Market Analysis, Insights and Forecast - by Type
- 6.2.1. Electrostatic Precipitators (ESP)
- 6.2.2. Flue Gas Desulfurization (FGD)
- 6.2.3. Scrubbers
- 6.2.4. Selective Catalytic Reduction (SCR)
- 6.2.5. Fabric Filters
- 6.1. Market Analysis, Insights and Forecast - by Application
- 7. North America Air Pollution Control System Industry Analysis, Insights and Forecast, 2020-2032
- 7.1. Market Analysis, Insights and Forecast - by Application
- 7.1.1. Power Generation
- 7.1.2. Cement Industry
- 7.1.3. Iron & Steel Industry
- 7.1.4. Chemical Industry
- 7.1.5. Others
- 7.2. Market Analysis, Insights and Forecast - by Type
- 7.2.1. Electrostatic Precipitators (ESP)
- 7.2.2. Flue Gas Desulfurization (FGD)
- 7.2.3. Scrubbers
- 7.2.4. Selective Catalytic Reduction (SCR)
- 7.2.5. Fabric Filters
- 7.1. Market Analysis, Insights and Forecast - by Application
- 8. Asia Pacific Air Pollution Control System Industry Analysis, Insights and Forecast, 2020-2032
- 8.1. Market Analysis, Insights and Forecast - by Application
- 8.1.1. Power Generation
- 8.1.2. Cement Industry
- 8.1.3. Iron & Steel Industry
- 8.1.4. Chemical Industry
- 8.1.5. Others
- 8.2. Market Analysis, Insights and Forecast - by Type
- 8.2.1. Electrostatic Precipitators (ESP)
- 8.2.2. Flue Gas Desulfurization (FGD)
- 8.2.3. Scrubbers
- 8.2.4. Selective Catalytic Reduction (SCR)
- 8.2.5. Fabric Filters
- 8.1. Market Analysis, Insights and Forecast - by Application
- 9. Europe Air Pollution Control System Industry Analysis, Insights and Forecast, 2020-2032
- 9.1. Market Analysis, Insights and Forecast - by Application
- 9.1.1. Power Generation
- 9.1.2. Cement Industry
- 9.1.3. Iron & Steel Industry
- 9.1.4. Chemical Industry
- 9.1.5. Others
- 9.2. Market Analysis, Insights and Forecast - by Type
- 9.2.1. Electrostatic Precipitators (ESP)
- 9.2.2. Flue Gas Desulfurization (FGD)
- 9.2.3. Scrubbers
- 9.2.4. Selective Catalytic Reduction (SCR)
- 9.2.5. Fabric Filters
- 9.1. Market Analysis, Insights and Forecast - by Application
- 10. South America Air Pollution Control System Industry Analysis, Insights and Forecast, 2020-2032
- 10.1. Market Analysis, Insights and Forecast - by Application
- 10.1.1. Power Generation
- 10.1.2. Cement Industry
- 10.1.3. Iron & Steel Industry
- 10.1.4. Chemical Industry
- 10.1.5. Others
- 10.2. Market Analysis, Insights and Forecast - by Type
- 10.2.1. Electrostatic Precipitators (ESP)
- 10.2.2. Flue Gas Desulfurization (FGD)
- 10.2.3. Scrubbers
- 10.2.4. Selective Catalytic Reduction (SCR)
- 10.2.5. Fabric Filters
- 10.1. Market Analysis, Insights and Forecast - by Application
- 11. Middle East and Africa Air Pollution Control System Industry Analysis, Insights and Forecast, 2020-2032
- 11.1. Market Analysis, Insights and Forecast - by Application
- 11.1.1. Power Generation
- 11.1.2. Cement Industry
- 11.1.3. Iron & Steel Industry
- 11.1.4. Chemical Industry
- 11.1.5. Others
- 11.2. Market Analysis, Insights and Forecast - by Type
- 11.2.1. Electrostatic Precipitators (ESP)
- 11.2.2. Flue Gas Desulfurization (FGD)
- 11.2.3. Scrubbers
- 11.2.4. Selective Catalytic Reduction (SCR)
- 11.2.5. Fabric Filters
- 11.1. Market Analysis, Insights and Forecast - by Application
- 12. Competitive Analysis
- 12.1. Company Profiles
- 12.1.1 Thermax Ltd
- 12.1.1.1. Company Overview
- 12.1.1.2. Products
- 12.1.1.3. Company Financials
- 12.1.1.4. SWOT Analysis
- 12.1.2 Pure Air Solutions
- 12.1.2.1. Company Overview
- 12.1.2.2. Products
- 12.1.2.3. Company Financials
- 12.1.2.4. SWOT Analysis
- 12.1.3 Gea Bischoff
- 12.1.3.1. Company Overview
- 12.1.3.2. Products
- 12.1.3.3. Company Financials
- 12.1.3.4. SWOT Analysis
- 12.1.4 General Electric
- 12.1.4.1. Company Overview
- 12.1.4.2. Products
- 12.1.4.3. Company Financials
- 12.1.4.4. SWOT Analysis
- 12.1.5 Ducon Technologies Inc
- 12.1.5.1. Company Overview
- 12.1.5.2. Products
- 12.1.5.3. Company Financials
- 12.1.5.4. SWOT Analysis
- 12.1.6 Horiba Ltd
- 12.1.6.1. Company Overview
- 12.1.6.2. Products
- 12.1.6.3. Company Financials
- 12.1.6.4. SWOT Analysis
- 12.1.7 Hamon Corporation
- 12.1.7.1. Company Overview
- 12.1.7.2. Products
- 12.1.7.3. Company Financials
- 12.1.7.4. SWOT Analysis
- 12.1.8 Andritz Ag
- 12.1.8.1. Company Overview
- 12.1.8.2. Products
- 12.1.8.3. Company Financials
- 12.1.8.4. SWOT Analysis
- 12.1.9 Siemens AG
- 12.1.9.1. Company Overview
- 12.1.9.2. Products
- 12.1.9.3. Company Financials
- 12.1.9.4. SWOT Analysis
- 12.1.10 Mitsubishi Hitachi Power Systems Ltd
- 12.1.10.1. Company Overview
- 12.1.10.2. Products
- 12.1.10.3. Company Financials
- 12.1.10.4. SWOT Analysis
- 12.1.11 Calgon Carbon Corporation
- 12.1.11.1. Company Overview
- 12.1.11.2. Products
- 12.1.11.3. Company Financials
- 12.1.11.4. SWOT Analysis
- 12.1.12 Fujian Longking Co Ltd
- 12.1.12.1. Company Overview
- 12.1.12.2. Products
- 12.1.12.3. Company Financials
- 12.1.12.4. SWOT Analysis
- 12.1.13 Babcock & Wilcox Enterprises Inc
- 12.1.13.1. Company Overview
- 12.1.13.2. Products
- 12.1.13.3. Company Financials
- 12.1.13.4. SWOT Analysis
- 12.1.14 Tri-mer
- 12.1.14.1. Company Overview
- 12.1.14.2. Products
- 12.1.14.3. Company Financials
- 12.1.14.4. SWOT Analysis
- 12.1.15 Amec Foster Wheeler
- 12.1.15.1. Company Overview
- 12.1.15.2. Products
- 12.1.15.3. Company Financials
- 12.1.15.4. SWOT Analysis
- 12.1.16 Esco International
- 12.1.16.1. Company Overview
- 12.1.16.2. Products
- 12.1.16.3. Company Financials
- 12.1.16.4. SWOT Analysis
- 12.1.1 Thermax Ltd
- 12.2. Market Entropy
- 12.2.1 Company's Key Areas Served
- 12.2.2 Recent Developments
- 12.3. Company Market Share Analysis 2025
- 12.3.1 Top 5 Companies Market Share Analysis
- 12.3.2 Top 3 Companies Market Share Analysis
- 12.4. List of Potential Customers
- 13. Research Methodology
List of Figures
- Figure 1: Global Air Pollution Control System Industry Revenue Breakdown (billion, %) by Region 2025 & 2033
- Figure 2: North America Air Pollution Control System Industry Revenue (billion), by Application 2025 & 2033
- Figure 3: North America Air Pollution Control System Industry Revenue Share (%), by Application 2025 & 2033
- Figure 4: North America Air Pollution Control System Industry Revenue (billion), by Type 2025 & 2033
- Figure 5: North America Air Pollution Control System Industry Revenue Share (%), by Type 2025 & 2033
- Figure 6: North America Air Pollution Control System Industry Revenue (billion), by Country 2025 & 2033
- Figure 7: North America Air Pollution Control System Industry Revenue Share (%), by Country 2025 & 2033
- Figure 8: Asia Pacific Air Pollution Control System Industry Revenue (billion), by Application 2025 & 2033
- Figure 9: Asia Pacific Air Pollution Control System Industry Revenue Share (%), by Application 2025 & 2033
- Figure 10: Asia Pacific Air Pollution Control System Industry Revenue (billion), by Type 2025 & 2033
- Figure 11: Asia Pacific Air Pollution Control System Industry Revenue Share (%), by Type 2025 & 2033
- Figure 12: Asia Pacific Air Pollution Control System Industry Revenue (billion), by Country 2025 & 2033
- Figure 13: Asia Pacific Air Pollution Control System Industry Revenue Share (%), by Country 2025 & 2033
- Figure 14: Europe Air Pollution Control System Industry Revenue (billion), by Application 2025 & 2033
- Figure 15: Europe Air Pollution Control System Industry Revenue Share (%), by Application 2025 & 2033
- Figure 16: Europe Air Pollution Control System Industry Revenue (billion), by Type 2025 & 2033
- Figure 17: Europe Air Pollution Control System Industry Revenue Share (%), by Type 2025 & 2033
- Figure 18: Europe Air Pollution Control System Industry Revenue (billion), by Country 2025 & 2033
- Figure 19: Europe Air Pollution Control System Industry Revenue Share (%), by Country 2025 & 2033
- Figure 20: South America Air Pollution Control System Industry Revenue (billion), by Application 2025 & 2033
- Figure 21: South America Air Pollution Control System Industry Revenue Share (%), by Application 2025 & 2033
- Figure 22: South America Air Pollution Control System Industry Revenue (billion), by Type 2025 & 2033
- Figure 23: South America Air Pollution Control System Industry Revenue Share (%), by Type 2025 & 2033
- Figure 24: South America Air Pollution Control System Industry Revenue (billion), by Country 2025 & 2033
- Figure 25: South America Air Pollution Control System Industry Revenue Share (%), by Country 2025 & 2033
- Figure 26: Middle East and Africa Air Pollution Control System Industry Revenue (billion), by Application 2025 & 2033
- Figure 27: Middle East and Africa Air Pollution Control System Industry Revenue Share (%), by Application 2025 & 2033
- Figure 28: Middle East and Africa Air Pollution Control System Industry Revenue (billion), by Type 2025 & 2033
- Figure 29: Middle East and Africa Air Pollution Control System Industry Revenue Share (%), by Type 2025 & 2033
- Figure 30: Middle East and Africa Air Pollution Control System Industry Revenue (billion), by Country 2025 & 2033
- Figure 31: Middle East and Africa Air Pollution Control System Industry Revenue Share (%), by Country 2025 & 2033
List of Tables
- Table 1: Global Air Pollution Control System Industry Revenue billion Forecast, by Application 2020 & 2033
- Table 2: Global Air Pollution Control System Industry Revenue billion Forecast, by Type 2020 & 2033
- Table 3: Global Air Pollution Control System Industry Revenue billion Forecast, by Region 2020 & 2033
- Table 4: Global Air Pollution Control System Industry Revenue billion Forecast, by Application 2020 & 2033
- Table 5: Global Air Pollution Control System Industry Revenue billion Forecast, by Type 2020 & 2033
- Table 6: Global Air Pollution Control System Industry Revenue billion Forecast, by Country 2020 & 2033
- Table 7: United States Air Pollution Control System Industry Revenue (billion) Forecast, by Application 2020 & 2033
- Table 8: Canada Air Pollution Control System Industry Revenue (billion) Forecast, by Application 2020 & 2033
- Table 9: Rest of North America Air Pollution Control System Industry Revenue (billion) Forecast, by Application 2020 & 2033
- Table 10: Global Air Pollution Control System Industry Revenue billion Forecast, by Application 2020 & 2033
- Table 11: Global Air Pollution Control System Industry Revenue billion Forecast, by Type 2020 & 2033
- Table 12: Global Air Pollution Control System Industry Revenue billion Forecast, by Country 2020 & 2033
- Table 13: India Air Pollution Control System Industry Revenue (billion) Forecast, by Application 2020 & 2033
- Table 14: China Air Pollution Control System Industry Revenue (billion) Forecast, by Application 2020 & 2033
- Table 15: Japan Air Pollution Control System Industry Revenue (billion) Forecast, by Application 2020 & 2033
- Table 16: Australia Air Pollution Control System Industry Revenue (billion) Forecast, by Application 2020 & 2033
- Table 17: Rest of Asia Pacific Air Pollution Control System Industry Revenue (billion) Forecast, by Application 2020 & 2033
- Table 18: Global Air Pollution Control System Industry Revenue billion Forecast, by Application 2020 & 2033
- Table 19: Global Air Pollution Control System Industry Revenue billion Forecast, by Type 2020 & 2033
- Table 20: Global Air Pollution Control System Industry Revenue billion Forecast, by Country 2020 & 2033
- Table 21: Germany Air Pollution Control System Industry Revenue (billion) Forecast, by Application 2020 & 2033
- Table 22: France Air Pollution Control System Industry Revenue (billion) Forecast, by Application 2020 & 2033
- Table 23: United Kingdom Air Pollution Control System Industry Revenue (billion) Forecast, by Application 2020 & 2033
- Table 24: Italy Air Pollution Control System Industry Revenue (billion) Forecast, by Application 2020 & 2033
- Table 25: Rest of Europe Air Pollution Control System Industry Revenue (billion) Forecast, by Application 2020 & 2033
- Table 26: Global Air Pollution Control System Industry Revenue billion Forecast, by Application 2020 & 2033
- Table 27: Global Air Pollution Control System Industry Revenue billion Forecast, by Type 2020 & 2033
- Table 28: Global Air Pollution Control System Industry Revenue billion Forecast, by Country 2020 & 2033
- Table 29: Brazil Air Pollution Control System Industry Revenue (billion) Forecast, by Application 2020 & 2033
- Table 30: Argentina Air Pollution Control System Industry Revenue (billion) Forecast, by Application 2020 & 2033
- Table 31: Chile Air Pollution Control System Industry Revenue (billion) Forecast, by Application 2020 & 2033
- Table 32: Rest of South America Air Pollution Control System Industry Revenue (billion) Forecast, by Application 2020 & 2033
- Table 33: Global Air Pollution Control System Industry Revenue billion Forecast, by Application 2020 & 2033
- Table 34: Global Air Pollution Control System Industry Revenue billion Forecast, by Type 2020 & 2033
- Table 35: Global Air Pollution Control System Industry Revenue billion Forecast, by Country 2020 & 2033
- Table 36: Saudi Arabia Air Pollution Control System Industry Revenue (billion) Forecast, by Application 2020 & 2033
- Table 37: South Africa Air Pollution Control System Industry Revenue (billion) Forecast, by Application 2020 & 2033
- Table 38: Algeria Air Pollution Control System Industry Revenue (billion) Forecast, by Application 2020 & 2033
- Table 39: Rest of Middle East and Africa Air Pollution Control System Industry Revenue (billion) Forecast, by Application 2020 & 2033
Frequently Asked Questions
1. What is the projected Compound Annual Growth Rate (CAGR) of the Air Pollution Control System Industry?
The projected CAGR is approximately 6.3%.
2. Which companies are prominent players in the Air Pollution Control System Industry?
Key companies in the market include Thermax Ltd, Pure Air Solutions, Gea Bischoff, General Electric, Ducon Technologies Inc, Horiba Ltd, Hamon Corporation, Andritz Ag, Siemens AG, Mitsubishi Hitachi Power Systems Ltd, Calgon Carbon Corporation, Fujian Longking Co Ltd, Babcock & Wilcox Enterprises Inc, Tri-mer, Amec Foster Wheeler, Esco International.
3. What are the main segments of the Air Pollution Control System Industry?
The market segments include Application, Type.
4. Can you provide details about the market size?
The market size is estimated to be USD 103.66 billion as of 2022.
5. What are some drivers contributing to market growth?
4.; Increasing Amount of Waste Generation. Growing Concern for Waste Management to Meet the Needs for Sustainable Urban Living4.; Increasing Focus on Non-fossil Fuel Sources of Energy.
6. What are the notable trends driving market growth?
Increasing Demand from Power Generation Industry.
7. Are there any restraints impacting market growth?
4.; Expensive Nature of Incinerators.
8. Can you provide examples of recent developments in the market?
N/A
9. What pricing options are available for accessing the report?
Pricing options include single-user, multi-user, and enterprise licenses priced at USD 4750, USD 5250, and USD 8750 respectively.
10. Is the market size provided in terms of value or volume?
The market size is provided in terms of value, measured in billion.
11. Are there any specific market keywords associated with the report?
Yes, the market keyword associated with the report is "Air Pollution Control System Industry," which aids in identifying and referencing the specific market segment covered.
12. How do I determine which pricing option suits my needs best?
The pricing options vary based on user requirements and access needs. Individual users may opt for single-user licenses, while businesses requiring broader access may choose multi-user or enterprise licenses for cost-effective access to the report.
13. Are there any additional resources or data provided in the Air Pollution Control System Industry report?
While the report offers comprehensive insights, it's advisable to review the specific contents or supplementary materials provided to ascertain if additional resources or data are available.
14. How can I stay updated on further developments or reports in the Air Pollution Control System Industry?
To stay informed about further developments, trends, and reports in the Air Pollution Control System Industry, consider subscribing to industry newsletters, following relevant companies and organizations, or regularly checking reputable industry news sources and publications.
Methodology
Step 1 - Identification of Relevant Samples Size from Population Database


Step 2 - Approaches for Defining Global Market Size (Value, Volume* & Price*)

Note*: In applicable scenarios
Step 3 - Data Sources
Primary Research
- Web Analytics
- Survey Reports
- Research Institute
- Latest Research Reports
- Opinion Leaders
Secondary Research
- Annual Reports
- White Paper
- Latest Press Release
- Industry Association
- Paid Database
- Investor Presentations

Step 4 - Data Triangulation
Involves using different sources of information in order to increase the validity of a study
These sources are likely to be stakeholders in a program - participants, other researchers, program staff, other community members, and so on.
Then we put all data in single framework & apply various statistical tools to find out the dynamic on the market.
During the analysis stage, feedback from the stakeholder groups would be compared to determine areas of agreement as well as areas of divergence