

Key Insights
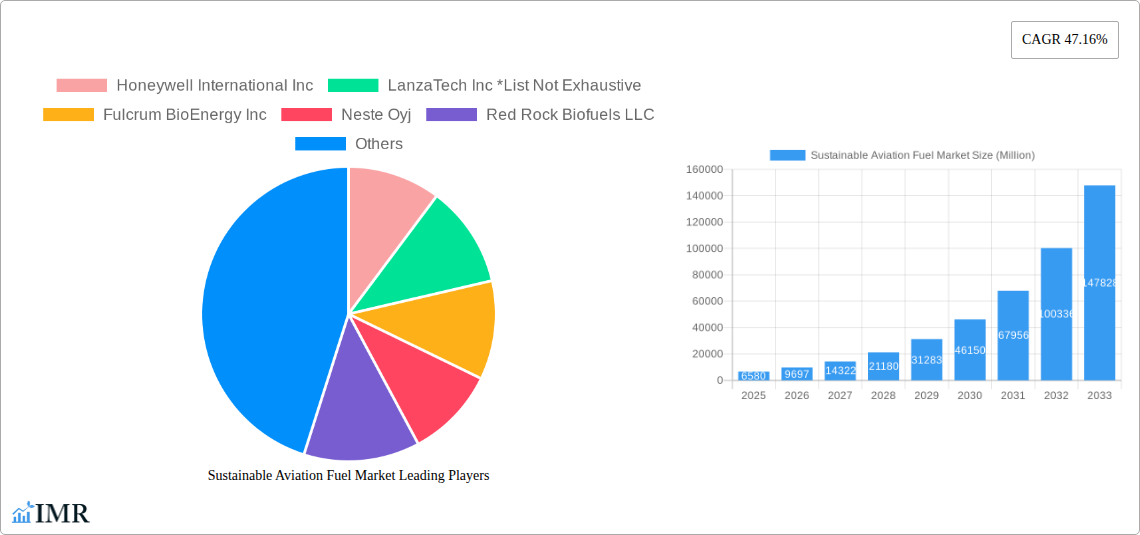
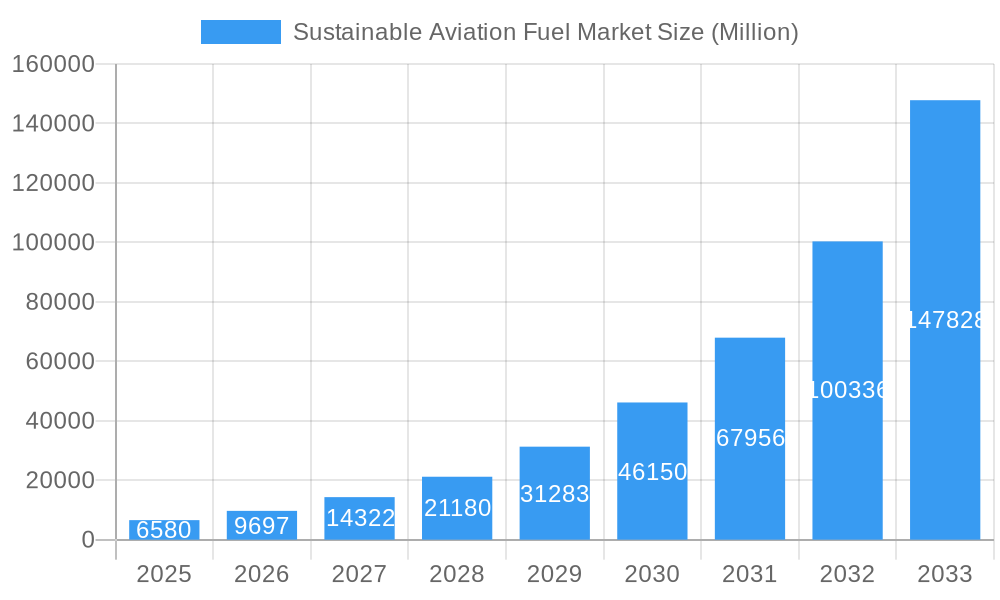
The Sustainable Aviation Fuel (SAF) market is experiencing explosive growth, projected to reach a market size of $6.58 billion in 2025 and exhibiting a remarkable Compound Annual Growth Rate (CAGR) of 47.16% from 2025 to 2033. This rapid expansion is driven by increasing environmental concerns surrounding aviation's carbon footprint, coupled with stringent government regulations aimed at reducing greenhouse gas emissions from the airline industry. Key technological advancements in SAF production, including Fischer-Tropsch (FT) synthesis, Hydroprocessed Esters and Fatty Acids (HEFA), Synthesized Iso-Paraffinic (SIP), and Alcohol-to-Jet (AJT) processes, are further fueling market growth. The commercial aviation sector currently dominates the application segment, but the defense sector is also showing significant potential for SAF adoption, driven by sustainability initiatives within military operations. Leading players like Honeywell International Inc., LanzaTech Inc., Neste Oyj, and others are actively investing in research and development, expanding production capacity, and forging strategic partnerships to capitalize on this burgeoning market. The geographical distribution of the market is diverse, with North America, Europe, and Asia-Pacific representing major regional contributors, fueled by supportive government policies, robust infrastructure, and a high concentration of key players.
Sustainable Aviation Fuel Market Market Size (In Billion)
The continued growth of the SAF market hinges on several factors. Further technological breakthroughs leading to cost reductions in SAF production are critical for wider adoption. Government incentives, such as tax credits and mandates for SAF blending in jet fuel, will play a vital role in stimulating demand. Collaboration between airlines, fuel producers, and technology developers is essential for establishing a robust and sustainable SAF supply chain. Overcoming challenges related to feedstock availability and scalability of production remain key considerations for the industry. The sustained focus on sustainable practices and the increasing consumer preference for environmentally friendly travel will continue to drive the market's impressive trajectory in the coming years.
Sustainable Aviation Fuel Market Company Market Share
Sustainable Aviation Fuel Market: A Comprehensive Report (2019-2033)
This comprehensive report provides a detailed analysis of the Sustainable Aviation Fuel (SAF) market, encompassing market dynamics, growth trends, regional dominance, product landscape, key challenges, emerging opportunities, and key players. The study period covers 2019-2033, with 2025 as the base and estimated year. This report is invaluable for industry professionals, investors, and policymakers seeking to understand and capitalize on the burgeoning SAF market. The report segments the market by technology (Fischer-Tropsch (FT), Hydroprocessed Esters and Fatty Acids (HEFA), Synthesized Iso-Paraffinic (SIP), and Alcohol-to-Jet (AJT)) and application (Commercial, Defense).
Sustainable Aviation Fuel Market Market Dynamics & Structure
The Sustainable Aviation Fuel (SAF) market is characterized by increasing market concentration as larger players consolidate their positions through mergers and acquisitions (M&A). The global SAF market size in 2024 was estimated at xx Million, and is projected to reach xx Million by 2033. Technological innovation, driven by the need for more efficient and sustainable production methods, is a key driver. Stringent regulatory frameworks, aiming to reduce aviation's carbon footprint, are also pushing market growth. However, high production costs and the availability of competitive fossil fuel alternatives pose significant challenges. The market experiences significant M&A activity, with xx major deals recorded in the past five years.
- Market Concentration: High, with a few major players dominating the market share. Leading players account for approximately xx% of the global market.
- Technological Innovation: Significant investments in research and development for improving efficiency and reducing costs across all SAF technologies.
- Regulatory Frameworks: Government mandates and carbon emission reduction targets are key drivers of market growth, including policy support programs and carbon pricing mechanisms.
- Competitive Product Substitutes: Traditional jet fuel remains a major competitor due to lower production costs.
- End-User Demographics: Primarily driven by airlines and defense organizations, with growing interest from other industries.
- M&A Trends: Increased consolidation of the market through strategic acquisitions and mergers aimed at scaling production and technology. This resulted in xx M&A deals in the past 5 years, with an average deal value of xx Million.
Sustainable Aviation Fuel Market Growth Trends & Insights
The SAF market is experiencing significant growth, driven by escalating environmental concerns and stricter regulations. The Compound Annual Growth Rate (CAGR) for the forecast period (2025-2033) is estimated at xx%. Market penetration is expected to increase from xx% in 2025 to xx% by 2033, primarily driven by increasing demand and ongoing technological advancements. The market is witnessing a shift in consumer preferences, with a growing emphasis on sustainable travel and greener alternatives. Adoption rates are rising across various segments, particularly the commercial aviation sector, spurred by airline commitments to reduce emissions. Technological disruptions, such as advancements in biofuel production and the development of power-to-liquid technologies, are further accelerating market growth.
Dominant Regions, Countries, or Segments in Sustainable Aviation Fuel Market
North America and Europe currently dominate the SAF market, driven by strong regulatory support, robust infrastructure, and significant investments in research and development. However, Asia-Pacific is expected to exhibit rapid growth in the coming years, driven by increasing air travel demand and government initiatives to promote sustainable aviation. Within technologies, HEFA currently holds the largest market share, followed by FT.
- Key Drivers (North America & Europe):
- Stringent emission reduction policies.
- Well-established aviation infrastructure.
- High investments in R&D and biofuel production.
- Key Drivers (Asia-Pacific):
- Rising air travel demand.
- Government support for renewable energy.
- Increasing awareness of environmental sustainability.
- Dominant Segment (Technology): HEFA holds the largest market share due to its relatively mature technology and existing supply chains. Market Share: HEFA - xx%, FT - xx%, SIP - xx%, AJT - xx%.
- Dominant Segment (Application): The Commercial aviation segment holds the largest market share due to the high volume of flights. Market Share: Commercial - xx%, Defense - xx%.
Sustainable Aviation Fuel Market Product Landscape
The SAF market features a diverse range of products, each with unique selling propositions. Technological advancements have led to the development of next-generation fuels with improved performance characteristics, such as higher energy density and reduced emissions. These innovations are driven by a constant focus on improving efficiency and cost-effectiveness while meeting stringent environmental standards. Key product differentiators include production methods, feedstock sources, and environmental impacts.
Key Drivers, Barriers & Challenges in Sustainable Aviation Fuel Market
Key Drivers:
- Increasing environmental regulations and carbon emission reduction targets.
- Growing consumer demand for sustainable travel options.
- Technological advancements leading to more efficient and cost-effective production.
- Government incentives and subsidies promoting SAF adoption.
Key Barriers & Challenges:
- High production costs compared to traditional jet fuel, impacting overall market penetration (xx% higher).
- Limited feedstock availability and supply chain disruptions. This is predicted to impact production by xx% in the next 5 years.
- Lack of standardized industry regulations and certification processes.
Emerging Opportunities in Sustainable Aviation Fuel Market
- Expansion into untapped markets in developing economies.
- Development of innovative applications, such as the use of SAF in hybrid-electric aircraft.
- Growing interest in power-to-liquid technologies for SAF production.
- Increased collaborations between airlines, fuel producers, and technology providers.
Growth Accelerators in the Sustainable Aviation Fuel Market Industry
Technological breakthroughs in biofuel production and power-to-liquid technologies are key growth catalysts. Strategic partnerships between airlines and fuel producers are crucial for scaling production and distribution. Government policies, including mandates and incentives, further accelerate market expansion.
Key Players Shaping the Sustainable Aviation Fuel Market Market
- Honeywell International Inc
- LanzaTech Inc
- Fulcrum BioEnergy Inc
- Neste Oyj
- Red Rock Biofuels LLC
- Swedish Biofuels AB
- SG Preston Company
- TotalEnergies SE
- Gevo Inc
Notable Milestones in Sustainable Aviation Fuel Market Sector
- May 2023: Twelve and Etihad Airways signed an MOU to advance E-Jet® fuel.
- February 2022: Engie SA and Infinium Holdings announced a EUR 500 million project for renewable aviation and maritime fuels.
- February 2022: Boeing announced a supply agreement for two million gallons of blended SAF with EPIC Fuels.
In-Depth Sustainable Aviation Fuel Market Market Outlook
The SAF market is poised for significant growth, driven by a confluence of factors including stringent environmental regulations, technological advancements, and increasing consumer demand for sustainable travel. Strategic partnerships, investments in R&D, and expansion into new markets present significant opportunities for players in this dynamic sector. The market is expected to witness considerable expansion throughout the forecast period, driven by increasing demand from both commercial and defense sectors, as well as continued technological innovation leading to greater efficiency and cost reduction.
Sustainable Aviation Fuel Market Segmentation
-
1. Technology
- 1.1. Fischer-Tropsch (FT)
- 1.2. Hydroprocessed Esters and Fatty Acids (HEFA)
- 1.3. Synthesi
-
2. Application
- 2.1. Commercial
- 2.2. Defense
Sustainable Aviation Fuel Market Segmentation By Geography
-
1. North America
- 1.1. United States of America
- 1.2. Canada
- 1.3. Rest of the North America
-
2. Asia Pacific
- 2.1. China
- 2.2. India
- 2.3. Japan
- 2.4. Rest of the Asia Pacific
-
3. Europe
- 3.1. United Kingdom
- 3.2. France
- 3.3. Germany
- 3.4. Rest of the Europe
-
4. South America
- 4.1. Brazil
- 4.2. Argentina
- 4.3. Rest of the South America
-
5. Middle East and Africa
- 5.1. United Arab Emirates
- 5.2. Saudi Arabia
- 5.3. Qatar
- 5.4. Rest of the Middle East and Africa
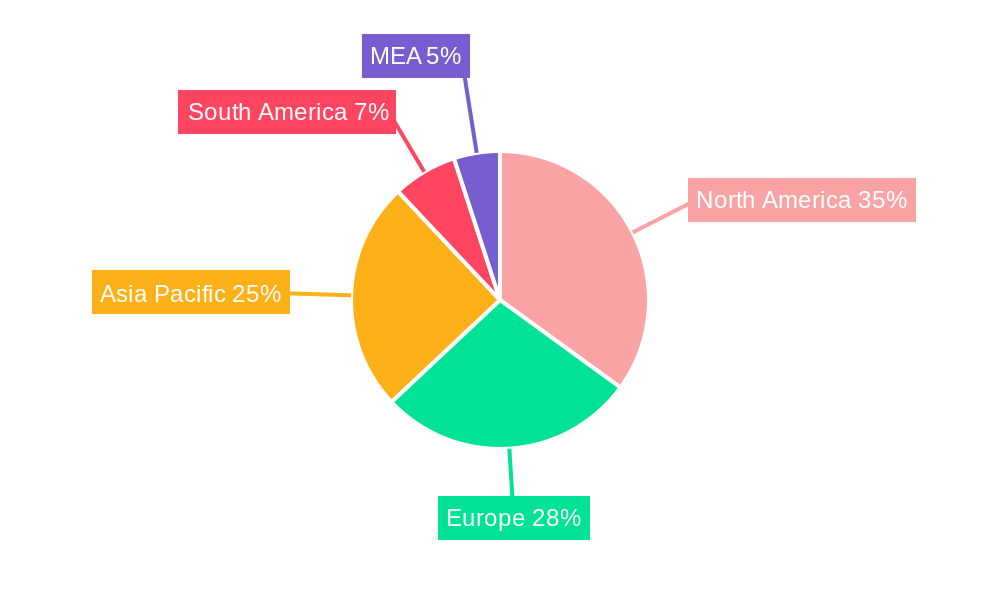
Sustainable Aviation Fuel Market Regional Market Share
Geographic Coverage of Sustainable Aviation Fuel Market
Sustainable Aviation Fuel Market REPORT HIGHLIGHTS
| Aspects | Details |
|---|---|
| Study Period | 2020-2034 |
| Base Year | 2025 |
| Estimated Year | 2026 |
| Forecast Period | 2026-2034 |
| Historical Period | 2020-2025 |
| Growth Rate | CAGR of 47.16% from 2020-2034 |
| Segmentation |
|
Table of Contents
- 1. Introduction
- 1.1. Research Scope
- 1.2. Market Segmentation
- 1.3. Research Objective
- 1.4. Definitions and Assumptions
- 2. Executive Summary
- 2.1. Market Snapshot
- 3. Market Dynamics
- 3.1. Market Drivers
- 3.2. Market Restrains
- 3.3. Market Trends
- 3.4. Market Opportunities
- 4. Market Factor Analysis
- 4.1. Porters Five Forces
- 4.1.1. Bargaining Power of Suppliers
- 4.1.2. Bargaining Power of Buyers
- 4.1.3. Threat of New Entrants
- 4.1.4. Threat of Substitutes
- 4.1.5. Competitive Rivalry
- 4.2. PESTEL analysis
- 4.3. BCG Analysis
- 4.3.1. Stars (High Growth, High Market Share)
- 4.3.2. Cash Cows (Low Growth, High Market Share)
- 4.3.3. Question Mark (High Growth, Low Market Share)
- 4.3.4. Dogs (Low Growth, Low Market Share)
- 4.4. Ansoff Matrix Analysis
- 4.5. Supply Chain Analysis
- 4.6. Regulatory Landscape
- 4.7. Current Market Potential and Opportunity Assessment (TAM–SAM–SOM Framework)
- 4.8. IMR Analyst Note
- 4.1. Porters Five Forces
- 5. Market Analysis, Insights and Forecast 2021-2033
- 5.1. Market Analysis, Insights and Forecast - by Technology
- 5.1.1. Fischer-Tropsch (FT)
- 5.1.2. Hydroprocessed Esters and Fatty Acids (HEFA)
- 5.1.3. Synthesi
- 5.2. Market Analysis, Insights and Forecast - by Application
- 5.2.1. Commercial
- 5.2.2. Defense
- 5.3. Market Analysis, Insights and Forecast - by Region
- 5.3.1. North America
- 5.3.2. Asia Pacific
- 5.3.3. Europe
- 5.3.4. South America
- 5.3.5. Middle East and Africa
- 5.1. Market Analysis, Insights and Forecast - by Technology
- 6. Global Sustainable Aviation Fuel Market Analysis, Insights and Forecast, 2021-2033
- 6.1. Market Analysis, Insights and Forecast - by Technology
- 6.1.1. Fischer-Tropsch (FT)
- 6.1.2. Hydroprocessed Esters and Fatty Acids (HEFA)
- 6.1.3. Synthesi
- 6.2. Market Analysis, Insights and Forecast - by Application
- 6.2.1. Commercial
- 6.2.2. Defense
- 6.1. Market Analysis, Insights and Forecast - by Technology
- 7. North America Sustainable Aviation Fuel Market Analysis, Insights and Forecast, 2020-2032
- 7.1. Market Analysis, Insights and Forecast - by Technology
- 7.1.1. Fischer-Tropsch (FT)
- 7.1.2. Hydroprocessed Esters and Fatty Acids (HEFA)
- 7.1.3. Synthesi
- 7.2. Market Analysis, Insights and Forecast - by Application
- 7.2.1. Commercial
- 7.2.2. Defense
- 7.1. Market Analysis, Insights and Forecast - by Technology
- 8. Asia Pacific Sustainable Aviation Fuel Market Analysis, Insights and Forecast, 2020-2032
- 8.1. Market Analysis, Insights and Forecast - by Technology
- 8.1.1. Fischer-Tropsch (FT)
- 8.1.2. Hydroprocessed Esters and Fatty Acids (HEFA)
- 8.1.3. Synthesi
- 8.2. Market Analysis, Insights and Forecast - by Application
- 8.2.1. Commercial
- 8.2.2. Defense
- 8.1. Market Analysis, Insights and Forecast - by Technology
- 9. Europe Sustainable Aviation Fuel Market Analysis, Insights and Forecast, 2020-2032
- 9.1. Market Analysis, Insights and Forecast - by Technology
- 9.1.1. Fischer-Tropsch (FT)
- 9.1.2. Hydroprocessed Esters and Fatty Acids (HEFA)
- 9.1.3. Synthesi
- 9.2. Market Analysis, Insights and Forecast - by Application
- 9.2.1. Commercial
- 9.2.2. Defense
- 9.1. Market Analysis, Insights and Forecast - by Technology
- 10. South America Sustainable Aviation Fuel Market Analysis, Insights and Forecast, 2020-2032
- 10.1. Market Analysis, Insights and Forecast - by Technology
- 10.1.1. Fischer-Tropsch (FT)
- 10.1.2. Hydroprocessed Esters and Fatty Acids (HEFA)
- 10.1.3. Synthesi
- 10.2. Market Analysis, Insights and Forecast - by Application
- 10.2.1. Commercial
- 10.2.2. Defense
- 10.1. Market Analysis, Insights and Forecast - by Technology
- 11. Middle East and Africa Sustainable Aviation Fuel Market Analysis, Insights and Forecast, 2020-2032
- 11.1. Market Analysis, Insights and Forecast - by Technology
- 11.1.1. Fischer-Tropsch (FT)
- 11.1.2. Hydroprocessed Esters and Fatty Acids (HEFA)
- 11.1.3. Synthesi
- 11.2. Market Analysis, Insights and Forecast - by Application
- 11.2.1. Commercial
- 11.2.2. Defense
- 11.1. Market Analysis, Insights and Forecast - by Technology
- 12. Competitive Analysis
- 12.1. Company Profiles
- 12.1.1 Honeywell International Inc
- 12.1.1.1. Company Overview
- 12.1.1.2. Products
- 12.1.1.3. Company Financials
- 12.1.1.4. SWOT Analysis
- 12.1.2 LanzaTech Inc *List Not Exhaustive
- 12.1.2.1. Company Overview
- 12.1.2.2. Products
- 12.1.2.3. Company Financials
- 12.1.2.4. SWOT Analysis
- 12.1.3 Fulcrum BioEnergy Inc
- 12.1.3.1. Company Overview
- 12.1.3.2. Products
- 12.1.3.3. Company Financials
- 12.1.3.4. SWOT Analysis
- 12.1.4 Neste Oyj
- 12.1.4.1. Company Overview
- 12.1.4.2. Products
- 12.1.4.3. Company Financials
- 12.1.4.4. SWOT Analysis
- 12.1.5 Red Rock Biofuels LLC
- 12.1.5.1. Company Overview
- 12.1.5.2. Products
- 12.1.5.3. Company Financials
- 12.1.5.4. SWOT Analysis
- 12.1.6 Swedish Biofuels AB
- 12.1.6.1. Company Overview
- 12.1.6.2. Products
- 12.1.6.3. Company Financials
- 12.1.6.4. SWOT Analysis
- 12.1.7 SG Preston Company
- 12.1.7.1. Company Overview
- 12.1.7.2. Products
- 12.1.7.3. Company Financials
- 12.1.7.4. SWOT Analysis
- 12.1.8 TotalEnergies SE
- 12.1.8.1. Company Overview
- 12.1.8.2. Products
- 12.1.8.3. Company Financials
- 12.1.8.4. SWOT Analysis
- 12.1.9 Gevo Inc
- 12.1.9.1. Company Overview
- 12.1.9.2. Products
- 12.1.9.3. Company Financials
- 12.1.9.4. SWOT Analysis
- 12.1.1 Honeywell International Inc
- 12.2. Market Entropy
- 12.2.1 Company's Key Areas Served
- 12.2.2 Recent Developments
- 12.3. Company Market Share Analysis 2025
- 12.3.1 Top 5 Companies Market Share Analysis
- 12.3.2 Top 3 Companies Market Share Analysis
- 12.4. List of Potential Customers
- 13. Research Methodology
List of Figures
- Figure 1: Global Sustainable Aviation Fuel Market Revenue Breakdown (Million, %) by Region 2025 & 2033
- Figure 2: North America Sustainable Aviation Fuel Market Revenue (Million), by Technology 2025 & 2033
- Figure 3: North America Sustainable Aviation Fuel Market Revenue Share (%), by Technology 2025 & 2033
- Figure 4: North America Sustainable Aviation Fuel Market Revenue (Million), by Application 2025 & 2033
- Figure 5: North America Sustainable Aviation Fuel Market Revenue Share (%), by Application 2025 & 2033
- Figure 6: North America Sustainable Aviation Fuel Market Revenue (Million), by Country 2025 & 2033
- Figure 7: North America Sustainable Aviation Fuel Market Revenue Share (%), by Country 2025 & 2033
- Figure 8: Asia Pacific Sustainable Aviation Fuel Market Revenue (Million), by Technology 2025 & 2033
- Figure 9: Asia Pacific Sustainable Aviation Fuel Market Revenue Share (%), by Technology 2025 & 2033
- Figure 10: Asia Pacific Sustainable Aviation Fuel Market Revenue (Million), by Application 2025 & 2033
- Figure 11: Asia Pacific Sustainable Aviation Fuel Market Revenue Share (%), by Application 2025 & 2033
- Figure 12: Asia Pacific Sustainable Aviation Fuel Market Revenue (Million), by Country 2025 & 2033
- Figure 13: Asia Pacific Sustainable Aviation Fuel Market Revenue Share (%), by Country 2025 & 2033
- Figure 14: Europe Sustainable Aviation Fuel Market Revenue (Million), by Technology 2025 & 2033
- Figure 15: Europe Sustainable Aviation Fuel Market Revenue Share (%), by Technology 2025 & 2033
- Figure 16: Europe Sustainable Aviation Fuel Market Revenue (Million), by Application 2025 & 2033
- Figure 17: Europe Sustainable Aviation Fuel Market Revenue Share (%), by Application 2025 & 2033
- Figure 18: Europe Sustainable Aviation Fuel Market Revenue (Million), by Country 2025 & 2033
- Figure 19: Europe Sustainable Aviation Fuel Market Revenue Share (%), by Country 2025 & 2033
- Figure 20: South America Sustainable Aviation Fuel Market Revenue (Million), by Technology 2025 & 2033
- Figure 21: South America Sustainable Aviation Fuel Market Revenue Share (%), by Technology 2025 & 2033
- Figure 22: South America Sustainable Aviation Fuel Market Revenue (Million), by Application 2025 & 2033
- Figure 23: South America Sustainable Aviation Fuel Market Revenue Share (%), by Application 2025 & 2033
- Figure 24: South America Sustainable Aviation Fuel Market Revenue (Million), by Country 2025 & 2033
- Figure 25: South America Sustainable Aviation Fuel Market Revenue Share (%), by Country 2025 & 2033
- Figure 26: Middle East and Africa Sustainable Aviation Fuel Market Revenue (Million), by Technology 2025 & 2033
- Figure 27: Middle East and Africa Sustainable Aviation Fuel Market Revenue Share (%), by Technology 2025 & 2033
- Figure 28: Middle East and Africa Sustainable Aviation Fuel Market Revenue (Million), by Application 2025 & 2033
- Figure 29: Middle East and Africa Sustainable Aviation Fuel Market Revenue Share (%), by Application 2025 & 2033
- Figure 30: Middle East and Africa Sustainable Aviation Fuel Market Revenue (Million), by Country 2025 & 2033
- Figure 31: Middle East and Africa Sustainable Aviation Fuel Market Revenue Share (%), by Country 2025 & 2033
List of Tables
- Table 1: Global Sustainable Aviation Fuel Market Revenue Million Forecast, by Technology 2020 & 2033
- Table 2: Global Sustainable Aviation Fuel Market Revenue Million Forecast, by Application 2020 & 2033
- Table 3: Global Sustainable Aviation Fuel Market Revenue Million Forecast, by Region 2020 & 2033
- Table 4: Global Sustainable Aviation Fuel Market Revenue Million Forecast, by Technology 2020 & 2033
- Table 5: Global Sustainable Aviation Fuel Market Revenue Million Forecast, by Application 2020 & 2033
- Table 6: Global Sustainable Aviation Fuel Market Revenue Million Forecast, by Country 2020 & 2033
- Table 7: United States of America Sustainable Aviation Fuel Market Revenue (Million) Forecast, by Application 2020 & 2033
- Table 8: Canada Sustainable Aviation Fuel Market Revenue (Million) Forecast, by Application 2020 & 2033
- Table 9: Rest of the North America Sustainable Aviation Fuel Market Revenue (Million) Forecast, by Application 2020 & 2033
- Table 10: Global Sustainable Aviation Fuel Market Revenue Million Forecast, by Technology 2020 & 2033
- Table 11: Global Sustainable Aviation Fuel Market Revenue Million Forecast, by Application 2020 & 2033
- Table 12: Global Sustainable Aviation Fuel Market Revenue Million Forecast, by Country 2020 & 2033
- Table 13: China Sustainable Aviation Fuel Market Revenue (Million) Forecast, by Application 2020 & 2033
- Table 14: India Sustainable Aviation Fuel Market Revenue (Million) Forecast, by Application 2020 & 2033
- Table 15: Japan Sustainable Aviation Fuel Market Revenue (Million) Forecast, by Application 2020 & 2033
- Table 16: Rest of the Asia Pacific Sustainable Aviation Fuel Market Revenue (Million) Forecast, by Application 2020 & 2033
- Table 17: Global Sustainable Aviation Fuel Market Revenue Million Forecast, by Technology 2020 & 2033
- Table 18: Global Sustainable Aviation Fuel Market Revenue Million Forecast, by Application 2020 & 2033
- Table 19: Global Sustainable Aviation Fuel Market Revenue Million Forecast, by Country 2020 & 2033
- Table 20: United Kingdom Sustainable Aviation Fuel Market Revenue (Million) Forecast, by Application 2020 & 2033
- Table 21: France Sustainable Aviation Fuel Market Revenue (Million) Forecast, by Application 2020 & 2033
- Table 22: Germany Sustainable Aviation Fuel Market Revenue (Million) Forecast, by Application 2020 & 2033
- Table 23: Rest of the Europe Sustainable Aviation Fuel Market Revenue (Million) Forecast, by Application 2020 & 2033
- Table 24: Global Sustainable Aviation Fuel Market Revenue Million Forecast, by Technology 2020 & 2033
- Table 25: Global Sustainable Aviation Fuel Market Revenue Million Forecast, by Application 2020 & 2033
- Table 26: Global Sustainable Aviation Fuel Market Revenue Million Forecast, by Country 2020 & 2033
- Table 27: Brazil Sustainable Aviation Fuel Market Revenue (Million) Forecast, by Application 2020 & 2033
- Table 28: Argentina Sustainable Aviation Fuel Market Revenue (Million) Forecast, by Application 2020 & 2033
- Table 29: Rest of the South America Sustainable Aviation Fuel Market Revenue (Million) Forecast, by Application 2020 & 2033
- Table 30: Global Sustainable Aviation Fuel Market Revenue Million Forecast, by Technology 2020 & 2033
- Table 31: Global Sustainable Aviation Fuel Market Revenue Million Forecast, by Application 2020 & 2033
- Table 32: Global Sustainable Aviation Fuel Market Revenue Million Forecast, by Country 2020 & 2033
- Table 33: United Arab Emirates Sustainable Aviation Fuel Market Revenue (Million) Forecast, by Application 2020 & 2033
- Table 34: Saudi Arabia Sustainable Aviation Fuel Market Revenue (Million) Forecast, by Application 2020 & 2033
- Table 35: Qatar Sustainable Aviation Fuel Market Revenue (Million) Forecast, by Application 2020 & 2033
- Table 36: Rest of the Middle East and Africa Sustainable Aviation Fuel Market Revenue (Million) Forecast, by Application 2020 & 2033
Frequently Asked Questions
1. What is the projected Compound Annual Growth Rate (CAGR) of the Sustainable Aviation Fuel Market?
The projected CAGR is approximately 47.16%.
2. Which companies are prominent players in the Sustainable Aviation Fuel Market?
Key companies in the market include Honeywell International Inc, LanzaTech Inc *List Not Exhaustive, Fulcrum BioEnergy Inc, Neste Oyj, Red Rock Biofuels LLC, Swedish Biofuels AB, SG Preston Company, TotalEnergies SE, Gevo Inc.
3. What are the main segments of the Sustainable Aviation Fuel Market?
The market segments include Technology, Application.
4. Can you provide details about the market size?
The market size is estimated to be USD 6.58 Million as of 2022.
5. What are some drivers contributing to market growth?
4.; Increased Government Regulations for Greenhouse Gas Emissions 4.; Encouraging Production and Consumption of Renewable Aviation Fuel.
6. What are the notable trends driving market growth?
Hydroprocessed Esters and Fatty Acids (HEFA) Technology to Dominate the Market.
7. Are there any restraints impacting market growth?
4.; The High Costs of Renewable Aviation Fuel.
8. Can you provide examples of recent developments in the market?
In May 2023, Twelve and Etihad Airways, the national carrier of the United Arab Emirates, signed a Memorandum of Understanding (MOU) to collaborate on the advancement of E-Jet® fuel, Twelve's sustainable aviation fuel (SAF) made from CO2 and renewable energy, as well as plans for an international demonstration flight and a supply roadmap that will support Etihad's sustainability strategy.
9. What pricing options are available for accessing the report?
Pricing options include single-user, multi-user, and enterprise licenses priced at USD 4750, USD 5250, and USD 8750 respectively.
10. Is the market size provided in terms of value or volume?
The market size is provided in terms of value, measured in Million.
11. Are there any specific market keywords associated with the report?
Yes, the market keyword associated with the report is "Sustainable Aviation Fuel Market," which aids in identifying and referencing the specific market segment covered.
12. How do I determine which pricing option suits my needs best?
The pricing options vary based on user requirements and access needs. Individual users may opt for single-user licenses, while businesses requiring broader access may choose multi-user or enterprise licenses for cost-effective access to the report.
13. Are there any additional resources or data provided in the Sustainable Aviation Fuel Market report?
While the report offers comprehensive insights, it's advisable to review the specific contents or supplementary materials provided to ascertain if additional resources or data are available.
14. How can I stay updated on further developments or reports in the Sustainable Aviation Fuel Market?
To stay informed about further developments, trends, and reports in the Sustainable Aviation Fuel Market, consider subscribing to industry newsletters, following relevant companies and organizations, or regularly checking reputable industry news sources and publications.
Methodology
Step 1 - Identification of Relevant Samples Size from Population Database


Step 2 - Approaches for Defining Global Market Size (Value, Volume* & Price*)

Note*: In applicable scenarios
Step 3 - Data Sources
Primary Research
- Web Analytics
- Survey Reports
- Research Institute
- Latest Research Reports
- Opinion Leaders
Secondary Research
- Annual Reports
- White Paper
- Latest Press Release
- Industry Association
- Paid Database
- Investor Presentations

Step 4 - Data Triangulation
Involves using different sources of information in order to increase the validity of a study
These sources are likely to be stakeholders in a program - participants, other researchers, program staff, other community members, and so on.
Then we put all data in single framework & apply various statistical tools to find out the dynamic on the market.
During the analysis stage, feedback from the stakeholder groups would be compared to determine areas of agreement as well as areas of divergence