

Key Insights
The renewable energy market in Azerbaijan, while nascent compared to global leaders, exhibits significant growth potential driven by the country's commitment to energy diversification and decreasing reliance on fossil fuels. A 3.40% CAGR from 2019-2033 suggests a steady expansion, although the exact market size in 2025 (the base year) is not provided. Considering the global renewable energy market trends and Azerbaijan's geographical location with potential for solar, wind, and hydro power, a reasonable estimate for the 2025 market size would be in the range of $50-100 million. This estimate accounts for the relatively small size of Azerbaijan's economy compared to larger energy markets. Key drivers include government initiatives promoting renewable energy adoption, investments in renewable energy infrastructure (particularly in solar and wind), and increasing awareness of climate change and the need for sustainable energy solutions. Furthermore, the growing industrial sector and expanding urban areas create increased demand for reliable and sustainable energy supplies. However, challenges such as initial high investment costs, limited access to financing for renewable energy projects, and a dependence on established energy infrastructure, present hurdles. The market segmentation reflects this, with the potential for rapid growth in the residential and commercial sectors, followed by industrial applications in the longer term. Companies like Tamiz Shahar JSC and Azerenerji JSC, alongside international players such as Masdar and ACWA Power, are playing a vital role in shaping the market's trajectory. Growth is expected to be most prominent in solar and wind power segments, capitalizing on Azerbaijan's geographical advantages.
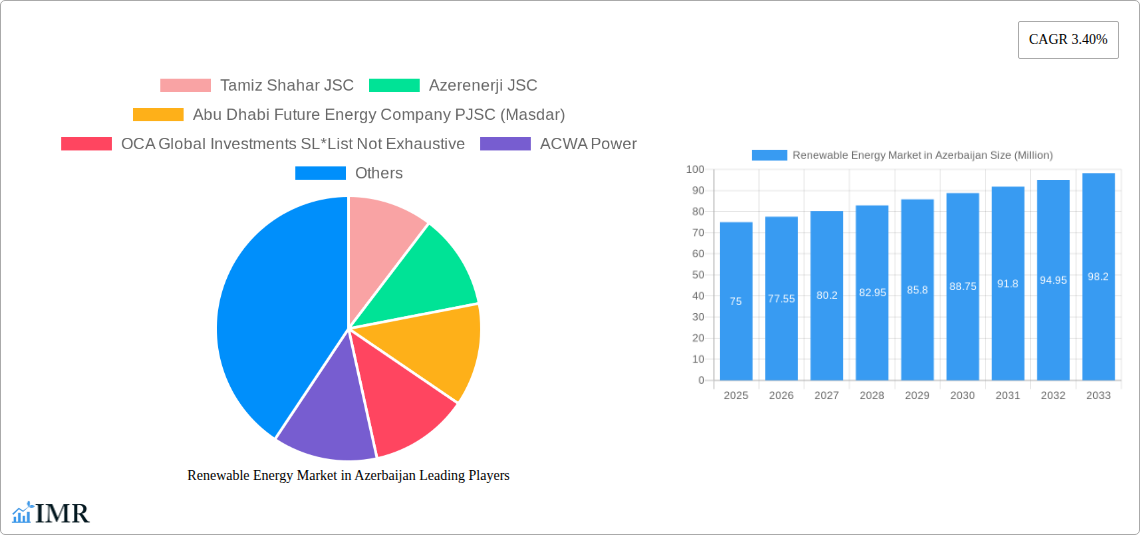
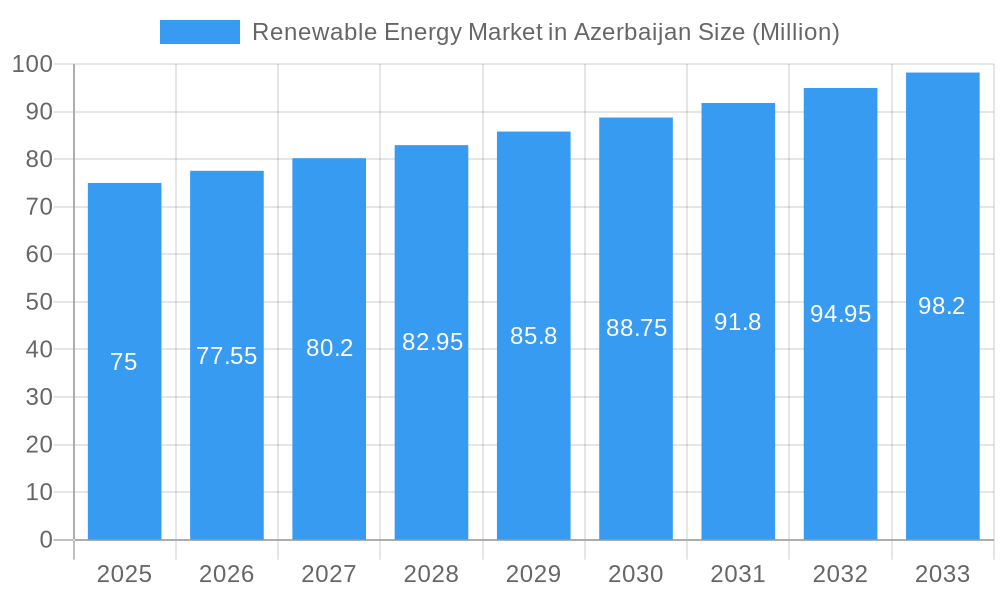
Renewable Energy Market in Azerbaijan Market Size (In Million)
The forecast period (2025-2033) anticipates continued market expansion, with solar and wind energy leading the charge. The residential segment is expected to experience considerable growth, driven by increasing affordability of renewable energy technologies and government incentives. While hydro and geothermal energy may see moderate growth, the market's future success hinges on overcoming the aforementioned constraints. Strengthening regulatory frameworks, attracting more foreign direct investment, and fostering technological innovation will be pivotal in accelerating Azerbaijan's transition to a more sustainable energy future. The presence of established companies and governmental support suggests a reasonably optimistic outlook for the renewable energy sector in Azerbaijan over the next decade.
Renewable Energy Market in Azerbaijan Company Market Share
Renewable Energy Market in Azerbaijan: A Comprehensive Market Report (2019-2033)
This in-depth report provides a comprehensive analysis of the renewable energy market in Azerbaijan, covering market dynamics, growth trends, key players, and future outlook. The study period spans from 2019 to 2033, with 2025 serving as the base and estimated year. The report meticulously examines the parent market (Renewable Energy) and its child markets (Solar, Wind, Hydro, Biomass, Geothermal) across various end-use sectors (Residential, Commercial, Industrial). This analysis is crucial for investors, industry professionals, and policymakers seeking to understand the evolving landscape of renewable energy in Azerbaijan.
Renewable Energy Market in Azerbaijan: Market Dynamics & Structure
The Azerbaijani renewable energy market is characterized by a moderate level of concentration, with key players like Tamiz Shahar JSC and Azerenerji JSC holding significant market share, though the market is still relatively fragmented. Technological innovation is driven by government initiatives and international collaborations, with a focus on solar and wind power. The regulatory framework is evolving, encouraging private sector investment through attractive incentives and feed-in tariffs. However, challenges remain regarding grid infrastructure limitations and bureaucratic hurdles. Competitive substitutes include fossil fuels, which still dominate the energy mix, creating a competitive pressure. End-user demographics show a growing demand for clean energy, particularly in the commercial and industrial sectors. M&A activity has been increasing, with recent deals indicative of growing investor interest.
- Market Concentration: Moderately fragmented, with top 3 players holding approximately xx% market share (2024).
- Technological Innovation: Driven by government policies and international partnerships, focusing on solar and wind.
- Regulatory Framework: Evolving, with increasing incentives for renewable energy projects. However, bureaucratic procedures present challenges.
- Competitive Substitutes: Fossil fuels (natural gas, oil) remain dominant, creating significant competition.
- End-User Demographics: Growing demand from commercial and industrial sectors; residential sector adoption is increasing.
- M&A Trends: Increased activity in recent years, indicating rising investor confidence. xx M&A deals recorded between 2019-2024.
Renewable Energy Market in Azerbaijan: Growth Trends & Insights
The Azerbaijani renewable energy market is experiencing substantial growth, driven by government targets for renewable energy penetration, increasing energy demand, and falling renewable energy technology costs. The market size is projected to reach xx Million USD in 2025 and xx Million USD by 2033, exhibiting a Compound Annual Growth Rate (CAGR) of xx% during the forecast period (2025-2033). Adoption rates are increasing across all sectors, with the commercial sector exhibiting the fastest growth due to increasing awareness of cost savings and environmental sustainability. Technological disruptions, such as advancements in solar PV technology and offshore wind turbine designs, are further accelerating growth. Consumer behaviour is shifting towards renewable energy sources, driven by rising energy prices and environmental concerns.
Dominant Regions, Countries, or Segments in Renewable Energy Market in Azerbaijan
The Alat region is currently the dominant area for renewable energy development in Azerbaijan, primarily due to its favourable solar irradiance levels. Within technology segments, solar power is currently the most dominant, followed by wind power. The commercial and industrial sectors are the key end-use segments driving market growth.
- Key Drivers:
- Government support through policies and incentives.
- Favorable geographical conditions for solar and wind energy.
- Increasing demand from commercial and industrial sectors.
- Decreasing technology costs.
- Dominance Factors:
- Alat region's high solar irradiance.
- Successful implementation of large-scale solar projects (e.g., Masdar's 230 MW plant).
- Government focus on developing wind energy resources.
Renewable Energy Market in Azerbaijan: Product Landscape
The Azerbaijani renewable energy market showcases a diverse product landscape comprising solar PV panels, wind turbines, hydropower generators, biomass boilers, and geothermal power plants. Technological advancements focus on improving efficiency, reducing costs, and enhancing grid integration capabilities. Unique selling propositions emphasize reliability, performance guarantees, and long-term cost savings for end-users.
Key Drivers, Barriers & Challenges in Renewable Energy Market in Azerbaijan
Key Drivers: Government support through feed-in tariffs and renewable energy targets; falling technology costs; increasing energy security concerns; growing investor interest.
Challenges: Limited grid infrastructure capacity; access to financing for large-scale projects; bureaucratic hurdles and permitting processes; dependence on international technology and expertise; land acquisition challenges; xx% of energy still relies on fossil fuels (2024).
Emerging Opportunities in Renewable Energy Market in Azerbaijan
Opportunities exist in developing large-scale wind farms, exploring geothermal energy potential, and integrating energy storage solutions to address intermittency issues. Growth in the residential sector presents significant untapped potential, requiring targeted consumer awareness campaigns and financing schemes. Furthermore, the development of green hydrogen represents a significant emerging opportunity.
Growth Accelerators in the Renewable Energy Market in Azerbaijan Industry
Technological advancements, particularly in energy storage and smart grid technologies, are crucial growth accelerators. Strategic partnerships between international companies and local entities are vital for knowledge transfer and technology adoption. Government initiatives promoting domestic manufacturing and local content requirements can further stimulate growth.
Key Players Shaping the Renewable Energy Market in Azerbaijan Market
- Tamiz Shahar JSC
- Azerenerji JSC
- Abu Dhabi Future Energy Company PJSC (Masdar) [Link to Masdar's website if available]
- OCA Global Investments SL
- ACWA Power [Link to ACWA Power's website if available]
Notable Milestones in Renewable Energy Market in Azerbaijan Sector
- February 2023: ACWA Power signed agreements to develop 1.5 GW of offshore wind, 1 GW of onshore wind, a BESS, and green hydrogen projects. This signifies a major investment push into the sector.
- August 2022: The ADB and Masdar signed a USD 21.4 million loan agreement for a 230 MW solar power plant, demonstrating the attractiveness of the Azerbaijani market to international investors.
In-Depth Renewable Energy Market in Azerbaijan Market Outlook
The Azerbaijani renewable energy market exhibits robust growth potential, driven by ambitious government targets, falling technology costs, and increasing investor confidence. Strategic partnerships, technological innovations, and efficient regulatory frameworks are crucial for unlocking the full potential of this sector. The focus on diversifying the energy mix and achieving energy independence will further accelerate market expansion in the coming years.
Renewable Energy Market in Azerbaijan Segmentation
- 1. Solar
- 2. Wind
- 3. Hydro
- 4. Other Source Types
Renewable Energy Market in Azerbaijan Segmentation By Geography
-
1. North America
- 1.1. United States
- 1.2. Canada
- 1.3. Mexico
-
2. South America
- 2.1. Brazil
- 2.2. Argentina
- 2.3. Rest of South America
-
3. Europe
- 3.1. United Kingdom
- 3.2. Germany
- 3.3. France
- 3.4. Italy
- 3.5. Spain
- 3.6. Russia
- 3.7. Benelux
- 3.8. Nordics
- 3.9. Rest of Europe
-
4. Middle East & Africa
- 4.1. Turkey
- 4.2. Israel
- 4.3. GCC
- 4.4. North Africa
- 4.5. South Africa
- 4.6. Rest of Middle East & Africa
-
5. Asia Pacific
- 5.1. China
- 5.2. India
- 5.3. Japan
- 5.4. South Korea
- 5.5. ASEAN
- 5.6. Oceania
- 5.7. Rest of Asia Pacific
Renewable Energy Market in Azerbaijan Regional Market Share
Geographic Coverage of Renewable Energy Market in Azerbaijan
Renewable Energy Market in Azerbaijan REPORT HIGHLIGHTS
| Aspects | Details |
|---|---|
| Study Period | 2020-2034 |
| Base Year | 2025 |
| Estimated Year | 2026 |
| Forecast Period | 2026-2034 |
| Historical Period | 2020-2025 |
| Growth Rate | CAGR of 3.40% from 2020-2034 |
| Segmentation |
|
Table of Contents
- 1. Introduction
- 1.1. Research Scope
- 1.2. Market Segmentation
- 1.3. Research Methodology
- 1.4. Definitions and Assumptions
- 2. Executive Summary
- 2.1. Introduction
- 3. Market Dynamics
- 3.1. Introduction
- 3.2. Market Drivers
- 3.2.1. 4.; Supportive Government Policies and Incentives4.; Rising Demand for Water and Renewable-Powered Desalination
- 3.3. Market Restrains
- 3.3.1. 4.; Rising Natural Gas Consumption for Power Generation
- 3.4. Market Trends
- 3.4.1. Hydropower to Dominate the Market
- 4. Market Factor Analysis
- 4.1. Porters Five Forces
- 4.2. Supply/Value Chain
- 4.3. PESTEL analysis
- 4.4. Market Entropy
- 4.5. Patent/Trademark Analysis
- 5. Global Renewable Energy Market in Azerbaijan Analysis, Insights and Forecast, 2020-2032
- 5.1. Market Analysis, Insights and Forecast - by Solar
- 5.2. Market Analysis, Insights and Forecast - by Wind
- 5.3. Market Analysis, Insights and Forecast - by Hydro
- 5.4. Market Analysis, Insights and Forecast - by Other Source Types
- 5.5. Market Analysis, Insights and Forecast - by Region
- 5.5.1. North America
- 5.5.2. South America
- 5.5.3. Europe
- 5.5.4. Middle East & Africa
- 5.5.5. Asia Pacific
- 5.1. Market Analysis, Insights and Forecast - by Solar
- 6. North America Renewable Energy Market in Azerbaijan Analysis, Insights and Forecast, 2020-2032
- 6.1. Market Analysis, Insights and Forecast - by Solar
- 6.2. Market Analysis, Insights and Forecast - by Wind
- 6.3. Market Analysis, Insights and Forecast - by Hydro
- 6.4. Market Analysis, Insights and Forecast - by Other Source Types
- 6.1. Market Analysis, Insights and Forecast - by Solar
- 7. South America Renewable Energy Market in Azerbaijan Analysis, Insights and Forecast, 2020-2032
- 7.1. Market Analysis, Insights and Forecast - by Solar
- 7.2. Market Analysis, Insights and Forecast - by Wind
- 7.3. Market Analysis, Insights and Forecast - by Hydro
- 7.4. Market Analysis, Insights and Forecast - by Other Source Types
- 7.1. Market Analysis, Insights and Forecast - by Solar
- 8. Europe Renewable Energy Market in Azerbaijan Analysis, Insights and Forecast, 2020-2032
- 8.1. Market Analysis, Insights and Forecast - by Solar
- 8.2. Market Analysis, Insights and Forecast - by Wind
- 8.3. Market Analysis, Insights and Forecast - by Hydro
- 8.4. Market Analysis, Insights and Forecast - by Other Source Types
- 8.1. Market Analysis, Insights and Forecast - by Solar
- 9. Middle East & Africa Renewable Energy Market in Azerbaijan Analysis, Insights and Forecast, 2020-2032
- 9.1. Market Analysis, Insights and Forecast - by Solar
- 9.2. Market Analysis, Insights and Forecast - by Wind
- 9.3. Market Analysis, Insights and Forecast - by Hydro
- 9.4. Market Analysis, Insights and Forecast - by Other Source Types
- 9.1. Market Analysis, Insights and Forecast - by Solar
- 10. Asia Pacific Renewable Energy Market in Azerbaijan Analysis, Insights and Forecast, 2020-2032
- 10.1. Market Analysis, Insights and Forecast - by Solar
- 10.2. Market Analysis, Insights and Forecast - by Wind
- 10.3. Market Analysis, Insights and Forecast - by Hydro
- 10.4. Market Analysis, Insights and Forecast - by Other Source Types
- 10.1. Market Analysis, Insights and Forecast - by Solar
- 11. Competitive Analysis
- 11.1. Global Market Share Analysis 2025
- 11.2. Company Profiles
- 11.2.1 Tamiz Shahar JSC
- 11.2.1.1. Overview
- 11.2.1.2. Products
- 11.2.1.3. SWOT Analysis
- 11.2.1.4. Recent Developments
- 11.2.1.5. Financials (Based on Availability)
- 11.2.2 Azerenerji JSC
- 11.2.2.1. Overview
- 11.2.2.2. Products
- 11.2.2.3. SWOT Analysis
- 11.2.2.4. Recent Developments
- 11.2.2.5. Financials (Based on Availability)
- 11.2.3 Abu Dhabi Future Energy Company PJSC (Masdar)
- 11.2.3.1. Overview
- 11.2.3.2. Products
- 11.2.3.3. SWOT Analysis
- 11.2.3.4. Recent Developments
- 11.2.3.5. Financials (Based on Availability)
- 11.2.4 OCA Global Investments SL*List Not Exhaustive
- 11.2.4.1. Overview
- 11.2.4.2. Products
- 11.2.4.3. SWOT Analysis
- 11.2.4.4. Recent Developments
- 11.2.4.5. Financials (Based on Availability)
- 11.2.5 ACWA Power
- 11.2.5.1. Overview
- 11.2.5.2. Products
- 11.2.5.3. SWOT Analysis
- 11.2.5.4. Recent Developments
- 11.2.5.5. Financials (Based on Availability)
- 11.2.1 Tamiz Shahar JSC
List of Figures
- Figure 1: Global Renewable Energy Market in Azerbaijan Revenue Breakdown (Million, %) by Region 2025 & 2033
- Figure 2: Global Renewable Energy Market in Azerbaijan Volume Breakdown (gigawatt, %) by Region 2025 & 2033
- Figure 3: North America Renewable Energy Market in Azerbaijan Revenue (Million), by Solar 2025 & 2033
- Figure 4: North America Renewable Energy Market in Azerbaijan Volume (gigawatt), by Solar 2025 & 2033
- Figure 5: North America Renewable Energy Market in Azerbaijan Revenue Share (%), by Solar 2025 & 2033
- Figure 6: North America Renewable Energy Market in Azerbaijan Volume Share (%), by Solar 2025 & 2033
- Figure 7: North America Renewable Energy Market in Azerbaijan Revenue (Million), by Wind 2025 & 2033
- Figure 8: North America Renewable Energy Market in Azerbaijan Volume (gigawatt), by Wind 2025 & 2033
- Figure 9: North America Renewable Energy Market in Azerbaijan Revenue Share (%), by Wind 2025 & 2033
- Figure 10: North America Renewable Energy Market in Azerbaijan Volume Share (%), by Wind 2025 & 2033
- Figure 11: North America Renewable Energy Market in Azerbaijan Revenue (Million), by Hydro 2025 & 2033
- Figure 12: North America Renewable Energy Market in Azerbaijan Volume (gigawatt), by Hydro 2025 & 2033
- Figure 13: North America Renewable Energy Market in Azerbaijan Revenue Share (%), by Hydro 2025 & 2033
- Figure 14: North America Renewable Energy Market in Azerbaijan Volume Share (%), by Hydro 2025 & 2033
- Figure 15: North America Renewable Energy Market in Azerbaijan Revenue (Million), by Other Source Types 2025 & 2033
- Figure 16: North America Renewable Energy Market in Azerbaijan Volume (gigawatt), by Other Source Types 2025 & 2033
- Figure 17: North America Renewable Energy Market in Azerbaijan Revenue Share (%), by Other Source Types 2025 & 2033
- Figure 18: North America Renewable Energy Market in Azerbaijan Volume Share (%), by Other Source Types 2025 & 2033
- Figure 19: North America Renewable Energy Market in Azerbaijan Revenue (Million), by Country 2025 & 2033
- Figure 20: North America Renewable Energy Market in Azerbaijan Volume (gigawatt), by Country 2025 & 2033
- Figure 21: North America Renewable Energy Market in Azerbaijan Revenue Share (%), by Country 2025 & 2033
- Figure 22: North America Renewable Energy Market in Azerbaijan Volume Share (%), by Country 2025 & 2033
- Figure 23: South America Renewable Energy Market in Azerbaijan Revenue (Million), by Solar 2025 & 2033
- Figure 24: South America Renewable Energy Market in Azerbaijan Volume (gigawatt), by Solar 2025 & 2033
- Figure 25: South America Renewable Energy Market in Azerbaijan Revenue Share (%), by Solar 2025 & 2033
- Figure 26: South America Renewable Energy Market in Azerbaijan Volume Share (%), by Solar 2025 & 2033
- Figure 27: South America Renewable Energy Market in Azerbaijan Revenue (Million), by Wind 2025 & 2033
- Figure 28: South America Renewable Energy Market in Azerbaijan Volume (gigawatt), by Wind 2025 & 2033
- Figure 29: South America Renewable Energy Market in Azerbaijan Revenue Share (%), by Wind 2025 & 2033
- Figure 30: South America Renewable Energy Market in Azerbaijan Volume Share (%), by Wind 2025 & 2033
- Figure 31: South America Renewable Energy Market in Azerbaijan Revenue (Million), by Hydro 2025 & 2033
- Figure 32: South America Renewable Energy Market in Azerbaijan Volume (gigawatt), by Hydro 2025 & 2033
- Figure 33: South America Renewable Energy Market in Azerbaijan Revenue Share (%), by Hydro 2025 & 2033
- Figure 34: South America Renewable Energy Market in Azerbaijan Volume Share (%), by Hydro 2025 & 2033
- Figure 35: South America Renewable Energy Market in Azerbaijan Revenue (Million), by Other Source Types 2025 & 2033
- Figure 36: South America Renewable Energy Market in Azerbaijan Volume (gigawatt), by Other Source Types 2025 & 2033
- Figure 37: South America Renewable Energy Market in Azerbaijan Revenue Share (%), by Other Source Types 2025 & 2033
- Figure 38: South America Renewable Energy Market in Azerbaijan Volume Share (%), by Other Source Types 2025 & 2033
- Figure 39: South America Renewable Energy Market in Azerbaijan Revenue (Million), by Country 2025 & 2033
- Figure 40: South America Renewable Energy Market in Azerbaijan Volume (gigawatt), by Country 2025 & 2033
- Figure 41: South America Renewable Energy Market in Azerbaijan Revenue Share (%), by Country 2025 & 2033
- Figure 42: South America Renewable Energy Market in Azerbaijan Volume Share (%), by Country 2025 & 2033
- Figure 43: Europe Renewable Energy Market in Azerbaijan Revenue (Million), by Solar 2025 & 2033
- Figure 44: Europe Renewable Energy Market in Azerbaijan Volume (gigawatt), by Solar 2025 & 2033
- Figure 45: Europe Renewable Energy Market in Azerbaijan Revenue Share (%), by Solar 2025 & 2033
- Figure 46: Europe Renewable Energy Market in Azerbaijan Volume Share (%), by Solar 2025 & 2033
- Figure 47: Europe Renewable Energy Market in Azerbaijan Revenue (Million), by Wind 2025 & 2033
- Figure 48: Europe Renewable Energy Market in Azerbaijan Volume (gigawatt), by Wind 2025 & 2033
- Figure 49: Europe Renewable Energy Market in Azerbaijan Revenue Share (%), by Wind 2025 & 2033
- Figure 50: Europe Renewable Energy Market in Azerbaijan Volume Share (%), by Wind 2025 & 2033
- Figure 51: Europe Renewable Energy Market in Azerbaijan Revenue (Million), by Hydro 2025 & 2033
- Figure 52: Europe Renewable Energy Market in Azerbaijan Volume (gigawatt), by Hydro 2025 & 2033
- Figure 53: Europe Renewable Energy Market in Azerbaijan Revenue Share (%), by Hydro 2025 & 2033
- Figure 54: Europe Renewable Energy Market in Azerbaijan Volume Share (%), by Hydro 2025 & 2033
- Figure 55: Europe Renewable Energy Market in Azerbaijan Revenue (Million), by Other Source Types 2025 & 2033
- Figure 56: Europe Renewable Energy Market in Azerbaijan Volume (gigawatt), by Other Source Types 2025 & 2033
- Figure 57: Europe Renewable Energy Market in Azerbaijan Revenue Share (%), by Other Source Types 2025 & 2033
- Figure 58: Europe Renewable Energy Market in Azerbaijan Volume Share (%), by Other Source Types 2025 & 2033
- Figure 59: Europe Renewable Energy Market in Azerbaijan Revenue (Million), by Country 2025 & 2033
- Figure 60: Europe Renewable Energy Market in Azerbaijan Volume (gigawatt), by Country 2025 & 2033
- Figure 61: Europe Renewable Energy Market in Azerbaijan Revenue Share (%), by Country 2025 & 2033
- Figure 62: Europe Renewable Energy Market in Azerbaijan Volume Share (%), by Country 2025 & 2033
- Figure 63: Middle East & Africa Renewable Energy Market in Azerbaijan Revenue (Million), by Solar 2025 & 2033
- Figure 64: Middle East & Africa Renewable Energy Market in Azerbaijan Volume (gigawatt), by Solar 2025 & 2033
- Figure 65: Middle East & Africa Renewable Energy Market in Azerbaijan Revenue Share (%), by Solar 2025 & 2033
- Figure 66: Middle East & Africa Renewable Energy Market in Azerbaijan Volume Share (%), by Solar 2025 & 2033
- Figure 67: Middle East & Africa Renewable Energy Market in Azerbaijan Revenue (Million), by Wind 2025 & 2033
- Figure 68: Middle East & Africa Renewable Energy Market in Azerbaijan Volume (gigawatt), by Wind 2025 & 2033
- Figure 69: Middle East & Africa Renewable Energy Market in Azerbaijan Revenue Share (%), by Wind 2025 & 2033
- Figure 70: Middle East & Africa Renewable Energy Market in Azerbaijan Volume Share (%), by Wind 2025 & 2033
- Figure 71: Middle East & Africa Renewable Energy Market in Azerbaijan Revenue (Million), by Hydro 2025 & 2033
- Figure 72: Middle East & Africa Renewable Energy Market in Azerbaijan Volume (gigawatt), by Hydro 2025 & 2033
- Figure 73: Middle East & Africa Renewable Energy Market in Azerbaijan Revenue Share (%), by Hydro 2025 & 2033
- Figure 74: Middle East & Africa Renewable Energy Market in Azerbaijan Volume Share (%), by Hydro 2025 & 2033
- Figure 75: Middle East & Africa Renewable Energy Market in Azerbaijan Revenue (Million), by Other Source Types 2025 & 2033
- Figure 76: Middle East & Africa Renewable Energy Market in Azerbaijan Volume (gigawatt), by Other Source Types 2025 & 2033
- Figure 77: Middle East & Africa Renewable Energy Market in Azerbaijan Revenue Share (%), by Other Source Types 2025 & 2033
- Figure 78: Middle East & Africa Renewable Energy Market in Azerbaijan Volume Share (%), by Other Source Types 2025 & 2033
- Figure 79: Middle East & Africa Renewable Energy Market in Azerbaijan Revenue (Million), by Country 2025 & 2033
- Figure 80: Middle East & Africa Renewable Energy Market in Azerbaijan Volume (gigawatt), by Country 2025 & 2033
- Figure 81: Middle East & Africa Renewable Energy Market in Azerbaijan Revenue Share (%), by Country 2025 & 2033
- Figure 82: Middle East & Africa Renewable Energy Market in Azerbaijan Volume Share (%), by Country 2025 & 2033
- Figure 83: Asia Pacific Renewable Energy Market in Azerbaijan Revenue (Million), by Solar 2025 & 2033
- Figure 84: Asia Pacific Renewable Energy Market in Azerbaijan Volume (gigawatt), by Solar 2025 & 2033
- Figure 85: Asia Pacific Renewable Energy Market in Azerbaijan Revenue Share (%), by Solar 2025 & 2033
- Figure 86: Asia Pacific Renewable Energy Market in Azerbaijan Volume Share (%), by Solar 2025 & 2033
- Figure 87: Asia Pacific Renewable Energy Market in Azerbaijan Revenue (Million), by Wind 2025 & 2033
- Figure 88: Asia Pacific Renewable Energy Market in Azerbaijan Volume (gigawatt), by Wind 2025 & 2033
- Figure 89: Asia Pacific Renewable Energy Market in Azerbaijan Revenue Share (%), by Wind 2025 & 2033
- Figure 90: Asia Pacific Renewable Energy Market in Azerbaijan Volume Share (%), by Wind 2025 & 2033
- Figure 91: Asia Pacific Renewable Energy Market in Azerbaijan Revenue (Million), by Hydro 2025 & 2033
- Figure 92: Asia Pacific Renewable Energy Market in Azerbaijan Volume (gigawatt), by Hydro 2025 & 2033
- Figure 93: Asia Pacific Renewable Energy Market in Azerbaijan Revenue Share (%), by Hydro 2025 & 2033
- Figure 94: Asia Pacific Renewable Energy Market in Azerbaijan Volume Share (%), by Hydro 2025 & 2033
- Figure 95: Asia Pacific Renewable Energy Market in Azerbaijan Revenue (Million), by Other Source Types 2025 & 2033
- Figure 96: Asia Pacific Renewable Energy Market in Azerbaijan Volume (gigawatt), by Other Source Types 2025 & 2033
- Figure 97: Asia Pacific Renewable Energy Market in Azerbaijan Revenue Share (%), by Other Source Types 2025 & 2033
- Figure 98: Asia Pacific Renewable Energy Market in Azerbaijan Volume Share (%), by Other Source Types 2025 & 2033
- Figure 99: Asia Pacific Renewable Energy Market in Azerbaijan Revenue (Million), by Country 2025 & 2033
- Figure 100: Asia Pacific Renewable Energy Market in Azerbaijan Volume (gigawatt), by Country 2025 & 2033
- Figure 101: Asia Pacific Renewable Energy Market in Azerbaijan Revenue Share (%), by Country 2025 & 2033
- Figure 102: Asia Pacific Renewable Energy Market in Azerbaijan Volume Share (%), by Country 2025 & 2033
List of Tables
- Table 1: Global Renewable Energy Market in Azerbaijan Revenue Million Forecast, by Solar 2020 & 2033
- Table 2: Global Renewable Energy Market in Azerbaijan Volume gigawatt Forecast, by Solar 2020 & 2033
- Table 3: Global Renewable Energy Market in Azerbaijan Revenue Million Forecast, by Wind 2020 & 2033
- Table 4: Global Renewable Energy Market in Azerbaijan Volume gigawatt Forecast, by Wind 2020 & 2033
- Table 5: Global Renewable Energy Market in Azerbaijan Revenue Million Forecast, by Hydro 2020 & 2033
- Table 6: Global Renewable Energy Market in Azerbaijan Volume gigawatt Forecast, by Hydro 2020 & 2033
- Table 7: Global Renewable Energy Market in Azerbaijan Revenue Million Forecast, by Other Source Types 2020 & 2033
- Table 8: Global Renewable Energy Market in Azerbaijan Volume gigawatt Forecast, by Other Source Types 2020 & 2033
- Table 9: Global Renewable Energy Market in Azerbaijan Revenue Million Forecast, by Region 2020 & 2033
- Table 10: Global Renewable Energy Market in Azerbaijan Volume gigawatt Forecast, by Region 2020 & 2033
- Table 11: Global Renewable Energy Market in Azerbaijan Revenue Million Forecast, by Solar 2020 & 2033
- Table 12: Global Renewable Energy Market in Azerbaijan Volume gigawatt Forecast, by Solar 2020 & 2033
- Table 13: Global Renewable Energy Market in Azerbaijan Revenue Million Forecast, by Wind 2020 & 2033
- Table 14: Global Renewable Energy Market in Azerbaijan Volume gigawatt Forecast, by Wind 2020 & 2033
- Table 15: Global Renewable Energy Market in Azerbaijan Revenue Million Forecast, by Hydro 2020 & 2033
- Table 16: Global Renewable Energy Market in Azerbaijan Volume gigawatt Forecast, by Hydro 2020 & 2033
- Table 17: Global Renewable Energy Market in Azerbaijan Revenue Million Forecast, by Other Source Types 2020 & 2033
- Table 18: Global Renewable Energy Market in Azerbaijan Volume gigawatt Forecast, by Other Source Types 2020 & 2033
- Table 19: Global Renewable Energy Market in Azerbaijan Revenue Million Forecast, by Country 2020 & 2033
- Table 20: Global Renewable Energy Market in Azerbaijan Volume gigawatt Forecast, by Country 2020 & 2033
- Table 21: United States Renewable Energy Market in Azerbaijan Revenue (Million) Forecast, by Application 2020 & 2033
- Table 22: United States Renewable Energy Market in Azerbaijan Volume (gigawatt) Forecast, by Application 2020 & 2033
- Table 23: Canada Renewable Energy Market in Azerbaijan Revenue (Million) Forecast, by Application 2020 & 2033
- Table 24: Canada Renewable Energy Market in Azerbaijan Volume (gigawatt) Forecast, by Application 2020 & 2033
- Table 25: Mexico Renewable Energy Market in Azerbaijan Revenue (Million) Forecast, by Application 2020 & 2033
- Table 26: Mexico Renewable Energy Market in Azerbaijan Volume (gigawatt) Forecast, by Application 2020 & 2033
- Table 27: Global Renewable Energy Market in Azerbaijan Revenue Million Forecast, by Solar 2020 & 2033
- Table 28: Global Renewable Energy Market in Azerbaijan Volume gigawatt Forecast, by Solar 2020 & 2033
- Table 29: Global Renewable Energy Market in Azerbaijan Revenue Million Forecast, by Wind 2020 & 2033
- Table 30: Global Renewable Energy Market in Azerbaijan Volume gigawatt Forecast, by Wind 2020 & 2033
- Table 31: Global Renewable Energy Market in Azerbaijan Revenue Million Forecast, by Hydro 2020 & 2033
- Table 32: Global Renewable Energy Market in Azerbaijan Volume gigawatt Forecast, by Hydro 2020 & 2033
- Table 33: Global Renewable Energy Market in Azerbaijan Revenue Million Forecast, by Other Source Types 2020 & 2033
- Table 34: Global Renewable Energy Market in Azerbaijan Volume gigawatt Forecast, by Other Source Types 2020 & 2033
- Table 35: Global Renewable Energy Market in Azerbaijan Revenue Million Forecast, by Country 2020 & 2033
- Table 36: Global Renewable Energy Market in Azerbaijan Volume gigawatt Forecast, by Country 2020 & 2033
- Table 37: Brazil Renewable Energy Market in Azerbaijan Revenue (Million) Forecast, by Application 2020 & 2033
- Table 38: Brazil Renewable Energy Market in Azerbaijan Volume (gigawatt) Forecast, by Application 2020 & 2033
- Table 39: Argentina Renewable Energy Market in Azerbaijan Revenue (Million) Forecast, by Application 2020 & 2033
- Table 40: Argentina Renewable Energy Market in Azerbaijan Volume (gigawatt) Forecast, by Application 2020 & 2033
- Table 41: Rest of South America Renewable Energy Market in Azerbaijan Revenue (Million) Forecast, by Application 2020 & 2033
- Table 42: Rest of South America Renewable Energy Market in Azerbaijan Volume (gigawatt) Forecast, by Application 2020 & 2033
- Table 43: Global Renewable Energy Market in Azerbaijan Revenue Million Forecast, by Solar 2020 & 2033
- Table 44: Global Renewable Energy Market in Azerbaijan Volume gigawatt Forecast, by Solar 2020 & 2033
- Table 45: Global Renewable Energy Market in Azerbaijan Revenue Million Forecast, by Wind 2020 & 2033
- Table 46: Global Renewable Energy Market in Azerbaijan Volume gigawatt Forecast, by Wind 2020 & 2033
- Table 47: Global Renewable Energy Market in Azerbaijan Revenue Million Forecast, by Hydro 2020 & 2033
- Table 48: Global Renewable Energy Market in Azerbaijan Volume gigawatt Forecast, by Hydro 2020 & 2033
- Table 49: Global Renewable Energy Market in Azerbaijan Revenue Million Forecast, by Other Source Types 2020 & 2033
- Table 50: Global Renewable Energy Market in Azerbaijan Volume gigawatt Forecast, by Other Source Types 2020 & 2033
- Table 51: Global Renewable Energy Market in Azerbaijan Revenue Million Forecast, by Country 2020 & 2033
- Table 52: Global Renewable Energy Market in Azerbaijan Volume gigawatt Forecast, by Country 2020 & 2033
- Table 53: United Kingdom Renewable Energy Market in Azerbaijan Revenue (Million) Forecast, by Application 2020 & 2033
- Table 54: United Kingdom Renewable Energy Market in Azerbaijan Volume (gigawatt) Forecast, by Application 2020 & 2033
- Table 55: Germany Renewable Energy Market in Azerbaijan Revenue (Million) Forecast, by Application 2020 & 2033
- Table 56: Germany Renewable Energy Market in Azerbaijan Volume (gigawatt) Forecast, by Application 2020 & 2033
- Table 57: France Renewable Energy Market in Azerbaijan Revenue (Million) Forecast, by Application 2020 & 2033
- Table 58: France Renewable Energy Market in Azerbaijan Volume (gigawatt) Forecast, by Application 2020 & 2033
- Table 59: Italy Renewable Energy Market in Azerbaijan Revenue (Million) Forecast, by Application 2020 & 2033
- Table 60: Italy Renewable Energy Market in Azerbaijan Volume (gigawatt) Forecast, by Application 2020 & 2033
- Table 61: Spain Renewable Energy Market in Azerbaijan Revenue (Million) Forecast, by Application 2020 & 2033
- Table 62: Spain Renewable Energy Market in Azerbaijan Volume (gigawatt) Forecast, by Application 2020 & 2033
- Table 63: Russia Renewable Energy Market in Azerbaijan Revenue (Million) Forecast, by Application 2020 & 2033
- Table 64: Russia Renewable Energy Market in Azerbaijan Volume (gigawatt) Forecast, by Application 2020 & 2033
- Table 65: Benelux Renewable Energy Market in Azerbaijan Revenue (Million) Forecast, by Application 2020 & 2033
- Table 66: Benelux Renewable Energy Market in Azerbaijan Volume (gigawatt) Forecast, by Application 2020 & 2033
- Table 67: Nordics Renewable Energy Market in Azerbaijan Revenue (Million) Forecast, by Application 2020 & 2033
- Table 68: Nordics Renewable Energy Market in Azerbaijan Volume (gigawatt) Forecast, by Application 2020 & 2033
- Table 69: Rest of Europe Renewable Energy Market in Azerbaijan Revenue (Million) Forecast, by Application 2020 & 2033
- Table 70: Rest of Europe Renewable Energy Market in Azerbaijan Volume (gigawatt) Forecast, by Application 2020 & 2033
- Table 71: Global Renewable Energy Market in Azerbaijan Revenue Million Forecast, by Solar 2020 & 2033
- Table 72: Global Renewable Energy Market in Azerbaijan Volume gigawatt Forecast, by Solar 2020 & 2033
- Table 73: Global Renewable Energy Market in Azerbaijan Revenue Million Forecast, by Wind 2020 & 2033
- Table 74: Global Renewable Energy Market in Azerbaijan Volume gigawatt Forecast, by Wind 2020 & 2033
- Table 75: Global Renewable Energy Market in Azerbaijan Revenue Million Forecast, by Hydro 2020 & 2033
- Table 76: Global Renewable Energy Market in Azerbaijan Volume gigawatt Forecast, by Hydro 2020 & 2033
- Table 77: Global Renewable Energy Market in Azerbaijan Revenue Million Forecast, by Other Source Types 2020 & 2033
- Table 78: Global Renewable Energy Market in Azerbaijan Volume gigawatt Forecast, by Other Source Types 2020 & 2033
- Table 79: Global Renewable Energy Market in Azerbaijan Revenue Million Forecast, by Country 2020 & 2033
- Table 80: Global Renewable Energy Market in Azerbaijan Volume gigawatt Forecast, by Country 2020 & 2033
- Table 81: Turkey Renewable Energy Market in Azerbaijan Revenue (Million) Forecast, by Application 2020 & 2033
- Table 82: Turkey Renewable Energy Market in Azerbaijan Volume (gigawatt) Forecast, by Application 2020 & 2033
- Table 83: Israel Renewable Energy Market in Azerbaijan Revenue (Million) Forecast, by Application 2020 & 2033
- Table 84: Israel Renewable Energy Market in Azerbaijan Volume (gigawatt) Forecast, by Application 2020 & 2033
- Table 85: GCC Renewable Energy Market in Azerbaijan Revenue (Million) Forecast, by Application 2020 & 2033
- Table 86: GCC Renewable Energy Market in Azerbaijan Volume (gigawatt) Forecast, by Application 2020 & 2033
- Table 87: North Africa Renewable Energy Market in Azerbaijan Revenue (Million) Forecast, by Application 2020 & 2033
- Table 88: North Africa Renewable Energy Market in Azerbaijan Volume (gigawatt) Forecast, by Application 2020 & 2033
- Table 89: South Africa Renewable Energy Market in Azerbaijan Revenue (Million) Forecast, by Application 2020 & 2033
- Table 90: South Africa Renewable Energy Market in Azerbaijan Volume (gigawatt) Forecast, by Application 2020 & 2033
- Table 91: Rest of Middle East & Africa Renewable Energy Market in Azerbaijan Revenue (Million) Forecast, by Application 2020 & 2033
- Table 92: Rest of Middle East & Africa Renewable Energy Market in Azerbaijan Volume (gigawatt) Forecast, by Application 2020 & 2033
- Table 93: Global Renewable Energy Market in Azerbaijan Revenue Million Forecast, by Solar 2020 & 2033
- Table 94: Global Renewable Energy Market in Azerbaijan Volume gigawatt Forecast, by Solar 2020 & 2033
- Table 95: Global Renewable Energy Market in Azerbaijan Revenue Million Forecast, by Wind 2020 & 2033
- Table 96: Global Renewable Energy Market in Azerbaijan Volume gigawatt Forecast, by Wind 2020 & 2033
- Table 97: Global Renewable Energy Market in Azerbaijan Revenue Million Forecast, by Hydro 2020 & 2033
- Table 98: Global Renewable Energy Market in Azerbaijan Volume gigawatt Forecast, by Hydro 2020 & 2033
- Table 99: Global Renewable Energy Market in Azerbaijan Revenue Million Forecast, by Other Source Types 2020 & 2033
- Table 100: Global Renewable Energy Market in Azerbaijan Volume gigawatt Forecast, by Other Source Types 2020 & 2033
- Table 101: Global Renewable Energy Market in Azerbaijan Revenue Million Forecast, by Country 2020 & 2033
- Table 102: Global Renewable Energy Market in Azerbaijan Volume gigawatt Forecast, by Country 2020 & 2033
- Table 103: China Renewable Energy Market in Azerbaijan Revenue (Million) Forecast, by Application 2020 & 2033
- Table 104: China Renewable Energy Market in Azerbaijan Volume (gigawatt) Forecast, by Application 2020 & 2033
- Table 105: India Renewable Energy Market in Azerbaijan Revenue (Million) Forecast, by Application 2020 & 2033
- Table 106: India Renewable Energy Market in Azerbaijan Volume (gigawatt) Forecast, by Application 2020 & 2033
- Table 107: Japan Renewable Energy Market in Azerbaijan Revenue (Million) Forecast, by Application 2020 & 2033
- Table 108: Japan Renewable Energy Market in Azerbaijan Volume (gigawatt) Forecast, by Application 2020 & 2033
- Table 109: South Korea Renewable Energy Market in Azerbaijan Revenue (Million) Forecast, by Application 2020 & 2033
- Table 110: South Korea Renewable Energy Market in Azerbaijan Volume (gigawatt) Forecast, by Application 2020 & 2033
- Table 111: ASEAN Renewable Energy Market in Azerbaijan Revenue (Million) Forecast, by Application 2020 & 2033
- Table 112: ASEAN Renewable Energy Market in Azerbaijan Volume (gigawatt) Forecast, by Application 2020 & 2033
- Table 113: Oceania Renewable Energy Market in Azerbaijan Revenue (Million) Forecast, by Application 2020 & 2033
- Table 114: Oceania Renewable Energy Market in Azerbaijan Volume (gigawatt) Forecast, by Application 2020 & 2033
- Table 115: Rest of Asia Pacific Renewable Energy Market in Azerbaijan Revenue (Million) Forecast, by Application 2020 & 2033
- Table 116: Rest of Asia Pacific Renewable Energy Market in Azerbaijan Volume (gigawatt) Forecast, by Application 2020 & 2033
Frequently Asked Questions
1. What is the projected Compound Annual Growth Rate (CAGR) of the Renewable Energy Market in Azerbaijan?
The projected CAGR is approximately 3.40%.
2. Which companies are prominent players in the Renewable Energy Market in Azerbaijan?
Key companies in the market include Tamiz Shahar JSC, Azerenerji JSC, Abu Dhabi Future Energy Company PJSC (Masdar), OCA Global Investments SL*List Not Exhaustive, ACWA Power.
3. What are the main segments of the Renewable Energy Market in Azerbaijan?
The market segments include Solar, Wind, Hydro, Other Source Types.
4. Can you provide details about the market size?
The market size is estimated to be USD XX Million as of 2022.
5. What are some drivers contributing to market growth?
4.; Supportive Government Policies and Incentives4.; Rising Demand for Water and Renewable-Powered Desalination.
6. What are the notable trends driving market growth?
Hydropower to Dominate the Market.
7. Are there any restraints impacting market growth?
4.; Rising Natural Gas Consumption for Power Generation.
8. Can you provide examples of recent developments in the market?
February 2023: ACWA Power signed three implementation agreements with Azerbaijan's Ministry of Energy and a cooperation agreement with the State Oil Company of the Azerbaijan Republic (SOCAR) to develop new renewable projects in the country. The agreements signed comprise the development by ACWA Power of 1.5 GW of offshore wind and 1 GW of onshore wind, as well as the development of a battery energy storage system (BESS) and the development of green hydrogen in the country.
9. What pricing options are available for accessing the report?
Pricing options include single-user, multi-user, and enterprise licenses priced at USD 3800, USD 4500, and USD 5800 respectively.
10. Is the market size provided in terms of value or volume?
The market size is provided in terms of value, measured in Million and volume, measured in gigawatt.
11. Are there any specific market keywords associated with the report?
Yes, the market keyword associated with the report is "Renewable Energy Market in Azerbaijan," which aids in identifying and referencing the specific market segment covered.
12. How do I determine which pricing option suits my needs best?
The pricing options vary based on user requirements and access needs. Individual users may opt for single-user licenses, while businesses requiring broader access may choose multi-user or enterprise licenses for cost-effective access to the report.
13. Are there any additional resources or data provided in the Renewable Energy Market in Azerbaijan report?
While the report offers comprehensive insights, it's advisable to review the specific contents or supplementary materials provided to ascertain if additional resources or data are available.
14. How can I stay updated on further developments or reports in the Renewable Energy Market in Azerbaijan?
To stay informed about further developments, trends, and reports in the Renewable Energy Market in Azerbaijan, consider subscribing to industry newsletters, following relevant companies and organizations, or regularly checking reputable industry news sources and publications.
Methodology
Step 1 - Identification of Relevant Samples Size from Population Database


Step 2 - Approaches for Defining Global Market Size (Value, Volume* & Price*)

Note*: In applicable scenarios
Step 3 - Data Sources
Primary Research
- Web Analytics
- Survey Reports
- Research Institute
- Latest Research Reports
- Opinion Leaders
Secondary Research
- Annual Reports
- White Paper
- Latest Press Release
- Industry Association
- Paid Database
- Investor Presentations

Step 4 - Data Triangulation
Involves using different sources of information in order to increase the validity of a study
These sources are likely to be stakeholders in a program - participants, other researchers, program staff, other community members, and so on.
Then we put all data in single framework & apply various statistical tools to find out the dynamic on the market.
During the analysis stage, feedback from the stakeholder groups would be compared to determine areas of agreement as well as areas of divergence