

Key Insights
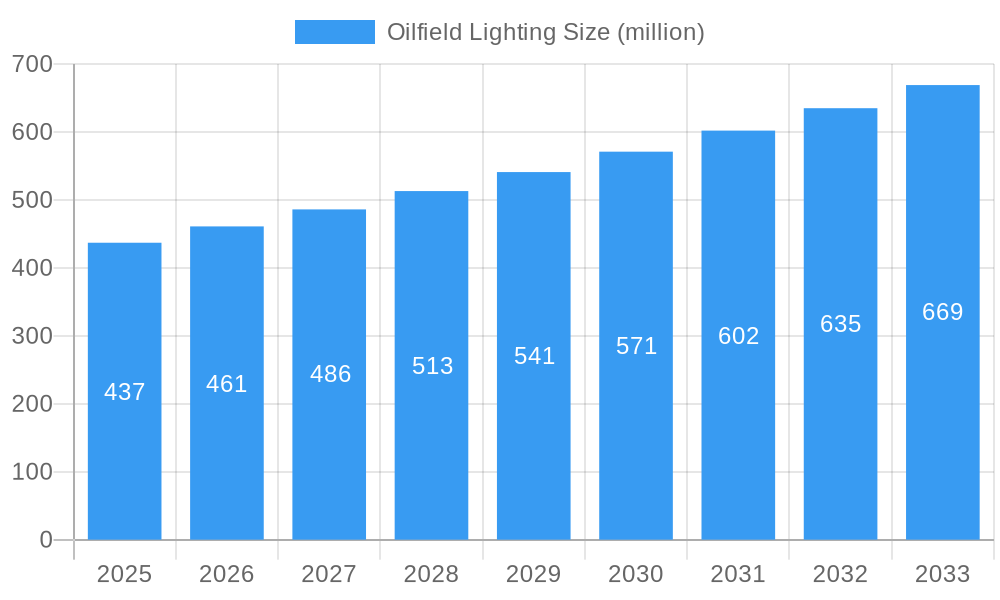
The oilfield lighting market, currently valued at $437 million in 2025, is projected to experience robust growth, driven by increasing offshore and onshore oil and gas exploration activities, and a rising demand for enhanced safety and operational efficiency. The market's Compound Annual Growth Rate (CAGR) of 5.2% from 2025 to 2033 indicates a steady expansion, fueled by technological advancements in LED lighting, which offers significant energy savings, longer lifespan, and improved illumination compared to traditional lighting solutions. This transition to energy-efficient LED technology is a major trend shaping the market, alongside the increasing adoption of smart lighting systems for remote monitoring and control, optimizing energy consumption and maintenance costs. However, the market faces restraints such as volatile oil prices and stringent environmental regulations, which can impact investment decisions in the oil and gas sector. Nevertheless, the long-term outlook for oilfield lighting remains positive, particularly with a focus on sustainable and technologically advanced solutions. Key players like Aeon LED, Eaton, Emerson Electric, and others are actively investing in research and development to enhance product offerings and cater to the evolving needs of the industry. The market segmentation likely includes various lighting types (e.g., explosion-proof, high-intensity discharge), applications (e.g., drilling rigs, production platforms), and geographical regions, with North America and the Middle East potentially holding significant market shares due to substantial oil and gas activities in those areas.

Oilfield Lighting Market Size (In Million)
The competitive landscape is characterized by both established players and emerging companies. Established companies leverage their extensive experience and market presence, while emerging companies focus on innovation and cost-effectiveness. Market consolidation through mergers and acquisitions is also a possibility, driven by the need for economies of scale and enhanced technological capabilities. Future growth will depend on the stability of oil prices, stricter environmental regulations, and advancements in lighting technology. The continuous demand for improved safety and efficiency in oilfield operations will remain a key driver, further propelling market expansion. The focus on digitalization and automation within the oil and gas industry is also likely to increase demand for advanced lighting solutions that integrate with smart monitoring systems.
Oilfield Lighting Company Market Share
Oilfield Lighting Market Report: 2019-2033
This comprehensive report provides a detailed analysis of the global oilfield lighting market, encompassing market dynamics, growth trends, regional insights, and key player strategies from 2019 to 2033. The report leverages extensive market research and data analysis to offer actionable insights for industry professionals, investors, and stakeholders seeking to navigate this dynamic sector. This report covers the parent market of industrial lighting and the child market of oilfield lighting, providing a holistic view of the market landscape. The market size is estimated in million units.
Oilfield Lighting Market Dynamics & Structure
The oilfield lighting market, valued at xx million units in 2025, is characterized by moderate concentration with several key players holding significant market share. Technological innovation, particularly in LED lighting, is a major driver, while stringent safety regulations and environmental concerns shape market dynamics. The market faces competition from alternative lighting technologies, although LED's energy efficiency and longevity provide a strong competitive advantage. End-user demographics are primarily focused on oil and gas exploration and production companies, with increasing adoption in offshore platforms and remote locations. M&A activity has been moderate, with a total of xx deals recorded between 2019 and 2024.
- Market Concentration: Moderately concentrated, with top 5 players holding approximately xx% market share in 2025.
- Technological Innovation: LED technology dominance, with ongoing R&D in energy efficiency, durability, and smart lighting solutions.
- Regulatory Framework: Stringent safety standards and environmental regulations impacting product design and deployment.
- Competitive Substitutes: Traditional lighting technologies (halogen, fluorescent) face declining market share due to higher energy consumption and shorter lifespan.
- End-User Demographics: Primarily oil and gas exploration and production companies, including both onshore and offshore operations.
- M&A Trends: xx M&A deals between 2019 and 2024, primarily focused on technology acquisition and market expansion.
Oilfield Lighting Growth Trends & Insights
The oilfield lighting market exhibits a steady growth trajectory, driven by increasing investment in oil and gas exploration, technological advancements, and rising demand for enhanced safety and efficiency. The market is expected to achieve a CAGR of xx% during the forecast period (2025-2033), reaching xx million units by 2033. Market penetration of LED lighting is high and continues to increase, driven by its cost-effectiveness and performance benefits. Consumer behavior is shifting toward solutions that provide enhanced safety, remote monitoring, and reduced operational costs.
Dominant Regions, Countries, or Segments in Oilfield Lighting
North America currently holds the largest market share in oilfield lighting, driven by significant oil and gas exploration activities and robust regulatory frameworks that prioritize safety and energy efficiency. However, the Asia-Pacific region exhibits the highest growth potential, fueled by rapid economic development and expanding oil and gas infrastructure. The offshore segment demonstrates stronger growth prospects compared to the onshore segment, owing to the stringent lighting requirements in harsh marine environments.
- Key Drivers in North America: Strong oil and gas industry, stringent safety regulations, high adoption of advanced lighting technologies.
- Key Drivers in Asia-Pacific: Rapid economic growth, expanding oil and gas infrastructure, increasing investment in exploration and production.
- Offshore Segment Drivers: Stringent safety and operational requirements, need for robust and durable lighting solutions.
Oilfield Lighting Product Landscape
The oilfield lighting market features a wide range of products, including LED area lights, explosion-proof lighting fixtures, portable work lights, and specialized underwater lighting solutions. Product innovation focuses on improving energy efficiency, enhancing durability to withstand harsh environmental conditions, and integrating smart features for remote monitoring and control. Key selling propositions include robust design, extended lifespan, and reduced maintenance needs.
Key Drivers, Barriers & Challenges in Oilfield Lighting
Key Drivers: Increasing demand for energy-efficient lighting solutions, stringent safety regulations, technological advancements in LED technology, and rising oil and gas exploration activities.
Challenges: High initial investment costs for advanced lighting systems, supply chain disruptions impacting component availability, and potential competition from alternative lighting technologies. The market is subject to cyclical fluctuations depending on oil prices, resulting in variations in investment and demand.
Emerging Opportunities in Oilfield Lighting
Emerging opportunities include the increasing adoption of smart lighting technologies, growth of the offshore lighting segment, and expansion into new geographical markets with developing oil and gas industries. Furthermore, the integration of IoT sensors and data analytics can further optimize lighting operations, enhance safety, and improve energy efficiency.
Growth Accelerators in the Oilfield Lighting Industry
Technological advancements in LED technology, strategic partnerships between lighting manufacturers and oilfield service providers, and increasing government support for energy efficiency initiatives are major catalysts for long-term growth. Expansion into new geographic markets and the development of specialized lighting solutions for unique applications further propel market expansion.
Key Players Shaping the Oilfield Lighting Market
- Aeon LED
- Eaton
- Emerson Electric
- Glamox
- Hubbell Incorporated
- Iwasaki Electric
- Jackson Power
- Phoenix Products Company
- Senben Lighting
- Shenzhen CESP Co.,Ltd.
- Snelson Oilfield Lighting
- SUREALL Tech
- Warom Technology
Notable Milestones in Oilfield Lighting Sector
- 2020-Q3: Introduction of a new generation of explosion-proof LED lighting fixtures by Aeon LED.
- 2022-Q1: Emerson Electric acquired a smaller lighting company specializing in underwater lighting solutions.
- 2023-Q4: Hubbell Incorporated launched a smart lighting system for remote oilfield monitoring.
In-Depth Oilfield Lighting Market Outlook
The oilfield lighting market is poised for significant growth over the next decade, driven by sustained demand for energy-efficient and safe lighting solutions. Strategic partnerships, technological innovation, and expansion into new markets will further drive market expansion. The shift towards sustainable practices within the oil and gas industry presents a key opportunity for manufacturers to offer eco-friendly and cost-effective lighting solutions.
Oilfield Lighting Segmentation
-
1. Application
- 1.1. Oil and Gas Extraction
- 1.2. Oil and Gas Processing
- 1.3. Others
-
2. Type
- 2.1. High Bays Lights
- 2.2. Area Lights
- 2.3. High Masts Lights
- 2.4. Flood Lights
- 2.5. Others
Oilfield Lighting Segmentation By Geography
-
1. North America
- 1.1. United States
- 1.2. Canada
- 1.3. Mexico
-
2. South America
- 2.1. Brazil
- 2.2. Argentina
- 2.3. Rest of South America
-
3. Europe
- 3.1. United Kingdom
- 3.2. Germany
- 3.3. France
- 3.4. Italy
- 3.5. Spain
- 3.6. Russia
- 3.7. Benelux
- 3.8. Nordics
- 3.9. Rest of Europe
-
4. Middle East & Africa
- 4.1. Turkey
- 4.2. Israel
- 4.3. GCC
- 4.4. North Africa
- 4.5. South Africa
- 4.6. Rest of Middle East & Africa
-
5. Asia Pacific
- 5.1. China
- 5.2. India
- 5.3. Japan
- 5.4. South Korea
- 5.5. ASEAN
- 5.6. Oceania
- 5.7. Rest of Asia Pacific

Oilfield Lighting Regional Market Share
Geographic Coverage of Oilfield Lighting
Oilfield Lighting REPORT HIGHLIGHTS
| Aspects | Details |
|---|---|
| Study Period | 2020-2034 |
| Base Year | 2025 |
| Estimated Year | 2026 |
| Forecast Period | 2026-2034 |
| Historical Period | 2020-2025 |
| Growth Rate | CAGR of 5.2% from 2020-2034 |
| Segmentation |
|
Table of Contents
- 1. Introduction
- 1.1. Research Scope
- 1.2. Market Segmentation
- 1.3. Research Methodology
- 1.4. Definitions and Assumptions
- 2. Executive Summary
- 2.1. Introduction
- 3. Market Dynamics
- 3.1. Introduction
- 3.2. Market Drivers
- 3.3. Market Restrains
- 3.4. Market Trends
- 4. Market Factor Analysis
- 4.1. Porters Five Forces
- 4.2. Supply/Value Chain
- 4.3. PESTEL analysis
- 4.4. Market Entropy
- 4.5. Patent/Trademark Analysis
- 5. Global Oilfield Lighting Analysis, Insights and Forecast, 2020-2032
- 5.1. Market Analysis, Insights and Forecast - by Application
- 5.1.1. Oil and Gas Extraction
- 5.1.2. Oil and Gas Processing
- 5.1.3. Others
- 5.2. Market Analysis, Insights and Forecast - by Type
- 5.2.1. High Bays Lights
- 5.2.2. Area Lights
- 5.2.3. High Masts Lights
- 5.2.4. Flood Lights
- 5.2.5. Others
- 5.3. Market Analysis, Insights and Forecast - by Region
- 5.3.1. North America
- 5.3.2. South America
- 5.3.3. Europe
- 5.3.4. Middle East & Africa
- 5.3.5. Asia Pacific
- 5.1. Market Analysis, Insights and Forecast - by Application
- 6. North America Oilfield Lighting Analysis, Insights and Forecast, 2020-2032
- 6.1. Market Analysis, Insights and Forecast - by Application
- 6.1.1. Oil and Gas Extraction
- 6.1.2. Oil and Gas Processing
- 6.1.3. Others
- 6.2. Market Analysis, Insights and Forecast - by Type
- 6.2.1. High Bays Lights
- 6.2.2. Area Lights
- 6.2.3. High Masts Lights
- 6.2.4. Flood Lights
- 6.2.5. Others
- 6.1. Market Analysis, Insights and Forecast - by Application
- 7. South America Oilfield Lighting Analysis, Insights and Forecast, 2020-2032
- 7.1. Market Analysis, Insights and Forecast - by Application
- 7.1.1. Oil and Gas Extraction
- 7.1.2. Oil and Gas Processing
- 7.1.3. Others
- 7.2. Market Analysis, Insights and Forecast - by Type
- 7.2.1. High Bays Lights
- 7.2.2. Area Lights
- 7.2.3. High Masts Lights
- 7.2.4. Flood Lights
- 7.2.5. Others
- 7.1. Market Analysis, Insights and Forecast - by Application
- 8. Europe Oilfield Lighting Analysis, Insights and Forecast, 2020-2032
- 8.1. Market Analysis, Insights and Forecast - by Application
- 8.1.1. Oil and Gas Extraction
- 8.1.2. Oil and Gas Processing
- 8.1.3. Others
- 8.2. Market Analysis, Insights and Forecast - by Type
- 8.2.1. High Bays Lights
- 8.2.2. Area Lights
- 8.2.3. High Masts Lights
- 8.2.4. Flood Lights
- 8.2.5. Others
- 8.1. Market Analysis, Insights and Forecast - by Application
- 9. Middle East & Africa Oilfield Lighting Analysis, Insights and Forecast, 2020-2032
- 9.1. Market Analysis, Insights and Forecast - by Application
- 9.1.1. Oil and Gas Extraction
- 9.1.2. Oil and Gas Processing
- 9.1.3. Others
- 9.2. Market Analysis, Insights and Forecast - by Type
- 9.2.1. High Bays Lights
- 9.2.2. Area Lights
- 9.2.3. High Masts Lights
- 9.2.4. Flood Lights
- 9.2.5. Others
- 9.1. Market Analysis, Insights and Forecast - by Application
- 10. Asia Pacific Oilfield Lighting Analysis, Insights and Forecast, 2020-2032
- 10.1. Market Analysis, Insights and Forecast - by Application
- 10.1.1. Oil and Gas Extraction
- 10.1.2. Oil and Gas Processing
- 10.1.3. Others
- 10.2. Market Analysis, Insights and Forecast - by Type
- 10.2.1. High Bays Lights
- 10.2.2. Area Lights
- 10.2.3. High Masts Lights
- 10.2.4. Flood Lights
- 10.2.5. Others
- 10.1. Market Analysis, Insights and Forecast - by Application
- 11. Competitive Analysis
- 11.1. Global Market Share Analysis 2025
- 11.2. Company Profiles
- 11.2.1 Aeon LED
- 11.2.1.1. Overview
- 11.2.1.2. Products
- 11.2.1.3. SWOT Analysis
- 11.2.1.4. Recent Developments
- 11.2.1.5. Financials (Based on Availability)
- 11.2.2 Eaton
- 11.2.2.1. Overview
- 11.2.2.2. Products
- 11.2.2.3. SWOT Analysis
- 11.2.2.4. Recent Developments
- 11.2.2.5. Financials (Based on Availability)
- 11.2.3 Emerson Electric
- 11.2.3.1. Overview
- 11.2.3.2. Products
- 11.2.3.3. SWOT Analysis
- 11.2.3.4. Recent Developments
- 11.2.3.5. Financials (Based on Availability)
- 11.2.4 Glamox
- 11.2.4.1. Overview
- 11.2.4.2. Products
- 11.2.4.3. SWOT Analysis
- 11.2.4.4. Recent Developments
- 11.2.4.5. Financials (Based on Availability)
- 11.2.5 Hubbell Incorporated
- 11.2.5.1. Overview
- 11.2.5.2. Products
- 11.2.5.3. SWOT Analysis
- 11.2.5.4. Recent Developments
- 11.2.5.5. Financials (Based on Availability)
- 11.2.6 Iwasaki Electric
- 11.2.6.1. Overview
- 11.2.6.2. Products
- 11.2.6.3. SWOT Analysis
- 11.2.6.4. Recent Developments
- 11.2.6.5. Financials (Based on Availability)
- 11.2.7 Jackson Power
- 11.2.7.1. Overview
- 11.2.7.2. Products
- 11.2.7.3. SWOT Analysis
- 11.2.7.4. Recent Developments
- 11.2.7.5. Financials (Based on Availability)
- 11.2.8 Phoenix Products Company
- 11.2.8.1. Overview
- 11.2.8.2. Products
- 11.2.8.3. SWOT Analysis
- 11.2.8.4. Recent Developments
- 11.2.8.5. Financials (Based on Availability)
- 11.2.9 Senben Lighting
- 11.2.9.1. Overview
- 11.2.9.2. Products
- 11.2.9.3. SWOT Analysis
- 11.2.9.4. Recent Developments
- 11.2.9.5. Financials (Based on Availability)
- 11.2.10 Shenzhen CESP Co.
- 11.2.10.1. Overview
- 11.2.10.2. Products
- 11.2.10.3. SWOT Analysis
- 11.2.10.4. Recent Developments
- 11.2.10.5. Financials (Based on Availability)
- 11.2.11 Ltd.
- 11.2.11.1. Overview
- 11.2.11.2. Products
- 11.2.11.3. SWOT Analysis
- 11.2.11.4. Recent Developments
- 11.2.11.5. Financials (Based on Availability)
- 11.2.12 Snelson Oilfield Lighting
- 11.2.12.1. Overview
- 11.2.12.2. Products
- 11.2.12.3. SWOT Analysis
- 11.2.12.4. Recent Developments
- 11.2.12.5. Financials (Based on Availability)
- 11.2.13 SUREALL Tech
- 11.2.13.1. Overview
- 11.2.13.2. Products
- 11.2.13.3. SWOT Analysis
- 11.2.13.4. Recent Developments
- 11.2.13.5. Financials (Based on Availability)
- 11.2.14 Warom Technology
- 11.2.14.1. Overview
- 11.2.14.2. Products
- 11.2.14.3. SWOT Analysis
- 11.2.14.4. Recent Developments
- 11.2.14.5. Financials (Based on Availability)
- 11.2.1 Aeon LED
List of Figures
- Figure 1: Global Oilfield Lighting Revenue Breakdown (million, %) by Region 2025 & 2033
- Figure 2: North America Oilfield Lighting Revenue (million), by Application 2025 & 2033
- Figure 3: North America Oilfield Lighting Revenue Share (%), by Application 2025 & 2033
- Figure 4: North America Oilfield Lighting Revenue (million), by Type 2025 & 2033
- Figure 5: North America Oilfield Lighting Revenue Share (%), by Type 2025 & 2033
- Figure 6: North America Oilfield Lighting Revenue (million), by Country 2025 & 2033
- Figure 7: North America Oilfield Lighting Revenue Share (%), by Country 2025 & 2033
- Figure 8: South America Oilfield Lighting Revenue (million), by Application 2025 & 2033
- Figure 9: South America Oilfield Lighting Revenue Share (%), by Application 2025 & 2033
- Figure 10: South America Oilfield Lighting Revenue (million), by Type 2025 & 2033
- Figure 11: South America Oilfield Lighting Revenue Share (%), by Type 2025 & 2033
- Figure 12: South America Oilfield Lighting Revenue (million), by Country 2025 & 2033
- Figure 13: South America Oilfield Lighting Revenue Share (%), by Country 2025 & 2033
- Figure 14: Europe Oilfield Lighting Revenue (million), by Application 2025 & 2033
- Figure 15: Europe Oilfield Lighting Revenue Share (%), by Application 2025 & 2033
- Figure 16: Europe Oilfield Lighting Revenue (million), by Type 2025 & 2033
- Figure 17: Europe Oilfield Lighting Revenue Share (%), by Type 2025 & 2033
- Figure 18: Europe Oilfield Lighting Revenue (million), by Country 2025 & 2033
- Figure 19: Europe Oilfield Lighting Revenue Share (%), by Country 2025 & 2033
- Figure 20: Middle East & Africa Oilfield Lighting Revenue (million), by Application 2025 & 2033
- Figure 21: Middle East & Africa Oilfield Lighting Revenue Share (%), by Application 2025 & 2033
- Figure 22: Middle East & Africa Oilfield Lighting Revenue (million), by Type 2025 & 2033
- Figure 23: Middle East & Africa Oilfield Lighting Revenue Share (%), by Type 2025 & 2033
- Figure 24: Middle East & Africa Oilfield Lighting Revenue (million), by Country 2025 & 2033
- Figure 25: Middle East & Africa Oilfield Lighting Revenue Share (%), by Country 2025 & 2033
- Figure 26: Asia Pacific Oilfield Lighting Revenue (million), by Application 2025 & 2033
- Figure 27: Asia Pacific Oilfield Lighting Revenue Share (%), by Application 2025 & 2033
- Figure 28: Asia Pacific Oilfield Lighting Revenue (million), by Type 2025 & 2033
- Figure 29: Asia Pacific Oilfield Lighting Revenue Share (%), by Type 2025 & 2033
- Figure 30: Asia Pacific Oilfield Lighting Revenue (million), by Country 2025 & 2033
- Figure 31: Asia Pacific Oilfield Lighting Revenue Share (%), by Country 2025 & 2033
List of Tables
- Table 1: Global Oilfield Lighting Revenue million Forecast, by Application 2020 & 2033
- Table 2: Global Oilfield Lighting Revenue million Forecast, by Type 2020 & 2033
- Table 3: Global Oilfield Lighting Revenue million Forecast, by Region 2020 & 2033
- Table 4: Global Oilfield Lighting Revenue million Forecast, by Application 2020 & 2033
- Table 5: Global Oilfield Lighting Revenue million Forecast, by Type 2020 & 2033
- Table 6: Global Oilfield Lighting Revenue million Forecast, by Country 2020 & 2033
- Table 7: United States Oilfield Lighting Revenue (million) Forecast, by Application 2020 & 2033
- Table 8: Canada Oilfield Lighting Revenue (million) Forecast, by Application 2020 & 2033
- Table 9: Mexico Oilfield Lighting Revenue (million) Forecast, by Application 2020 & 2033
- Table 10: Global Oilfield Lighting Revenue million Forecast, by Application 2020 & 2033
- Table 11: Global Oilfield Lighting Revenue million Forecast, by Type 2020 & 2033
- Table 12: Global Oilfield Lighting Revenue million Forecast, by Country 2020 & 2033
- Table 13: Brazil Oilfield Lighting Revenue (million) Forecast, by Application 2020 & 2033
- Table 14: Argentina Oilfield Lighting Revenue (million) Forecast, by Application 2020 & 2033
- Table 15: Rest of South America Oilfield Lighting Revenue (million) Forecast, by Application 2020 & 2033
- Table 16: Global Oilfield Lighting Revenue million Forecast, by Application 2020 & 2033
- Table 17: Global Oilfield Lighting Revenue million Forecast, by Type 2020 & 2033
- Table 18: Global Oilfield Lighting Revenue million Forecast, by Country 2020 & 2033
- Table 19: United Kingdom Oilfield Lighting Revenue (million) Forecast, by Application 2020 & 2033
- Table 20: Germany Oilfield Lighting Revenue (million) Forecast, by Application 2020 & 2033
- Table 21: France Oilfield Lighting Revenue (million) Forecast, by Application 2020 & 2033
- Table 22: Italy Oilfield Lighting Revenue (million) Forecast, by Application 2020 & 2033
- Table 23: Spain Oilfield Lighting Revenue (million) Forecast, by Application 2020 & 2033
- Table 24: Russia Oilfield Lighting Revenue (million) Forecast, by Application 2020 & 2033
- Table 25: Benelux Oilfield Lighting Revenue (million) Forecast, by Application 2020 & 2033
- Table 26: Nordics Oilfield Lighting Revenue (million) Forecast, by Application 2020 & 2033
- Table 27: Rest of Europe Oilfield Lighting Revenue (million) Forecast, by Application 2020 & 2033
- Table 28: Global Oilfield Lighting Revenue million Forecast, by Application 2020 & 2033
- Table 29: Global Oilfield Lighting Revenue million Forecast, by Type 2020 & 2033
- Table 30: Global Oilfield Lighting Revenue million Forecast, by Country 2020 & 2033
- Table 31: Turkey Oilfield Lighting Revenue (million) Forecast, by Application 2020 & 2033
- Table 32: Israel Oilfield Lighting Revenue (million) Forecast, by Application 2020 & 2033
- Table 33: GCC Oilfield Lighting Revenue (million) Forecast, by Application 2020 & 2033
- Table 34: North Africa Oilfield Lighting Revenue (million) Forecast, by Application 2020 & 2033
- Table 35: South Africa Oilfield Lighting Revenue (million) Forecast, by Application 2020 & 2033
- Table 36: Rest of Middle East & Africa Oilfield Lighting Revenue (million) Forecast, by Application 2020 & 2033
- Table 37: Global Oilfield Lighting Revenue million Forecast, by Application 2020 & 2033
- Table 38: Global Oilfield Lighting Revenue million Forecast, by Type 2020 & 2033
- Table 39: Global Oilfield Lighting Revenue million Forecast, by Country 2020 & 2033
- Table 40: China Oilfield Lighting Revenue (million) Forecast, by Application 2020 & 2033
- Table 41: India Oilfield Lighting Revenue (million) Forecast, by Application 2020 & 2033
- Table 42: Japan Oilfield Lighting Revenue (million) Forecast, by Application 2020 & 2033
- Table 43: South Korea Oilfield Lighting Revenue (million) Forecast, by Application 2020 & 2033
- Table 44: ASEAN Oilfield Lighting Revenue (million) Forecast, by Application 2020 & 2033
- Table 45: Oceania Oilfield Lighting Revenue (million) Forecast, by Application 2020 & 2033
- Table 46: Rest of Asia Pacific Oilfield Lighting Revenue (million) Forecast, by Application 2020 & 2033
Frequently Asked Questions
1. What is the projected Compound Annual Growth Rate (CAGR) of the Oilfield Lighting?
The projected CAGR is approximately 5.2%.
2. Which companies are prominent players in the Oilfield Lighting?
Key companies in the market include Aeon LED, Eaton, Emerson Electric, Glamox, Hubbell Incorporated, Iwasaki Electric, Jackson Power, Phoenix Products Company, Senben Lighting, Shenzhen CESP Co., Ltd., Snelson Oilfield Lighting, SUREALL Tech, Warom Technology.
3. What are the main segments of the Oilfield Lighting?
The market segments include Application, Type.
4. Can you provide details about the market size?
The market size is estimated to be USD 437 million as of 2022.
5. What are some drivers contributing to market growth?
N/A
6. What are the notable trends driving market growth?
N/A
7. Are there any restraints impacting market growth?
N/A
8. Can you provide examples of recent developments in the market?
N/A
9. What pricing options are available for accessing the report?
Pricing options include single-user, multi-user, and enterprise licenses priced at USD 2900.00, USD 4350.00, and USD 5800.00 respectively.
10. Is the market size provided in terms of value or volume?
The market size is provided in terms of value, measured in million.
11. Are there any specific market keywords associated with the report?
Yes, the market keyword associated with the report is "Oilfield Lighting," which aids in identifying and referencing the specific market segment covered.
12. How do I determine which pricing option suits my needs best?
The pricing options vary based on user requirements and access needs. Individual users may opt for single-user licenses, while businesses requiring broader access may choose multi-user or enterprise licenses for cost-effective access to the report.
13. Are there any additional resources or data provided in the Oilfield Lighting report?
While the report offers comprehensive insights, it's advisable to review the specific contents or supplementary materials provided to ascertain if additional resources or data are available.
14. How can I stay updated on further developments or reports in the Oilfield Lighting?
To stay informed about further developments, trends, and reports in the Oilfield Lighting, consider subscribing to industry newsletters, following relevant companies and organizations, or regularly checking reputable industry news sources and publications.
Methodology
Step 1 - Identification of Relevant Samples Size from Population Database


Step 2 - Approaches for Defining Global Market Size (Value, Volume* & Price*)

Note*: In applicable scenarios
Step 3 - Data Sources
Primary Research
- Web Analytics
- Survey Reports
- Research Institute
- Latest Research Reports
- Opinion Leaders
Secondary Research
- Annual Reports
- White Paper
- Latest Press Release
- Industry Association
- Paid Database
- Investor Presentations

Step 4 - Data Triangulation
Involves using different sources of information in order to increase the validity of a study
These sources are likely to be stakeholders in a program - participants, other researchers, program staff, other community members, and so on.
Then we put all data in single framework & apply various statistical tools to find out the dynamic on the market.
During the analysis stage, feedback from the stakeholder groups would be compared to determine areas of agreement as well as areas of divergence