

Key Insights
The global packaged tuna market is projected for substantial growth, expected to reach $29.66 billion by 2025, with a Compound Annual Growth Rate (CAGR) of 3.01% from 2025 to 2033. This expansion is driven by rising consumer demand for convenient, protein-rich, and healthy food options, highlighting tuna's omega-3 benefits. The market is experiencing a shift towards online sales, complementing traditional retail channels, due to enhanced accessibility, variety, and competitive pricing. The "Others" segment, including ready-to-eat meals and gourmet products, is also a key growth driver, reflecting evolving consumer preferences for diverse culinary experiences.
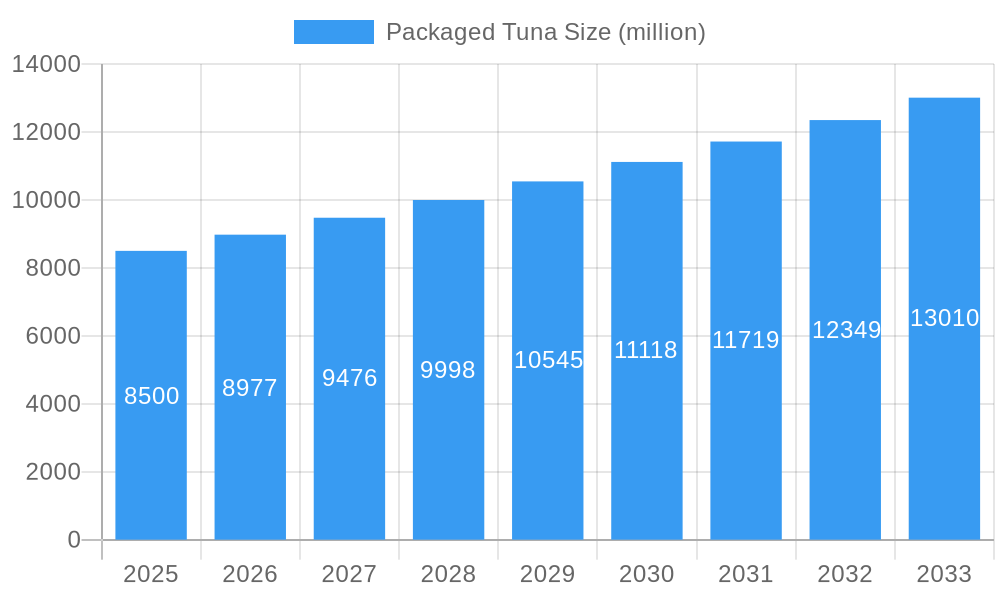
Packaged Tuna Market Size (In Billion)
Further market impetus comes from global population growth and increasing disposable incomes in emerging economies. However, challenges such as overfishing, sustainability concerns, and fluctuating raw material costs may influence growth. Despite these factors, innovation in value-added tuna products with diverse flavors and ingredients caters to niche demands. Key players like Thai Union Group and StarKist are shaping a competitive landscape where brand strength, product quality, and sustainable sourcing are paramount for long-term success.
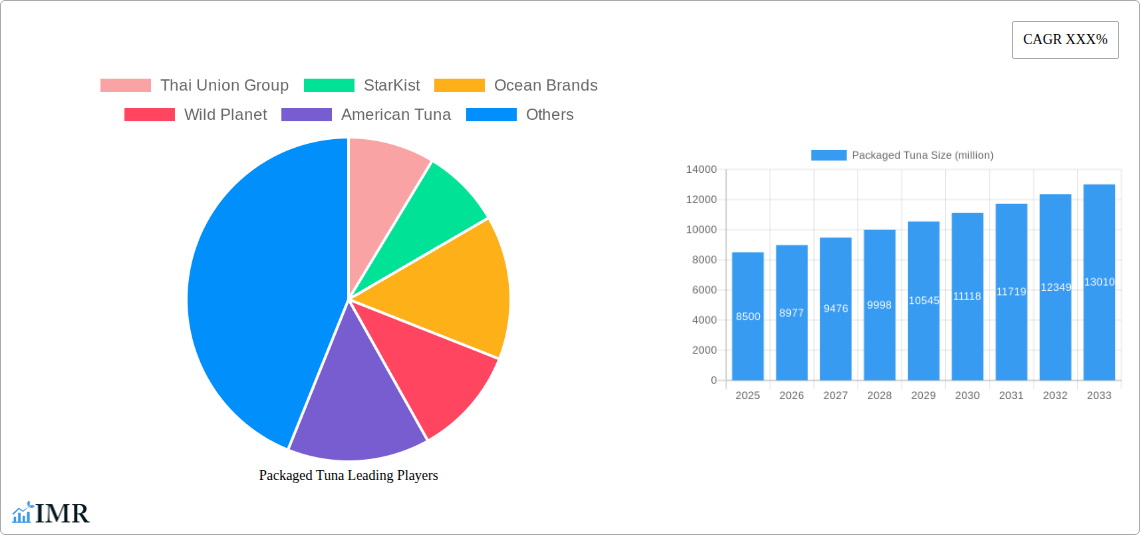
Packaged Tuna Company Market Share
This comprehensive report details the Packaged Tuna Market, including its size, growth trends, and forecasts.
Packaged Tuna Market Dynamics & Structure
The global packaged tuna market exhibits a moderate to high level of concentration, with key players like Thai Union Group, Bumble Bee Foods, and StarKist holding significant market shares. Technological innovation is primarily driven by advancements in sustainable fishing practices, extended shelf-life preservation techniques, and the development of value-added products such as flavored tuna pouches and ready-to-eat meals. Regulatory frameworks, particularly concerning sustainable sourcing, seafood traceability, and labeling standards (e.g., MSC certification, country of origin), are crucial in shaping market entry and operational strategies. Competitive product substitutes include other canned and fresh seafood, plant-based protein alternatives, and other convenient protein sources, necessitating continuous product differentiation and value proposition enhancement. End-user demographics reveal a growing consumer base of health-conscious individuals, busy professionals, and families seeking convenient, protein-rich meal solutions. Mergers and Acquisitions (M&A) trends are observed as companies aim to consolidate market presence, expand product portfolios, and enhance supply chain efficiencies. For instance, the acquisition of smaller regional players or strategic alliances for distribution are common strategies. Barriers to innovation can include the capital investment required for new processing technologies and the challenges in maintaining consistent raw material supply amidst fluctuating fish stocks and environmental concerns.
- Market Concentration: Moderate to High, dominated by a few multinational corporations.
- Technological Drivers: Sustainable fishing, advanced preservation, value-added product development.
- Regulatory Impact: Sustainability, traceability, and labeling standards influence market access.
- Substitutes: Other seafood, plant-based proteins, convenience foods.
- End-User Focus: Health-conscious, time-poor consumers, families.
- M&A Activity: Consolidation for market share, portfolio expansion, and supply chain optimization.
- Innovation Barriers: Capital investment, raw material supply volatility.
Packaged Tuna Growth Trends & Insights
The packaged tuna market is poised for substantial growth over the forecast period of 2025–2033, driven by a confluence of evolving consumer preferences, an expanding global population, and significant industry developments. The market size, estimated at [Insert Estimated Market Size in Million Units] million units in the base year of 2025, is projected to experience a Compound Annual Growth Rate (CAGR) of approximately [Insert Predicted CAGR]%. This growth trajectory is underpinned by the increasing demand for convenient, healthy, and protein-rich food options. Consumer behavior shifts are playing a pivotal role, with a discernible move towards perceived healthier protein sources, such as fish, due to concerns about processed meats and the rising popularity of diets like paleo and ketogenic. Online sales channels are emerging as a critical growth engine, offering consumers greater accessibility and variety, thereby increasing market penetration. Technological disruptions are also contributing, with innovations in sustainable fishing methods, advanced canning and pouching technologies that enhance product freshness and shelf life, and the development of premium, flavored, and ready-to-eat tuna products catering to specific taste profiles and dietary needs. The market penetration is expected to rise from [Insert Historical Market Penetration]% in 2019 to an estimated [Insert Forecast Market Penetration]% by 2033. Furthermore, the growing awareness of the nutritional benefits of tuna, including its high protein content, omega-3 fatty acids, and essential vitamins, is driving its adoption across a wider consumer base, particularly in emerging economies where disposable incomes are rising and awareness of healthy eating habits is increasing. The increasing prevalence of ready-to-eat meals and the demand for on-the-go food solutions further bolster the market's expansion.
Dominant Regions, Countries, or Segments in Packaged Tuna
The Application: Online Sale segment is emerging as a significant growth driver and a dominant force within the global packaged tuna market. While traditional Fresh Supermarket channels continue to hold a substantial share, the rapid digitalization of retail and evolving consumer purchasing habits are propelling online sales to new heights. The projected growth within the Online Sale segment is attributed to several key factors, including enhanced convenience, wider product selection available, competitive pricing, and the ease of home delivery. This segment is particularly attractive to younger demographics and urban populations who are more digitally adept and value time-saving solutions. Market share within this application segment is expected to witness a notable increase, projected to reach [Insert Predicted Market Share for Online Sale]% by 2033. The dominance is further amplified by the increasing investment from e-commerce giants and dedicated online grocers in expanding their packaged food offerings, including a diverse range of tuna products.
From the Type perspective, Yellowfin Tuna is anticipated to maintain its leading position. Its versatility in various culinary applications, from salads and sandwiches to hot dishes, coupled with its desirable texture and flavor profile, makes it a perennial favorite among consumers. The consistent availability and relatively stable pricing of Yellowfin Tuna compared to other premium varieties also contribute to its widespread adoption. However, there is a growing niche market for Bluefin Tuna, driven by a segment of discerning consumers and foodservice establishments that prioritize its rich, buttery flavor and texture, despite its higher price point and sustainability concerns which are being addressed through responsible sourcing initiatives.
The dominance of these segments is underpinned by several macroeconomic and consumer-centric factors:
- Economic Policies: Growing disposable incomes in developing nations are fueling demand for convenient and protein-rich food products, contributing to both online sales and the consumption of popular tuna types like Yellowfin.
- Infrastructure: The expansion of robust logistics and cold chain infrastructure is crucial for efficient delivery of packaged tuna, especially for the burgeoning online segment.
- Consumer Behavior: A discernible shift towards health-conscious eating, coupled with busy lifestyles, directly supports the demand for convenient, ready-to-eat packaged tuna products available through online platforms.
- Marketing and Promotion: Increased digital marketing efforts and targeted promotions on e-commerce platforms are effectively reaching and influencing consumer purchasing decisions for packaged tuna.
- Sustainability Initiatives: While not a direct segment, growing consumer demand for sustainably sourced tuna is influencing product development and marketing strategies across all application and type segments, further driving growth for reputable brands.
Packaged Tuna Product Landscape
The packaged tuna market is characterized by a dynamic product landscape focusing on innovation, convenience, and health. Product innovations include the introduction of single-serving pouches with diverse flavor infusions, such as sriracha, lemon pepper, and herb-infused varieties, catering to evolving consumer palates. Value-added products like tuna salads, pâtés, and ready-to-eat meals are gaining traction, offering consumers quick and nutritious meal solutions. Performance metrics highlight extended shelf-life technologies that maintain freshness and taste without artificial preservatives, alongside sustainable sourcing certifications like MSC, which are becoming crucial unique selling propositions. Technological advancements in canning and retort pouch processing ensure product integrity and safety while minimizing environmental impact.
Key Drivers, Barriers & Challenges in Packaged Tuna
Key Drivers:
- Growing Demand for Protein-Rich Foods: Consumers worldwide are increasingly seeking high-protein diets for health and wellness, making tuna a preferred choice.
- Convenience and Portability: Packaged tuna offers a ready-to-eat, portable protein source ideal for busy lifestyles, lunchboxes, and on-the-go consumption.
- Health Benefits: The recognized nutritional value of tuna, including omega-3 fatty acids, lean protein, and essential vitamins, appeals to health-conscious consumers.
- Expanding Online Retail: The growth of e-commerce platforms provides wider accessibility and diverse product options for packaged tuna.
- Product Innovation: The introduction of flavored pouches, ready-to-eat meals, and sustainable options caters to evolving consumer preferences.
Barriers & Challenges:
- Supply Chain Volatility: Fluctuations in fish stock availability due to overfishing, climate change, and geopolitical factors can impact raw material costs and supply consistency.
- Regulatory Compliance: Stringent regulations concerning sustainable fishing, food safety, and labeling add complexity and cost to operations.
- Competition from Substitutes: A wide array of alternative protein sources, including other seafood, poultry, and plant-based options, intensifies market competition.
- Price Sensitivity: While demand for premium products exists, a significant portion of the market remains price-sensitive, making cost management crucial.
- Consumer Perception of Canned Goods: Some consumers may perceive canned products as less fresh compared to fresh alternatives, requiring effective marketing to highlight quality and preservation techniques.
Emerging Opportunities in Packaged Tuna
Emerging opportunities in the packaged tuna market lie in the expansion of premium and sustainable product lines, catering to the growing demand for ethically sourced and environmentally friendly food options. The development of innovative, plant-based tuna alternatives designed to mimic the texture and flavor of real tuna presents a significant untapped market, appealing to flexitarians and vegetarians. Furthermore, strategic partnerships with online meal kit services and foodservice providers can unlock new distribution channels and consumer touchpoints. The increasing focus on traceability and transparency in the food industry offers an opportunity for brands to differentiate themselves by providing detailed information about their sourcing and production processes, building consumer trust and loyalty.
Growth Accelerators in the Packaged Tuna Industry
The packaged tuna industry is experiencing significant growth acceleration driven by several key catalysts. Technological breakthroughs in sustainable fishing and aquaculture are not only ensuring a more consistent and ethical supply chain but also enhancing consumer confidence. The increasing integration of smart packaging solutions, offering extended shelf life and improved product integrity, is also a major accelerator. Strategic partnerships between tuna producers, e-commerce platforms, and convenience food retailers are expanding market reach and accessibility. Moreover, targeted marketing campaigns emphasizing the health benefits and versatility of tuna, particularly the younger demographic, are fueling demand and driving market expansion.
Key Players Shaping the Packaged Tuna Market
- Thai Union Group
- StarKist
- Ocean Brands
- Wild Planet
- American Tuna
- Trader Joe's (Private Label)
- Safeway (Private Label)
- Trimarine International
- Bumble Bee Foods
- Thunnus Overseas Group (TOG)
Notable Milestones in Packaged Tuna Sector
- 2019: Increased consumer demand for sustainably sourced seafood, leading to wider adoption of MSC certification among major brands.
- 2020: Surge in online grocery shopping due to global events, significantly boosting sales of packaged tuna through e-commerce channels.
- 2021: Introduction of plant-based tuna alternatives by several startups, signaling a new competitive frontier.
- 2022: Major players invest in advanced traceability technologies to enhance supply chain transparency.
- 2023: Launch of premium, flavored tuna pouches with diverse international taste profiles gaining significant traction.
- 2024: Growing emphasis on recyclable and eco-friendly packaging solutions by leading manufacturers.
In-Depth Packaged Tuna Market Outlook
The packaged tuna market is set for robust future growth, with a strong outlook driven by persistent demand for convenient and healthy protein options. The expansion of online retail channels, coupled with ongoing product innovation in value-added and sustainably sourced tuna products, will continue to be key growth accelerators. Strategic investments in supply chain resilience and technological advancements in preservation will further solidify market stability. The market is well-positioned to capitalize on evolving consumer preferences for health and convenience, offering significant opportunities for market leaders and new entrants alike.
Packaged Tuna Segmentation
-
1. Application
- 1.1. Fresh Supermarket
- 1.2. Online Sale
- 1.3. Others
-
2. Type
- 2.1. Yellowfin Tuna
- 2.2. Bluefin Tuna
- 2.3. Others
Packaged Tuna Segmentation By Geography
-
1. North America
- 1.1. United States
- 1.2. Canada
- 1.3. Mexico
-
2. South America
- 2.1. Brazil
- 2.2. Argentina
- 2.3. Rest of South America
-
3. Europe
- 3.1. United Kingdom
- 3.2. Germany
- 3.3. France
- 3.4. Italy
- 3.5. Spain
- 3.6. Russia
- 3.7. Benelux
- 3.8. Nordics
- 3.9. Rest of Europe
-
4. Middle East & Africa
- 4.1. Turkey
- 4.2. Israel
- 4.3. GCC
- 4.4. North Africa
- 4.5. South Africa
- 4.6. Rest of Middle East & Africa
-
5. Asia Pacific
- 5.1. China
- 5.2. India
- 5.3. Japan
- 5.4. South Korea
- 5.5. ASEAN
- 5.6. Oceania
- 5.7. Rest of Asia Pacific
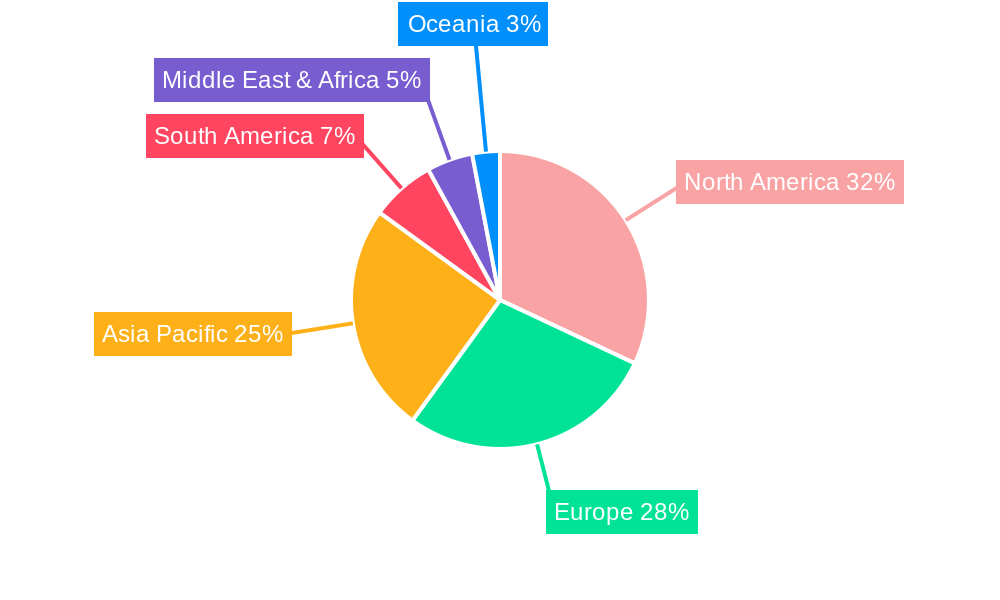
Packaged Tuna Regional Market Share
Geographic Coverage of Packaged Tuna
Packaged Tuna REPORT HIGHLIGHTS
| Aspects | Details |
|---|---|
| Study Period | 2020-2034 |
| Base Year | 2025 |
| Estimated Year | 2026 |
| Forecast Period | 2026-2034 |
| Historical Period | 2020-2025 |
| Growth Rate | CAGR of 3.01% from 2020-2034 |
| Segmentation |
|
Table of Contents
- 1. Introduction
- 1.1. Research Scope
- 1.2. Market Segmentation
- 1.3. Research Methodology
- 1.4. Definitions and Assumptions
- 2. Executive Summary
- 2.1. Introduction
- 3. Market Dynamics
- 3.1. Introduction
- 3.2. Market Drivers
- 3.3. Market Restrains
- 3.4. Market Trends
- 4. Market Factor Analysis
- 4.1. Porters Five Forces
- 4.2. Supply/Value Chain
- 4.3. PESTEL analysis
- 4.4. Market Entropy
- 4.5. Patent/Trademark Analysis
- 5. Global Packaged Tuna Analysis, Insights and Forecast, 2020-2032
- 5.1. Market Analysis, Insights and Forecast - by Application
- 5.1.1. Fresh Supermarket
- 5.1.2. Online Sale
- 5.1.3. Others
- 5.2. Market Analysis, Insights and Forecast - by Type
- 5.2.1. Yellowfin Tuna
- 5.2.2. Bluefin Tuna
- 5.2.3. Others
- 5.3. Market Analysis, Insights and Forecast - by Region
- 5.3.1. North America
- 5.3.2. South America
- 5.3.3. Europe
- 5.3.4. Middle East & Africa
- 5.3.5. Asia Pacific
- 5.1. Market Analysis, Insights and Forecast - by Application
- 6. North America Packaged Tuna Analysis, Insights and Forecast, 2020-2032
- 6.1. Market Analysis, Insights and Forecast - by Application
- 6.1.1. Fresh Supermarket
- 6.1.2. Online Sale
- 6.1.3. Others
- 6.2. Market Analysis, Insights and Forecast - by Type
- 6.2.1. Yellowfin Tuna
- 6.2.2. Bluefin Tuna
- 6.2.3. Others
- 6.1. Market Analysis, Insights and Forecast - by Application
- 7. South America Packaged Tuna Analysis, Insights and Forecast, 2020-2032
- 7.1. Market Analysis, Insights and Forecast - by Application
- 7.1.1. Fresh Supermarket
- 7.1.2. Online Sale
- 7.1.3. Others
- 7.2. Market Analysis, Insights and Forecast - by Type
- 7.2.1. Yellowfin Tuna
- 7.2.2. Bluefin Tuna
- 7.2.3. Others
- 7.1. Market Analysis, Insights and Forecast - by Application
- 8. Europe Packaged Tuna Analysis, Insights and Forecast, 2020-2032
- 8.1. Market Analysis, Insights and Forecast - by Application
- 8.1.1. Fresh Supermarket
- 8.1.2. Online Sale
- 8.1.3. Others
- 8.2. Market Analysis, Insights and Forecast - by Type
- 8.2.1. Yellowfin Tuna
- 8.2.2. Bluefin Tuna
- 8.2.3. Others
- 8.1. Market Analysis, Insights and Forecast - by Application
- 9. Middle East & Africa Packaged Tuna Analysis, Insights and Forecast, 2020-2032
- 9.1. Market Analysis, Insights and Forecast - by Application
- 9.1.1. Fresh Supermarket
- 9.1.2. Online Sale
- 9.1.3. Others
- 9.2. Market Analysis, Insights and Forecast - by Type
- 9.2.1. Yellowfin Tuna
- 9.2.2. Bluefin Tuna
- 9.2.3. Others
- 9.1. Market Analysis, Insights and Forecast - by Application
- 10. Asia Pacific Packaged Tuna Analysis, Insights and Forecast, 2020-2032
- 10.1. Market Analysis, Insights and Forecast - by Application
- 10.1.1. Fresh Supermarket
- 10.1.2. Online Sale
- 10.1.3. Others
- 10.2. Market Analysis, Insights and Forecast - by Type
- 10.2.1. Yellowfin Tuna
- 10.2.2. Bluefin Tuna
- 10.2.3. Others
- 10.1. Market Analysis, Insights and Forecast - by Application
- 11. Competitive Analysis
- 11.1. Global Market Share Analysis 2025
- 11.2. Company Profiles
- 11.2.1 Thai Union Group
- 11.2.1.1. Overview
- 11.2.1.2. Products
- 11.2.1.3. SWOT Analysis
- 11.2.1.4. Recent Developments
- 11.2.1.5. Financials (Based on Availability)
- 11.2.2 StarKist
- 11.2.2.1. Overview
- 11.2.2.2. Products
- 11.2.2.3. SWOT Analysis
- 11.2.2.4. Recent Developments
- 11.2.2.5. Financials (Based on Availability)
- 11.2.3 Ocean Brands
- 11.2.3.1. Overview
- 11.2.3.2. Products
- 11.2.3.3. SWOT Analysis
- 11.2.3.4. Recent Developments
- 11.2.3.5. Financials (Based on Availability)
- 11.2.4 Wild Planet
- 11.2.4.1. Overview
- 11.2.4.2. Products
- 11.2.4.3. SWOT Analysis
- 11.2.4.4. Recent Developments
- 11.2.4.5. Financials (Based on Availability)
- 11.2.5 American Tuna
- 11.2.5.1. Overview
- 11.2.5.2. Products
- 11.2.5.3. SWOT Analysis
- 11.2.5.4. Recent Developments
- 11.2.5.5. Financials (Based on Availability)
- 11.2.6 Trader Joe
- 11.2.6.1. Overview
- 11.2.6.2. Products
- 11.2.6.3. SWOT Analysis
- 11.2.6.4. Recent Developments
- 11.2.6.5. Financials (Based on Availability)
- 11.2.7 Safeway
- 11.2.7.1. Overview
- 11.2.7.2. Products
- 11.2.7.3. SWOT Analysis
- 11.2.7.4. Recent Developments
- 11.2.7.5. Financials (Based on Availability)
- 11.2.8 Trimarine International
- 11.2.8.1. Overview
- 11.2.8.2. Products
- 11.2.8.3. SWOT Analysis
- 11.2.8.4. Recent Developments
- 11.2.8.5. Financials (Based on Availability)
- 11.2.9 Bumble Bee Foods
- 11.2.9.1. Overview
- 11.2.9.2. Products
- 11.2.9.3. SWOT Analysis
- 11.2.9.4. Recent Developments
- 11.2.9.5. Financials (Based on Availability)
- 11.2.10 Thunnus Overseas Group (TOG)
- 11.2.10.1. Overview
- 11.2.10.2. Products
- 11.2.10.3. SWOT Analysis
- 11.2.10.4. Recent Developments
- 11.2.10.5. Financials (Based on Availability)
- 11.2.1 Thai Union Group
List of Figures
- Figure 1: Global Packaged Tuna Revenue Breakdown (billion, %) by Region 2025 & 2033
- Figure 2: North America Packaged Tuna Revenue (billion), by Application 2025 & 2033
- Figure 3: North America Packaged Tuna Revenue Share (%), by Application 2025 & 2033
- Figure 4: North America Packaged Tuna Revenue (billion), by Type 2025 & 2033
- Figure 5: North America Packaged Tuna Revenue Share (%), by Type 2025 & 2033
- Figure 6: North America Packaged Tuna Revenue (billion), by Country 2025 & 2033
- Figure 7: North America Packaged Tuna Revenue Share (%), by Country 2025 & 2033
- Figure 8: South America Packaged Tuna Revenue (billion), by Application 2025 & 2033
- Figure 9: South America Packaged Tuna Revenue Share (%), by Application 2025 & 2033
- Figure 10: South America Packaged Tuna Revenue (billion), by Type 2025 & 2033
- Figure 11: South America Packaged Tuna Revenue Share (%), by Type 2025 & 2033
- Figure 12: South America Packaged Tuna Revenue (billion), by Country 2025 & 2033
- Figure 13: South America Packaged Tuna Revenue Share (%), by Country 2025 & 2033
- Figure 14: Europe Packaged Tuna Revenue (billion), by Application 2025 & 2033
- Figure 15: Europe Packaged Tuna Revenue Share (%), by Application 2025 & 2033
- Figure 16: Europe Packaged Tuna Revenue (billion), by Type 2025 & 2033
- Figure 17: Europe Packaged Tuna Revenue Share (%), by Type 2025 & 2033
- Figure 18: Europe Packaged Tuna Revenue (billion), by Country 2025 & 2033
- Figure 19: Europe Packaged Tuna Revenue Share (%), by Country 2025 & 2033
- Figure 20: Middle East & Africa Packaged Tuna Revenue (billion), by Application 2025 & 2033
- Figure 21: Middle East & Africa Packaged Tuna Revenue Share (%), by Application 2025 & 2033
- Figure 22: Middle East & Africa Packaged Tuna Revenue (billion), by Type 2025 & 2033
- Figure 23: Middle East & Africa Packaged Tuna Revenue Share (%), by Type 2025 & 2033
- Figure 24: Middle East & Africa Packaged Tuna Revenue (billion), by Country 2025 & 2033
- Figure 25: Middle East & Africa Packaged Tuna Revenue Share (%), by Country 2025 & 2033
- Figure 26: Asia Pacific Packaged Tuna Revenue (billion), by Application 2025 & 2033
- Figure 27: Asia Pacific Packaged Tuna Revenue Share (%), by Application 2025 & 2033
- Figure 28: Asia Pacific Packaged Tuna Revenue (billion), by Type 2025 & 2033
- Figure 29: Asia Pacific Packaged Tuna Revenue Share (%), by Type 2025 & 2033
- Figure 30: Asia Pacific Packaged Tuna Revenue (billion), by Country 2025 & 2033
- Figure 31: Asia Pacific Packaged Tuna Revenue Share (%), by Country 2025 & 2033
List of Tables
- Table 1: Global Packaged Tuna Revenue billion Forecast, by Application 2020 & 2033
- Table 2: Global Packaged Tuna Revenue billion Forecast, by Type 2020 & 2033
- Table 3: Global Packaged Tuna Revenue billion Forecast, by Region 2020 & 2033
- Table 4: Global Packaged Tuna Revenue billion Forecast, by Application 2020 & 2033
- Table 5: Global Packaged Tuna Revenue billion Forecast, by Type 2020 & 2033
- Table 6: Global Packaged Tuna Revenue billion Forecast, by Country 2020 & 2033
- Table 7: United States Packaged Tuna Revenue (billion) Forecast, by Application 2020 & 2033
- Table 8: Canada Packaged Tuna Revenue (billion) Forecast, by Application 2020 & 2033
- Table 9: Mexico Packaged Tuna Revenue (billion) Forecast, by Application 2020 & 2033
- Table 10: Global Packaged Tuna Revenue billion Forecast, by Application 2020 & 2033
- Table 11: Global Packaged Tuna Revenue billion Forecast, by Type 2020 & 2033
- Table 12: Global Packaged Tuna Revenue billion Forecast, by Country 2020 & 2033
- Table 13: Brazil Packaged Tuna Revenue (billion) Forecast, by Application 2020 & 2033
- Table 14: Argentina Packaged Tuna Revenue (billion) Forecast, by Application 2020 & 2033
- Table 15: Rest of South America Packaged Tuna Revenue (billion) Forecast, by Application 2020 & 2033
- Table 16: Global Packaged Tuna Revenue billion Forecast, by Application 2020 & 2033
- Table 17: Global Packaged Tuna Revenue billion Forecast, by Type 2020 & 2033
- Table 18: Global Packaged Tuna Revenue billion Forecast, by Country 2020 & 2033
- Table 19: United Kingdom Packaged Tuna Revenue (billion) Forecast, by Application 2020 & 2033
- Table 20: Germany Packaged Tuna Revenue (billion) Forecast, by Application 2020 & 2033
- Table 21: France Packaged Tuna Revenue (billion) Forecast, by Application 2020 & 2033
- Table 22: Italy Packaged Tuna Revenue (billion) Forecast, by Application 2020 & 2033
- Table 23: Spain Packaged Tuna Revenue (billion) Forecast, by Application 2020 & 2033
- Table 24: Russia Packaged Tuna Revenue (billion) Forecast, by Application 2020 & 2033
- Table 25: Benelux Packaged Tuna Revenue (billion) Forecast, by Application 2020 & 2033
- Table 26: Nordics Packaged Tuna Revenue (billion) Forecast, by Application 2020 & 2033
- Table 27: Rest of Europe Packaged Tuna Revenue (billion) Forecast, by Application 2020 & 2033
- Table 28: Global Packaged Tuna Revenue billion Forecast, by Application 2020 & 2033
- Table 29: Global Packaged Tuna Revenue billion Forecast, by Type 2020 & 2033
- Table 30: Global Packaged Tuna Revenue billion Forecast, by Country 2020 & 2033
- Table 31: Turkey Packaged Tuna Revenue (billion) Forecast, by Application 2020 & 2033
- Table 32: Israel Packaged Tuna Revenue (billion) Forecast, by Application 2020 & 2033
- Table 33: GCC Packaged Tuna Revenue (billion) Forecast, by Application 2020 & 2033
- Table 34: North Africa Packaged Tuna Revenue (billion) Forecast, by Application 2020 & 2033
- Table 35: South Africa Packaged Tuna Revenue (billion) Forecast, by Application 2020 & 2033
- Table 36: Rest of Middle East & Africa Packaged Tuna Revenue (billion) Forecast, by Application 2020 & 2033
- Table 37: Global Packaged Tuna Revenue billion Forecast, by Application 2020 & 2033
- Table 38: Global Packaged Tuna Revenue billion Forecast, by Type 2020 & 2033
- Table 39: Global Packaged Tuna Revenue billion Forecast, by Country 2020 & 2033
- Table 40: China Packaged Tuna Revenue (billion) Forecast, by Application 2020 & 2033
- Table 41: India Packaged Tuna Revenue (billion) Forecast, by Application 2020 & 2033
- Table 42: Japan Packaged Tuna Revenue (billion) Forecast, by Application 2020 & 2033
- Table 43: South Korea Packaged Tuna Revenue (billion) Forecast, by Application 2020 & 2033
- Table 44: ASEAN Packaged Tuna Revenue (billion) Forecast, by Application 2020 & 2033
- Table 45: Oceania Packaged Tuna Revenue (billion) Forecast, by Application 2020 & 2033
- Table 46: Rest of Asia Pacific Packaged Tuna Revenue (billion) Forecast, by Application 2020 & 2033
Frequently Asked Questions
1. What is the projected Compound Annual Growth Rate (CAGR) of the Packaged Tuna?
The projected CAGR is approximately 3.01%.
2. Which companies are prominent players in the Packaged Tuna?
Key companies in the market include Thai Union Group, StarKist, Ocean Brands, Wild Planet, American Tuna, Trader Joe, Safeway, Trimarine International, Bumble Bee Foods, Thunnus Overseas Group (TOG).
3. What are the main segments of the Packaged Tuna?
The market segments include Application, Type.
4. Can you provide details about the market size?
The market size is estimated to be USD 29.66 billion as of 2022.
5. What are some drivers contributing to market growth?
N/A
6. What are the notable trends driving market growth?
N/A
7. Are there any restraints impacting market growth?
N/A
8. Can you provide examples of recent developments in the market?
N/A
9. What pricing options are available for accessing the report?
Pricing options include single-user, multi-user, and enterprise licenses priced at USD 2900.00, USD 4350.00, and USD 5800.00 respectively.
10. Is the market size provided in terms of value or volume?
The market size is provided in terms of value, measured in billion.
11. Are there any specific market keywords associated with the report?
Yes, the market keyword associated with the report is "Packaged Tuna," which aids in identifying and referencing the specific market segment covered.
12. How do I determine which pricing option suits my needs best?
The pricing options vary based on user requirements and access needs. Individual users may opt for single-user licenses, while businesses requiring broader access may choose multi-user or enterprise licenses for cost-effective access to the report.
13. Are there any additional resources or data provided in the Packaged Tuna report?
While the report offers comprehensive insights, it's advisable to review the specific contents or supplementary materials provided to ascertain if additional resources or data are available.
14. How can I stay updated on further developments or reports in the Packaged Tuna?
To stay informed about further developments, trends, and reports in the Packaged Tuna, consider subscribing to industry newsletters, following relevant companies and organizations, or regularly checking reputable industry news sources and publications.
Methodology
Step 1 - Identification of Relevant Samples Size from Population Database


Step 2 - Approaches for Defining Global Market Size (Value, Volume* & Price*)

Note*: In applicable scenarios
Step 3 - Data Sources
Primary Research
- Web Analytics
- Survey Reports
- Research Institute
- Latest Research Reports
- Opinion Leaders
Secondary Research
- Annual Reports
- White Paper
- Latest Press Release
- Industry Association
- Paid Database
- Investor Presentations

Step 4 - Data Triangulation
Involves using different sources of information in order to increase the validity of a study
These sources are likely to be stakeholders in a program - participants, other researchers, program staff, other community members, and so on.
Then we put all data in single framework & apply various statistical tools to find out the dynamic on the market.
During the analysis stage, feedback from the stakeholder groups would be compared to determine areas of agreement as well as areas of divergence