

Key Insights
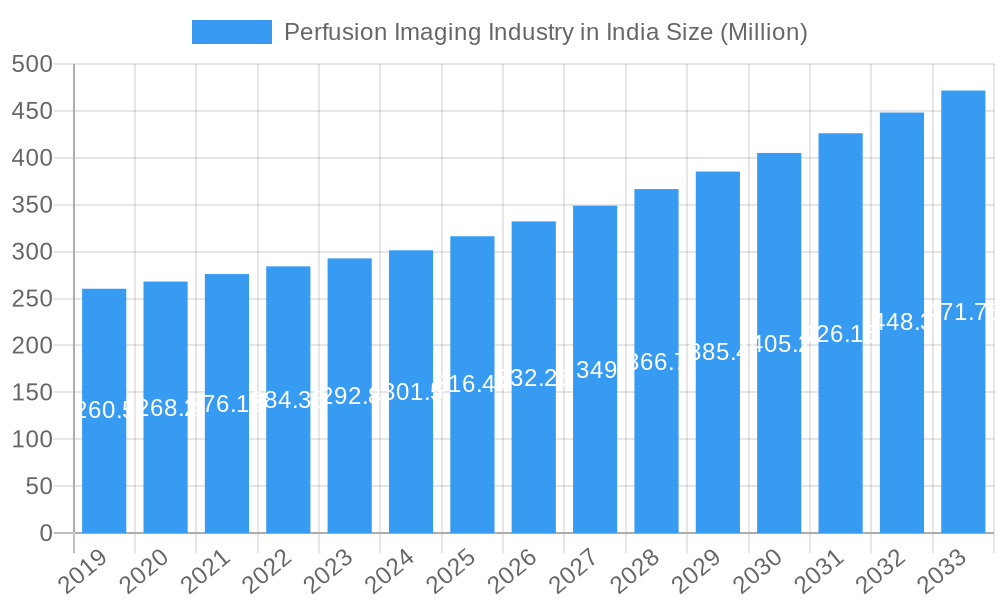
The Perfusion Imaging market is projected for robust growth, reaching an estimated USD 316.44 million in 2025 and expanding at a Compound Annual Growth Rate (CAGR) of 4.92% through 2033. This expansion is primarily driven by the increasing prevalence of chronic diseases such as cardiovascular conditions and neurological disorders, necessitating more advanced diagnostic tools. The growing adoption of SPECT and PET imaging techniques, which offer detailed insights into organ and tissue function, is a significant growth catalyst. Specifically, oncology and cardiology applications are expected to lead the market, fueled by the demand for early and accurate disease detection and treatment monitoring. The market's development is further supported by continuous technological advancements in imaging equipment and radiopharmaceuticals, enhancing diagnostic precision and patient outcomes. Key players are investing in research and development to introduce innovative solutions, thereby expanding the market's reach and impact.
Perfusion Imaging Industry in India Market Size (In Million)
The market is segmented into Equipment and Diagnostic Radioisotopes, with further breakdowns into SPECT and PET applications. SPECT imaging, particularly in cardiology and neurology, is a mature segment demonstrating steady demand, while PET imaging, especially in oncology, is experiencing rapid growth due to its superior sensitivity in detecting and characterizing tumors. The rising healthcare expenditure across major economies, coupled with an aging global population, is creating a sustained demand for perfusion imaging services. Initiatives by governments and healthcare organizations to improve diagnostic infrastructure and promote early disease detection also contribute positively to market dynamics. While the market benefits from strong drivers, challenges such as the high cost of advanced imaging equipment and a shortage of skilled radiographers in certain regions might moderate the growth pace. However, the overall outlook remains optimistic, driven by the imperative for improved patient care and the continuous innovation within the perfusion imaging landscape.
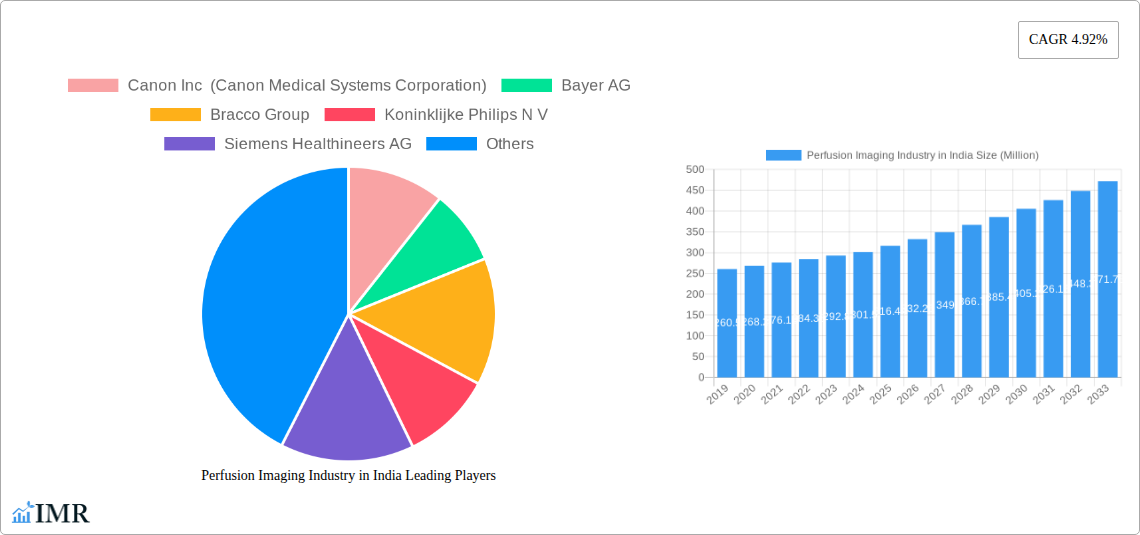
Perfusion Imaging Industry in India Company Market Share
Unlock critical insights into India's rapidly evolving Perfusion Imaging Industry with this in-depth market report. Spanning from 2019 to 2033, with a base and estimated year of 2025, this report provides a meticulous analysis of market dynamics, growth trends, regional dominance, product landscape, key drivers, challenges, and emerging opportunities. With a focus on quantitative data and qualitative analysis, we deliver an essential resource for industry professionals, investors, and policymakers seeking to navigate and capitalize on this vital sector. All values are presented in Million units.
Perfusion Imaging Industry in India Market Dynamics & Structure
The Indian Perfusion Imaging market exhibits a moderate to high level of concentration, with key global players like Siemens Healthineers AG, GE Healthcare, Koninklijke Philips N.V., Canon Inc (Canon Medical Systems Corporation), and Bayer AG dominating market share. Technological innovation, particularly in advancing SPECT and PET imaging resolutions and reducing scan times, acts as a primary driver. Regulatory frameworks, while evolving, aim to standardize quality and safety, impacting device approvals and radiopharmaceutical usage. Competitive product substitutes primarily involve alternative diagnostic modalities, though perfusion imaging offers unique functional insights. End-user demographics are increasingly driven by an aging population, rising prevalence of chronic diseases like cardiovascular conditions and cancer, and a growing awareness of early disease detection. Mergers and acquisitions (M&A) trends are observed, albeit at a moderate pace, as established players seek to consolidate market presence or acquire niche technologies.
- Market Concentration: Dominated by a few multinational corporations, but with emerging domestic players in certain segments.
- Technological Innovation: Driven by advancements in detector technology, AI-powered image reconstruction, and development of novel radiotracers.
- Regulatory Landscape: Growing emphasis on radiation safety, data privacy, and quality control for imaging centers.
- Competitive Landscape: Competition from MRI, CT, and ultrasound, but perfusion imaging's functional data remains unparalleled for specific applications.
- End-User Demographics: Aging population, increasing incidence of lifestyle diseases, and a growing middle class with higher disposable incomes for advanced healthcare.
- M&A Activity: Strategic acquisitions focused on expanding product portfolios and geographical reach.
Perfusion Imaging Industry in India Growth Trends & Insights
The Indian Perfusion Imaging market is poised for robust growth, projected to witness a Compound Annual Growth Rate (CAGR) of approximately xx% during the forecast period of 2025–2033. This expansion is fueled by a confluence of factors including a rapidly increasing healthcare expenditure, a growing demand for minimally invasive diagnostic techniques, and a heightened focus on preventive healthcare. Market penetration is steadily rising, especially in Tier 1 and Tier 2 cities, as advanced imaging centers proliferate. Technological disruptions, such as the integration of artificial intelligence (AI) for enhanced image analysis and workflow optimization, are significantly influencing adoption rates. Consumer behavior shifts towards seeking early and accurate disease diagnosis are further propelling the demand for sophisticated imaging solutions. The market size, estimated at USD xx Million in 2025, is projected to reach USD xx Million by 2033. This growth trajectory is underpinned by increasing awareness of the benefits of perfusion imaging in diagnosing and monitoring a wide array of conditions, from cardiac ischemia and neurological disorders to oncological staging and treatment response assessment. The development of more portable and cost-effective perfusion imaging systems is also expected to broaden accessibility and accelerate market adoption across diverse healthcare settings.
Dominant Regions, Countries, or Segments in Perfusion Imaging Industry in India
The Product: Equipment segment is currently the dominant force driving growth within the Indian Perfusion Imaging industry. This segment encompasses the sophisticated machinery essential for SPECT and PET imaging, including gamma cameras, PET scanners, and associated hardware. The market share for equipment is estimated at xx% in 2025, with a projected CAGR of xx% from 2025–2033. This dominance is attributable to the foundational role of imaging equipment in enabling all perfusion imaging procedures. Economic policies that encourage medical infrastructure development, coupled with significant private and public investments in upgrading hospital facilities, are key drivers. The growing prevalence of cardiovascular diseases and cancers, two major application areas for perfusion imaging, further amplifies the demand for advanced imaging equipment. Furthermore, government initiatives aimed at improving healthcare accessibility and quality in underserved regions are spurring the establishment of new diagnostic centers, thereby increasing the demand for imaging equipment.
- Leading Segment: Equipment: High market share and consistent demand due to the essential nature of imaging hardware.
- Key Drivers for Equipment Dominance:
- Infrastructure Development: Government and private sector investments in modern healthcare facilities.
- Disease Prevalence: Rising incidence of cardiac and oncological diseases necessitating advanced imaging.
- Technological Advancements: Continuous upgrades in scanner technology, offering higher resolution and faster acquisition times.
- Healthcare Policies: Initiatives promoting the establishment of diagnostic centers and improving healthcare access.
The Diagnostic Radioisotope segment, particularly PET Radioisotopes, is also experiencing substantial growth, driven by their critical role in oncological imaging and research. While its current market share is lower than equipment, its CAGR is projected to be significantly higher, around xx%, during the forecast period. This rapid expansion is fueled by advancements in radiotracer development, enabling more precise diagnosis and treatment monitoring for various cancers.
Perfusion Imaging Industry in India Product Landscape
The product landscape of India's Perfusion Imaging industry is characterized by continuous innovation in both imaging equipment and diagnostic radioisotopes. Equipment advancements focus on improving detector sensitivity, spatial resolution, and patient comfort, leading to enhanced diagnostic accuracy and reduced scan times. Companies are developing hybrid systems that integrate PET/CT and SPECT/CT capabilities for comprehensive diagnostic assessments. In the diagnostic radioisotope segment, the development of novel radiotracers for specific molecular targets, particularly in oncology and neurology, is a significant trend. These advancements aim to provide functional and metabolic information, complementing anatomical imaging and enabling personalized medicine approaches. Performance metrics are continuously being enhanced, with increasing emphasis on quantitative imaging techniques for precise disease assessment and treatment response monitoring.
Key Drivers, Barriers & Challenges in Perfusion Imaging Industry in India
Key Drivers: The primary forces propelling the Indian Perfusion Imaging market include the escalating prevalence of lifestyle diseases such as cardiovascular disorders and cancer, a burgeoning demand for accurate and early disease diagnosis, and significant government investments in healthcare infrastructure and technology. Technological advancements in SPECT and PET imaging, including improved radiotracer development and AI-driven image analysis, are also critical growth catalysts.
Barriers & Challenges: Supply chain disruptions for specialized radiopharmaceuticals and consumables can pose significant challenges. Regulatory hurdles related to the import and domestic production of radioisotopes and imaging equipment, along with stringent approval processes, can impact market entry and expansion. The high initial cost of advanced perfusion imaging systems and a shortage of skilled radiographers and nuclear medicine physicians in certain regions also present considerable restraints. Fierce competition from alternative diagnostic modalities and the need for continuous technological upgrades to remain competitive add further pressure. The estimated market impact of these challenges is projected to be a reduction of xx% in potential market growth if unaddressed.
Emerging Opportunities in Perfusion Imaging Industry in India
Emerging opportunities in the Indian Perfusion Imaging industry lie in the expanding application of PET imaging in oncology for precise staging and treatment response monitoring, and in neurology for early detection of neurodegenerative diseases. The increasing adoption of theranostics, combining diagnostic and therapeutic applications of radioisotopes, presents a significant untapped market. Furthermore, the growing focus on preventive healthcare and comprehensive health check-ups creates a demand for advanced screening tools, including perfusion imaging. The development of more compact and potentially lower-cost SPECT systems could also unlock opportunities in remote and underserved areas, increasing market penetration.
Growth Accelerators in the Perfusion Imaging Industry in India Industry
Several catalysts are driving long-term growth in India's Perfusion Imaging industry. Technological breakthroughs in detector technology, leading to higher sensitivity and better image quality, are crucial. Strategic partnerships between global imaging giants and Indian healthcare providers are accelerating the adoption of advanced technologies. Market expansion strategies by companies, including setting up local manufacturing facilities for radioisotopes and equipment, are further enhancing accessibility and reducing lead times. The increasing disposable income and a growing health-conscious population are also contributing to sustained demand for advanced diagnostic solutions.
Key Players Shaping the Perfusion Imaging Industry in India Market
- Canon Inc (Canon Medical Systems Corporation)
- Bayer AG
- Bracco Group
- Koninklijke Philips N V
- Siemens Healthineers AG
- GE Healthcare
- Curium
- Fujifilm Holdings Corporation
Notable Milestones in Perfusion Imaging Industry in India Sector
- July 2022: FUJIFILM Corporation inaugurated two new "NURA" health screening facilities in India, with a significant focus on cancer and lifestyle disorders.
- July 2022: Meenakshi Mission Hospital and Research Center (MMHRC) inaugurated a dedicated "breast-exclusive" PET scan facility.
In-Depth Perfusion Imaging Industry in India Market Outlook
The Indian Perfusion Imaging market is set for sustained and robust growth, driven by a strong interplay of technological innovation, increasing healthcare expenditure, and a heightened awareness of early disease detection. The strategic expansion of diagnostic infrastructure, coupled with the government's focus on improving healthcare accessibility, will continue to fuel demand for advanced imaging equipment and diagnostic radioisotopes. Emerging applications in areas like neurology and the burgeoning field of theranostics offer significant avenues for market expansion. Companies that can effectively address challenges related to cost, skilled manpower, and supply chain efficiency will be well-positioned to capitalize on the immense future potential, ensuring the sector remains a cornerstone of India's evolving healthcare landscape.
Perfusion Imaging Industry in India Segmentation
-
1. Product
- 1.1. Equipment
-
1.2. Diagnostic Radioisotope
- 1.2.1. SPECT Radioisotopes
- 1.2.2. PET Radioisotopes
-
2. Application
-
2.1. SPECT Application
- 2.1.1. Cardiology
- 2.1.2. Neurology
- 2.1.3. Thyroid
- 2.1.4. Other SPECT Applications
-
2.2. PET Application
- 2.2.1. Oncology
- 2.2.2. Other PET Applications
-
2.1. SPECT Application
Perfusion Imaging Industry in India Segmentation By Geography
-
1. North America
- 1.1. United States
- 1.2. Canada
- 1.3. Mexico
-
2. South America
- 2.1. Brazil
- 2.2. Argentina
- 2.3. Rest of South America
-
3. Europe
- 3.1. United Kingdom
- 3.2. Germany
- 3.3. France
- 3.4. Italy
- 3.5. Spain
- 3.6. Russia
- 3.7. Benelux
- 3.8. Nordics
- 3.9. Rest of Europe
-
4. Middle East & Africa
- 4.1. Turkey
- 4.2. Israel
- 4.3. GCC
- 4.4. North Africa
- 4.5. South Africa
- 4.6. Rest of Middle East & Africa
-
5. Asia Pacific
- 5.1. China
- 5.2. India
- 5.3. Japan
- 5.4. South Korea
- 5.5. ASEAN
- 5.6. Oceania
- 5.7. Rest of Asia Pacific
Perfusion Imaging Industry in India Regional Market Share
Geographic Coverage of Perfusion Imaging Industry in India
Perfusion Imaging Industry in India REPORT HIGHLIGHTS
| Aspects | Details |
|---|---|
| Study Period | 2020-2034 |
| Base Year | 2025 |
| Estimated Year | 2026 |
| Forecast Period | 2026-2034 |
| Historical Period | 2020-2025 |
| Growth Rate | CAGR of 4.92% from 2020-2034 |
| Segmentation |
|
Table of Contents
- 1. Introduction
- 1.1. Research Scope
- 1.2. Market Segmentation
- 1.3. Research Objective
- 1.4. Definitions and Assumptions
- 2. Executive Summary
- 2.1. Market Snapshot
- 3. Market Dynamics
- 3.1. Market Drivers
- 3.2. Market Restrains
- 3.3. Market Trends
- 3.4. Market Opportunities
- 4. Market Factor Analysis
- 4.1. Porters Five Forces
- 4.1.1. Bargaining Power of Suppliers
- 4.1.2. Bargaining Power of Buyers
- 4.1.3. Threat of New Entrants
- 4.1.4. Threat of Substitutes
- 4.1.5. Competitive Rivalry
- 4.2. PESTEL analysis
- 4.3. BCG Analysis
- 4.3.1. Stars (High Growth, High Market Share)
- 4.3.2. Cash Cows (Low Growth, High Market Share)
- 4.3.3. Question Mark (High Growth, Low Market Share)
- 4.3.4. Dogs (Low Growth, Low Market Share)
- 4.4. Ansoff Matrix Analysis
- 4.5. Supply Chain Analysis
- 4.6. Regulatory Landscape
- 4.7. Current Market Potential and Opportunity Assessment (TAM–SAM–SOM Framework)
- 4.8. IMR Analyst Note
- 4.1. Porters Five Forces
- 5. Market Analysis, Insights and Forecast 2021-2033
- 5.1. Market Analysis, Insights and Forecast - by Product
- 5.1.1. Equipment
- 5.1.2. Diagnostic Radioisotope
- 5.1.2.1. SPECT Radioisotopes
- 5.1.2.2. PET Radioisotopes
- 5.2. Market Analysis, Insights and Forecast - by Application
- 5.2.1. SPECT Application
- 5.2.1.1. Cardiology
- 5.2.1.2. Neurology
- 5.2.1.3. Thyroid
- 5.2.1.4. Other SPECT Applications
- 5.2.2. PET Application
- 5.2.2.1. Oncology
- 5.2.2.2. Other PET Applications
- 5.2.1. SPECT Application
- 5.3. Market Analysis, Insights and Forecast - by Region
- 5.3.1. North America
- 5.3.2. South America
- 5.3.3. Europe
- 5.3.4. Middle East & Africa
- 5.3.5. Asia Pacific
- 5.1. Market Analysis, Insights and Forecast - by Product
- 6. Global Perfusion Imaging Industry in India Analysis, Insights and Forecast, 2021-2033
- 6.1. Market Analysis, Insights and Forecast - by Product
- 6.1.1. Equipment
- 6.1.2. Diagnostic Radioisotope
- 6.1.2.1. SPECT Radioisotopes
- 6.1.2.2. PET Radioisotopes
- 6.2. Market Analysis, Insights and Forecast - by Application
- 6.2.1. SPECT Application
- 6.2.1.1. Cardiology
- 6.2.1.2. Neurology
- 6.2.1.3. Thyroid
- 6.2.1.4. Other SPECT Applications
- 6.2.2. PET Application
- 6.2.2.1. Oncology
- 6.2.2.2. Other PET Applications
- 6.2.1. SPECT Application
- 6.1. Market Analysis, Insights and Forecast - by Product
- 7. North America Perfusion Imaging Industry in India Analysis, Insights and Forecast, 2020-2032
- 7.1. Market Analysis, Insights and Forecast - by Product
- 7.1.1. Equipment
- 7.1.2. Diagnostic Radioisotope
- 7.1.2.1. SPECT Radioisotopes
- 7.1.2.2. PET Radioisotopes
- 7.2. Market Analysis, Insights and Forecast - by Application
- 7.2.1. SPECT Application
- 7.2.1.1. Cardiology
- 7.2.1.2. Neurology
- 7.2.1.3. Thyroid
- 7.2.1.4. Other SPECT Applications
- 7.2.2. PET Application
- 7.2.2.1. Oncology
- 7.2.2.2. Other PET Applications
- 7.2.1. SPECT Application
- 7.1. Market Analysis, Insights and Forecast - by Product
- 8. South America Perfusion Imaging Industry in India Analysis, Insights and Forecast, 2020-2032
- 8.1. Market Analysis, Insights and Forecast - by Product
- 8.1.1. Equipment
- 8.1.2. Diagnostic Radioisotope
- 8.1.2.1. SPECT Radioisotopes
- 8.1.2.2. PET Radioisotopes
- 8.2. Market Analysis, Insights and Forecast - by Application
- 8.2.1. SPECT Application
- 8.2.1.1. Cardiology
- 8.2.1.2. Neurology
- 8.2.1.3. Thyroid
- 8.2.1.4. Other SPECT Applications
- 8.2.2. PET Application
- 8.2.2.1. Oncology
- 8.2.2.2. Other PET Applications
- 8.2.1. SPECT Application
- 8.1. Market Analysis, Insights and Forecast - by Product
- 9. Europe Perfusion Imaging Industry in India Analysis, Insights and Forecast, 2020-2032
- 9.1. Market Analysis, Insights and Forecast - by Product
- 9.1.1. Equipment
- 9.1.2. Diagnostic Radioisotope
- 9.1.2.1. SPECT Radioisotopes
- 9.1.2.2. PET Radioisotopes
- 9.2. Market Analysis, Insights and Forecast - by Application
- 9.2.1. SPECT Application
- 9.2.1.1. Cardiology
- 9.2.1.2. Neurology
- 9.2.1.3. Thyroid
- 9.2.1.4. Other SPECT Applications
- 9.2.2. PET Application
- 9.2.2.1. Oncology
- 9.2.2.2. Other PET Applications
- 9.2.1. SPECT Application
- 9.1. Market Analysis, Insights and Forecast - by Product
- 10. Middle East & Africa Perfusion Imaging Industry in India Analysis, Insights and Forecast, 2020-2032
- 10.1. Market Analysis, Insights and Forecast - by Product
- 10.1.1. Equipment
- 10.1.2. Diagnostic Radioisotope
- 10.1.2.1. SPECT Radioisotopes
- 10.1.2.2. PET Radioisotopes
- 10.2. Market Analysis, Insights and Forecast - by Application
- 10.2.1. SPECT Application
- 10.2.1.1. Cardiology
- 10.2.1.2. Neurology
- 10.2.1.3. Thyroid
- 10.2.1.4. Other SPECT Applications
- 10.2.2. PET Application
- 10.2.2.1. Oncology
- 10.2.2.2. Other PET Applications
- 10.2.1. SPECT Application
- 10.1. Market Analysis, Insights and Forecast - by Product
- 11. Asia Pacific Perfusion Imaging Industry in India Analysis, Insights and Forecast, 2020-2032
- 11.1. Market Analysis, Insights and Forecast - by Product
- 11.1.1. Equipment
- 11.1.2. Diagnostic Radioisotope
- 11.1.2.1. SPECT Radioisotopes
- 11.1.2.2. PET Radioisotopes
- 11.2. Market Analysis, Insights and Forecast - by Application
- 11.2.1. SPECT Application
- 11.2.1.1. Cardiology
- 11.2.1.2. Neurology
- 11.2.1.3. Thyroid
- 11.2.1.4. Other SPECT Applications
- 11.2.2. PET Application
- 11.2.2.1. Oncology
- 11.2.2.2. Other PET Applications
- 11.2.1. SPECT Application
- 11.1. Market Analysis, Insights and Forecast - by Product
- 12. Competitive Analysis
- 12.1. Company Profiles
- 12.1.1 Canon Inc (Canon Medical Systems Corporation)
- 12.1.1.1. Company Overview
- 12.1.1.2. Products
- 12.1.1.3. Company Financials
- 12.1.1.4. SWOT Analysis
- 12.1.2 Bayer AG
- 12.1.2.1. Company Overview
- 12.1.2.2. Products
- 12.1.2.3. Company Financials
- 12.1.2.4. SWOT Analysis
- 12.1.3 Bracco Group
- 12.1.3.1. Company Overview
- 12.1.3.2. Products
- 12.1.3.3. Company Financials
- 12.1.3.4. SWOT Analysis
- 12.1.4 Koninklijke Philips N V
- 12.1.4.1. Company Overview
- 12.1.4.2. Products
- 12.1.4.3. Company Financials
- 12.1.4.4. SWOT Analysis
- 12.1.5 Siemens Healthineers AG
- 12.1.5.1. Company Overview
- 12.1.5.2. Products
- 12.1.5.3. Company Financials
- 12.1.5.4. SWOT Analysis
- 12.1.6 GE Healthcare
- 12.1.6.1. Company Overview
- 12.1.6.2. Products
- 12.1.6.3. Company Financials
- 12.1.6.4. SWOT Analysis
- 12.1.7 Curium
- 12.1.7.1. Company Overview
- 12.1.7.2. Products
- 12.1.7.3. Company Financials
- 12.1.7.4. SWOT Analysis
- 12.1.8 Fujifilm Holdings Corporation
- 12.1.8.1. Company Overview
- 12.1.8.2. Products
- 12.1.8.3. Company Financials
- 12.1.8.4. SWOT Analysis
- 12.1.1 Canon Inc (Canon Medical Systems Corporation)
- 12.2. Market Entropy
- 12.2.1 Company's Key Areas Served
- 12.2.2 Recent Developments
- 12.3. Company Market Share Analysis 2025
- 12.3.1 Top 5 Companies Market Share Analysis
- 12.3.2 Top 3 Companies Market Share Analysis
- 12.4. List of Potential Customers
- 13. Research Methodology
List of Figures
- Figure 1: Global Perfusion Imaging Industry in India Revenue Breakdown (Million, %) by Region 2025 & 2033
- Figure 2: North America Perfusion Imaging Industry in India Revenue (Million), by Product 2025 & 2033
- Figure 3: North America Perfusion Imaging Industry in India Revenue Share (%), by Product 2025 & 2033
- Figure 4: North America Perfusion Imaging Industry in India Revenue (Million), by Application 2025 & 2033
- Figure 5: North America Perfusion Imaging Industry in India Revenue Share (%), by Application 2025 & 2033
- Figure 6: North America Perfusion Imaging Industry in India Revenue (Million), by Country 2025 & 2033
- Figure 7: North America Perfusion Imaging Industry in India Revenue Share (%), by Country 2025 & 2033
- Figure 8: South America Perfusion Imaging Industry in India Revenue (Million), by Product 2025 & 2033
- Figure 9: South America Perfusion Imaging Industry in India Revenue Share (%), by Product 2025 & 2033
- Figure 10: South America Perfusion Imaging Industry in India Revenue (Million), by Application 2025 & 2033
- Figure 11: South America Perfusion Imaging Industry in India Revenue Share (%), by Application 2025 & 2033
- Figure 12: South America Perfusion Imaging Industry in India Revenue (Million), by Country 2025 & 2033
- Figure 13: South America Perfusion Imaging Industry in India Revenue Share (%), by Country 2025 & 2033
- Figure 14: Europe Perfusion Imaging Industry in India Revenue (Million), by Product 2025 & 2033
- Figure 15: Europe Perfusion Imaging Industry in India Revenue Share (%), by Product 2025 & 2033
- Figure 16: Europe Perfusion Imaging Industry in India Revenue (Million), by Application 2025 & 2033
- Figure 17: Europe Perfusion Imaging Industry in India Revenue Share (%), by Application 2025 & 2033
- Figure 18: Europe Perfusion Imaging Industry in India Revenue (Million), by Country 2025 & 2033
- Figure 19: Europe Perfusion Imaging Industry in India Revenue Share (%), by Country 2025 & 2033
- Figure 20: Middle East & Africa Perfusion Imaging Industry in India Revenue (Million), by Product 2025 & 2033
- Figure 21: Middle East & Africa Perfusion Imaging Industry in India Revenue Share (%), by Product 2025 & 2033
- Figure 22: Middle East & Africa Perfusion Imaging Industry in India Revenue (Million), by Application 2025 & 2033
- Figure 23: Middle East & Africa Perfusion Imaging Industry in India Revenue Share (%), by Application 2025 & 2033
- Figure 24: Middle East & Africa Perfusion Imaging Industry in India Revenue (Million), by Country 2025 & 2033
- Figure 25: Middle East & Africa Perfusion Imaging Industry in India Revenue Share (%), by Country 2025 & 2033
- Figure 26: Asia Pacific Perfusion Imaging Industry in India Revenue (Million), by Product 2025 & 2033
- Figure 27: Asia Pacific Perfusion Imaging Industry in India Revenue Share (%), by Product 2025 & 2033
- Figure 28: Asia Pacific Perfusion Imaging Industry in India Revenue (Million), by Application 2025 & 2033
- Figure 29: Asia Pacific Perfusion Imaging Industry in India Revenue Share (%), by Application 2025 & 2033
- Figure 30: Asia Pacific Perfusion Imaging Industry in India Revenue (Million), by Country 2025 & 2033
- Figure 31: Asia Pacific Perfusion Imaging Industry in India Revenue Share (%), by Country 2025 & 2033
List of Tables
- Table 1: Global Perfusion Imaging Industry in India Revenue Million Forecast, by Product 2020 & 2033
- Table 2: Global Perfusion Imaging Industry in India Revenue Million Forecast, by Application 2020 & 2033
- Table 3: Global Perfusion Imaging Industry in India Revenue Million Forecast, by Region 2020 & 2033
- Table 4: Global Perfusion Imaging Industry in India Revenue Million Forecast, by Product 2020 & 2033
- Table 5: Global Perfusion Imaging Industry in India Revenue Million Forecast, by Application 2020 & 2033
- Table 6: Global Perfusion Imaging Industry in India Revenue Million Forecast, by Country 2020 & 2033
- Table 7: United States Perfusion Imaging Industry in India Revenue (Million) Forecast, by Application 2020 & 2033
- Table 8: Canada Perfusion Imaging Industry in India Revenue (Million) Forecast, by Application 2020 & 2033
- Table 9: Mexico Perfusion Imaging Industry in India Revenue (Million) Forecast, by Application 2020 & 2033
- Table 10: Global Perfusion Imaging Industry in India Revenue Million Forecast, by Product 2020 & 2033
- Table 11: Global Perfusion Imaging Industry in India Revenue Million Forecast, by Application 2020 & 2033
- Table 12: Global Perfusion Imaging Industry in India Revenue Million Forecast, by Country 2020 & 2033
- Table 13: Brazil Perfusion Imaging Industry in India Revenue (Million) Forecast, by Application 2020 & 2033
- Table 14: Argentina Perfusion Imaging Industry in India Revenue (Million) Forecast, by Application 2020 & 2033
- Table 15: Rest of South America Perfusion Imaging Industry in India Revenue (Million) Forecast, by Application 2020 & 2033
- Table 16: Global Perfusion Imaging Industry in India Revenue Million Forecast, by Product 2020 & 2033
- Table 17: Global Perfusion Imaging Industry in India Revenue Million Forecast, by Application 2020 & 2033
- Table 18: Global Perfusion Imaging Industry in India Revenue Million Forecast, by Country 2020 & 2033
- Table 19: United Kingdom Perfusion Imaging Industry in India Revenue (Million) Forecast, by Application 2020 & 2033
- Table 20: Germany Perfusion Imaging Industry in India Revenue (Million) Forecast, by Application 2020 & 2033
- Table 21: France Perfusion Imaging Industry in India Revenue (Million) Forecast, by Application 2020 & 2033
- Table 22: Italy Perfusion Imaging Industry in India Revenue (Million) Forecast, by Application 2020 & 2033
- Table 23: Spain Perfusion Imaging Industry in India Revenue (Million) Forecast, by Application 2020 & 2033
- Table 24: Russia Perfusion Imaging Industry in India Revenue (Million) Forecast, by Application 2020 & 2033
- Table 25: Benelux Perfusion Imaging Industry in India Revenue (Million) Forecast, by Application 2020 & 2033
- Table 26: Nordics Perfusion Imaging Industry in India Revenue (Million) Forecast, by Application 2020 & 2033
- Table 27: Rest of Europe Perfusion Imaging Industry in India Revenue (Million) Forecast, by Application 2020 & 2033
- Table 28: Global Perfusion Imaging Industry in India Revenue Million Forecast, by Product 2020 & 2033
- Table 29: Global Perfusion Imaging Industry in India Revenue Million Forecast, by Application 2020 & 2033
- Table 30: Global Perfusion Imaging Industry in India Revenue Million Forecast, by Country 2020 & 2033
- Table 31: Turkey Perfusion Imaging Industry in India Revenue (Million) Forecast, by Application 2020 & 2033
- Table 32: Israel Perfusion Imaging Industry in India Revenue (Million) Forecast, by Application 2020 & 2033
- Table 33: GCC Perfusion Imaging Industry in India Revenue (Million) Forecast, by Application 2020 & 2033
- Table 34: North Africa Perfusion Imaging Industry in India Revenue (Million) Forecast, by Application 2020 & 2033
- Table 35: South Africa Perfusion Imaging Industry in India Revenue (Million) Forecast, by Application 2020 & 2033
- Table 36: Rest of Middle East & Africa Perfusion Imaging Industry in India Revenue (Million) Forecast, by Application 2020 & 2033
- Table 37: Global Perfusion Imaging Industry in India Revenue Million Forecast, by Product 2020 & 2033
- Table 38: Global Perfusion Imaging Industry in India Revenue Million Forecast, by Application 2020 & 2033
- Table 39: Global Perfusion Imaging Industry in India Revenue Million Forecast, by Country 2020 & 2033
- Table 40: China Perfusion Imaging Industry in India Revenue (Million) Forecast, by Application 2020 & 2033
- Table 41: India Perfusion Imaging Industry in India Revenue (Million) Forecast, by Application 2020 & 2033
- Table 42: Japan Perfusion Imaging Industry in India Revenue (Million) Forecast, by Application 2020 & 2033
- Table 43: South Korea Perfusion Imaging Industry in India Revenue (Million) Forecast, by Application 2020 & 2033
- Table 44: ASEAN Perfusion Imaging Industry in India Revenue (Million) Forecast, by Application 2020 & 2033
- Table 45: Oceania Perfusion Imaging Industry in India Revenue (Million) Forecast, by Application 2020 & 2033
- Table 46: Rest of Asia Pacific Perfusion Imaging Industry in India Revenue (Million) Forecast, by Application 2020 & 2033
Frequently Asked Questions
1. What is the projected Compound Annual Growth Rate (CAGR) of the Perfusion Imaging Industry in India?
The projected CAGR is approximately 4.92%.
2. Which companies are prominent players in the Perfusion Imaging Industry in India?
Key companies in the market include Canon Inc (Canon Medical Systems Corporation), Bayer AG, Bracco Group, Koninklijke Philips N V, Siemens Healthineers AG, GE Healthcare, Curium, Fujifilm Holdings Corporation.
3. What are the main segments of the Perfusion Imaging Industry in India?
The market segments include Product, Application.
4. Can you provide details about the market size?
The market size is estimated to be USD 316.44 Million as of 2022.
5. What are some drivers contributing to market growth?
Increasing Prevalence of Chronic Diseases; Rising Geriatric Population; Increasing Technological Advancements.
6. What are the notable trends driving market growth?
Equipment Segment is Expected to Hold a Significant Market Share Over the Forecast Period.
7. Are there any restraints impacting market growth?
Lack Of Proper Reimbursement And Stringent Regulatory Approval Procedures; High Cost of Equipment.
8. Can you provide examples of recent developments in the market?
In July 2022, in India, the FUJIFILM Corporation opened two new "NURA" health screening facilities with an emphasis on cancer and lifestyle disorders.
9. What pricing options are available for accessing the report?
Pricing options include single-user, multi-user, and enterprise licenses priced at USD 3800, USD 4500, and USD 5800 respectively.
10. Is the market size provided in terms of value or volume?
The market size is provided in terms of value, measured in Million.
11. Are there any specific market keywords associated with the report?
Yes, the market keyword associated with the report is "Perfusion Imaging Industry in India," which aids in identifying and referencing the specific market segment covered.
12. How do I determine which pricing option suits my needs best?
The pricing options vary based on user requirements and access needs. Individual users may opt for single-user licenses, while businesses requiring broader access may choose multi-user or enterprise licenses for cost-effective access to the report.
13. Are there any additional resources or data provided in the Perfusion Imaging Industry in India report?
While the report offers comprehensive insights, it's advisable to review the specific contents or supplementary materials provided to ascertain if additional resources or data are available.
14. How can I stay updated on further developments or reports in the Perfusion Imaging Industry in India?
To stay informed about further developments, trends, and reports in the Perfusion Imaging Industry in India, consider subscribing to industry newsletters, following relevant companies and organizations, or regularly checking reputable industry news sources and publications.
Methodology
Step 1 - Identification of Relevant Samples Size from Population Database


Step 2 - Approaches for Defining Global Market Size (Value, Volume* & Price*)

Note*: In applicable scenarios
Step 3 - Data Sources
Primary Research
- Web Analytics
- Survey Reports
- Research Institute
- Latest Research Reports
- Opinion Leaders
Secondary Research
- Annual Reports
- White Paper
- Latest Press Release
- Industry Association
- Paid Database
- Investor Presentations

Step 4 - Data Triangulation
Involves using different sources of information in order to increase the validity of a study
These sources are likely to be stakeholders in a program - participants, other researchers, program staff, other community members, and so on.
Then we put all data in single framework & apply various statistical tools to find out the dynamic on the market.
During the analysis stage, feedback from the stakeholder groups would be compared to determine areas of agreement as well as areas of divergence