

Key Insights
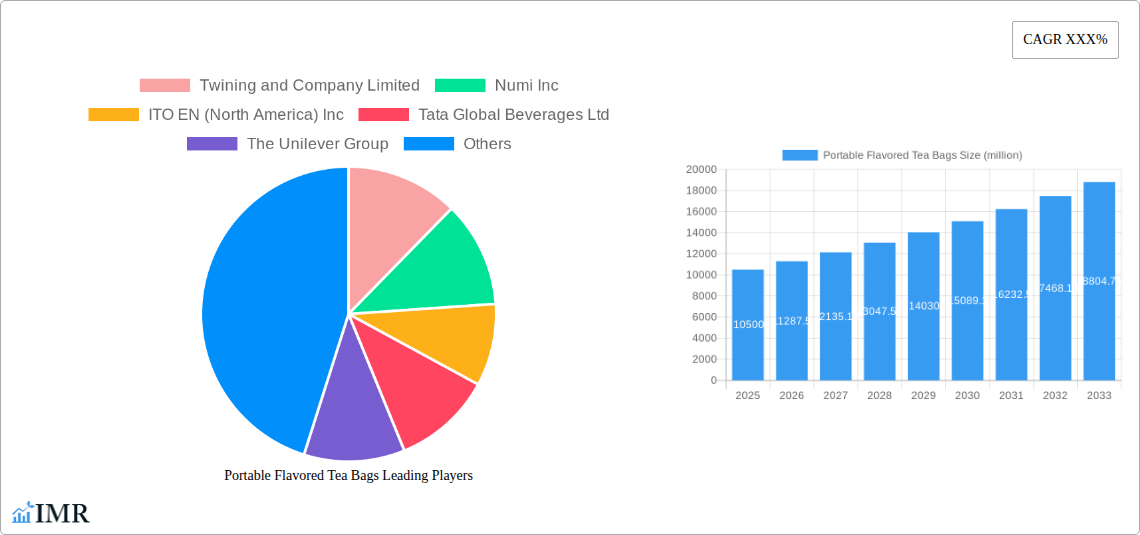
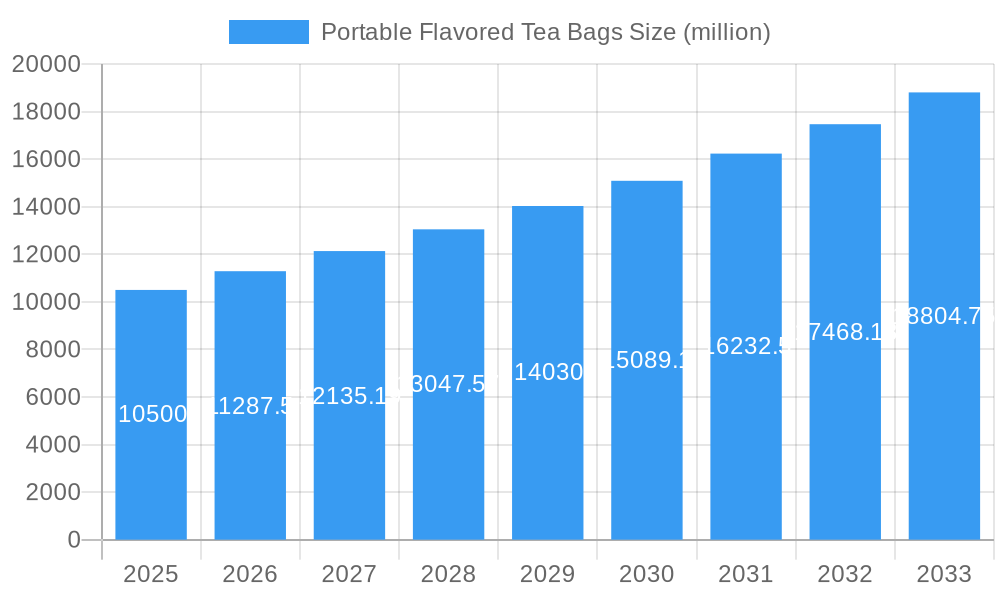
The global market for portable flavored tea bags is experiencing robust expansion, driven by increasing consumer demand for convenient, on-the-go beverage options and a growing appreciation for diverse flavor profiles beyond traditional black and green teas. This market is projected to reach an estimated USD 10,500 million by the end of 2025, with a significant compound annual growth rate (CAGR) of 7.5% anticipated over the forecast period of 2025-2033. The convenience factor, coupled with the health benefits associated with tea consumption and the introduction of innovative flavors like fruit-infused, herbal, and floral varieties, is fueling this growth. The "Others" category in tea types, encompassing a wide array of specialty blends and functional teas, is expected to be a key growth segment. Furthermore, the expanding reach of hypermarkets and supermarkets, alongside the proliferation of convenience stores, is ensuring wider accessibility for these products. The rising disposable incomes and a global shift towards healthier lifestyle choices further bolster the market's upward trajectory.
Portable Flavored Tea Bags Market Size (In Billion)
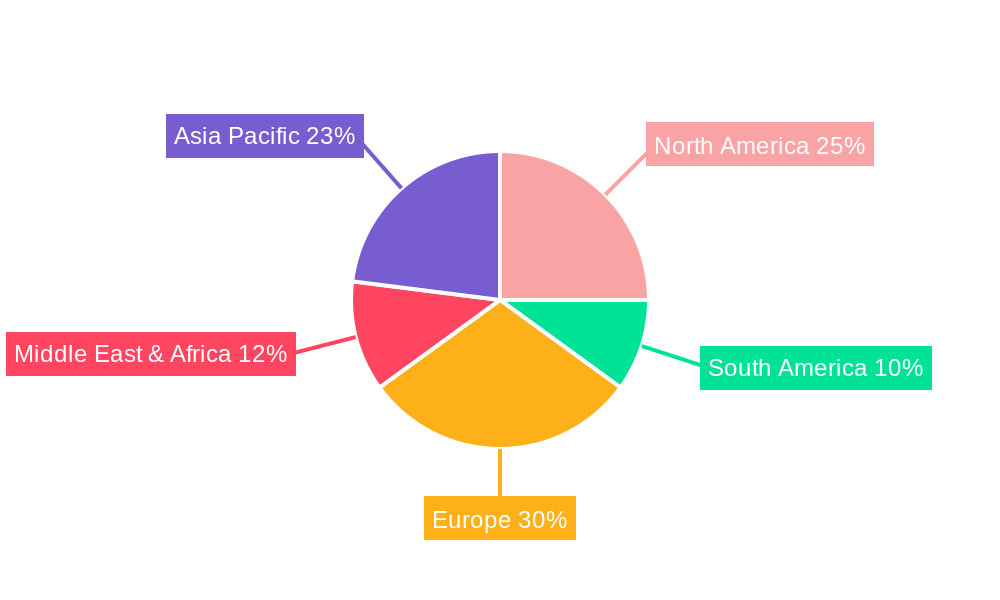
Geographically, the Asia Pacific region, particularly China and India, is anticipated to lead market growth due to their deeply ingrained tea culture and a rapidly evolving consumer base seeking premium and flavored options. North America and Europe also represent substantial markets, driven by a health-conscious demographic and a strong presence of established tea brands and innovative startups. Key market restraints include fluctuating raw material prices for tea leaves and flavoring agents, as well as intense competition from other ready-to-drink beverage categories. However, strategic product innovation, targeted marketing campaigns emphasizing health and convenience, and expanding distribution networks will be crucial for companies to capitalize on the significant opportunities presented by this dynamic and growing market. The focus on sustainable sourcing and eco-friendly packaging is also emerging as a critical trend influencing consumer purchasing decisions.
Portable Flavored Tea Bags Company Market Share
Portable Flavored Tea Bags Market Dynamics & Structure
The global portable flavored tea bags market exhibits a moderately concentrated structure, with established multinational corporations and a growing number of regional players vying for market share. Key players like The Unilever Group and Tata Global Beverages Ltd. command significant portions of the market, driven by extensive distribution networks and strong brand recognition. Technological innovation is primarily focused on improving flavor profiles, enhancing convenience, and developing sustainable packaging solutions. Regulatory frameworks, while generally supportive, can vary across regions, impacting product formulations and labeling. Competitive product substitutes include instant tea, ready-to-drink (RTD) beverages, and other flavored beverage options, necessitating continuous product differentiation. End-user demographics are diverse, encompassing health-conscious millennials, busy professionals, and individuals seeking convenient and flavorful beverage choices. Mergers and acquisitions (M&A) activity, while not as intense as in some other consumer goods sectors, plays a role in market consolidation and strategic expansion. For instance, an estimated 3 major M&A deals occurred in the historical period (2019-2024). Barriers to innovation include the cost of research and development for novel flavor combinations and the challenges in achieving consistent taste profiles across different brewing conditions.
- Market Concentration: Moderate, with leading players holding substantial market share.
- Technological Innovation Drivers: Flavor enhancement, convenient packaging, sustainability.
- Regulatory Frameworks: Varied across regions, influencing product development.
- Competitive Substitutes: Instant tea, RTD beverages, other flavored drinks.
- End-User Demographics: Health-conscious, busy professionals, convenience seekers.
- M&A Trends: Strategic acquisitions for market expansion and portfolio enhancement.
- Estimated M&A Deals (2019-2024): 3
Portable Flavored Tea Bags Growth Trends & Insights
The global portable flavored tea bags market is poised for robust growth, projected to expand significantly from an estimated market size of $7,250 million in the base year 2025 to a projected $11,500 million by the end of the forecast period in 2033. This impressive expansion will be fueled by a Compound Annual Growth Rate (CAGR) of approximately 5.8% during the forecast period (2025–2033). Historical data from 2019 to 2024 indicates a steady upward trajectory, with the market size growing from an estimated $5,500 million to $6,800 million, showcasing consistent consumer demand and increasing market penetration. The adoption rate of portable flavored tea bags is accelerating, driven by evolving consumer lifestyles that prioritize convenience and on-the-go consumption. Technological disruptions are playing a pivotal role, with advancements in aroma-locking technology, biodegradable packaging, and the introduction of novel, natural flavor infusions catering to the growing demand for healthier and more sophisticated beverage options. Consumer behavior shifts are a key determinant of this market's evolution. There's a discernible move away from traditional, plain tea towards more exciting and personalized flavor experiences. This includes a growing interest in functional teas offering health benefits, such as immunity-boosting, stress-relieving, or digestive aid properties. The perceived health benefits associated with tea, coupled with the added appeal of diverse flavors, are compelling consumers to incorporate these portable tea solutions into their daily routines. Furthermore, the increasing affordability and accessibility across various retail channels, from hypermarkets to online platforms, are democratizing the market and broadening its consumer base. The younger demographic, in particular, is embracing these products as a modern and convenient alternative to sugary drinks. The market penetration is expected to reach approximately 35% by 2033, up from an estimated 25% in 2025. This indicates substantial room for further growth and market development.
- Market Size (Base Year 2025): $7,250 million
- Market Size (Forecast Period End 2033): $11,500 million
- CAGR (2025–2033): 5.8%
- Market Size (Historical 2019): $5,500 million
- Market Size (Historical 2024): $6,800 million
- Market Penetration (Estimated 2025): 25%
- Market Penetration (Projected 2033): 35%
Dominant Regions, Countries, or Segments in Portable Flavored Tea Bags
The global portable flavored tea bags market's dominance is significantly influenced by the Application segment, with Hypermarkets and Supermarkets emerging as the primary growth driver. This segment is projected to capture approximately 45% of the total market share by 2033, propelled by their extensive reach, diverse product assortments, and the convenience they offer to a broad consumer base. The increasing consumer preference for one-stop shopping experiences further solidifies the position of hypermarkets and supermarkets. Major economies with high disposable incomes and a strong retail infrastructure, such as North America and Western Europe, are leading the adoption within this application segment. The presence of global giants like The Unilever Group and Tata Global Beverages Ltd., with their well-established supply chains and marketing prowess, further strengthens the dominance of hypermarkets and supermarkets.
Within the Type segment, Black Tea is expected to maintain its leadership, holding an estimated 38% of the market share by 2033. This enduring popularity is attributed to its robust flavor profile, perceived health benefits, and its established position as a staple beverage in many cultures. However, Green Tea is experiencing a surge in demand, driven by its association with health and wellness, and is projected to grow at a faster CAGR than black tea during the forecast period, capturing an estimated 30% of the market by 2033. The increasing consumer interest in functional beverages and the rising awareness of green tea's antioxidant properties are key factors contributing to its accelerated growth.
Geographically, North America is poised to remain the dominant region, accounting for an estimated 30% of the global market share by 2033. This dominance is fueled by a high per capita consumption of tea, a strong preference for flavored and convenient beverage options, and significant market penetration by key players. The United States, in particular, is a major contributor, with a growing segment of consumers actively seeking out premium and exotic tea flavors. Robust economic policies supporting the food and beverage industry, coupled with a well-developed distribution infrastructure, further bolster North America's leading position. Europe follows closely, with countries like the UK and Germany exhibiting strong demand for flavored tea.
- Dominant Application Segment: Hypermarkets and Supermarkets (projected 45% market share by 2033).
- Key Drivers for Hypermarkets/Supermarkets: Extensive reach, diverse assortments, one-stop shopping convenience.
- Dominant Tea Type: Black Tea (projected 38% market share by 2033).
- Fastest Growing Tea Type: Green Tea (projected 30% market share by 2033).
- Dominant Geographical Region: North America (projected 30% market share by 2033).
- Key Drivers for North America: High tea consumption, demand for flavored beverages, established distribution.
Portable Flavored Tea Bags Product Landscape
The portable flavored tea bags market is characterized by a dynamic product landscape driven by continuous innovation in flavor profiles and ingredient sourcing. Companies are actively developing unique blends that go beyond traditional fruit flavors, incorporating exotic fruits, floral notes, and even spiced infusions to cater to evolving consumer palates. Advancements in aroma-locking technology ensure that the freshness and vibrancy of flavors are preserved within the tea bags, enhancing the consumer experience. Packaging innovation is also a critical focus, with a growing emphasis on sustainable and biodegradable materials that appeal to environmentally conscious consumers. Performance metrics are increasingly evaluated on taste, aroma, convenience of brewing, and the perceived health benefits of the included ingredients. Unique selling propositions often revolve around premium, all-natural ingredients, functional benefits (e.g., energy-boosting, calming effects), and the creation of authentic taste experiences from diverse global tea traditions.
Key Drivers, Barriers & Challenges in Portable Flavored Tea Bags
The portable flavored tea bags market is propelled by several key drivers. The increasing demand for convenient and healthy beverage options, especially among busy urban populations, is a significant growth catalyst. The growing global awareness of tea's health benefits, coupled with the appeal of diverse and novel flavor profiles, further fuels consumer interest. Technological advancements in flavor encapsulation and sustainable packaging are making products more appealing and accessible.
However, the market faces several barriers and challenges. Fluctuating raw material prices, particularly for premium tea leaves and exotic flavor ingredients, can impact profit margins. Stringent regulatory requirements regarding food safety and labeling in different countries can also pose hurdles for market entry and expansion. Intense competition from established brands and the emergence of private label products exert downward pressure on pricing. Supply chain disruptions, as experienced in recent years, can affect product availability and lead times.
- Key Drivers:
- Demand for convenience and healthy beverages.
- Growing awareness of tea's health benefits.
- Innovation in flavor profiles and packaging.
- Barriers & Challenges:
- Volatile raw material prices.
- Complex regulatory landscapes.
- Intense competition and private label pressure.
- Supply chain vulnerabilities.
Emerging Opportunities in Portable Flavored Tea Bags
Emerging opportunities in the portable flavored tea bags sector lie in the untapped potential of functional beverages and niche flavor markets. The growing consumer interest in teas that offer specific health benefits, such as improved sleep, enhanced immunity, or digestive support, presents a significant avenue for product development. Furthermore, exploring unique regional flavor profiles from emerging markets, such as Southeast Asian herbal infusions or South American fruit essences, can attract discerning consumers seeking novel taste experiences. The expansion into e-commerce platforms, particularly through subscription box models, offers direct engagement with consumers and facilitates personalized product offerings, driving customer loyalty and market penetration.
Growth Accelerators in the Portable Flavored Tea Bags Industry
Several factors are acting as growth accelerators in the portable flavored tea bags industry. The ongoing trend towards premiumization in the beverage sector encourages the development of high-quality, ethically sourced, and uniquely flavored tea bags that command higher price points. Strategic partnerships between tea manufacturers and health and wellness influencers are crucial for building brand awareness and educating consumers about the benefits of flavored teas. Moreover, market expansion into developing economies with growing middle classes and increasing disposable incomes presents substantial opportunities for volume growth and broader market penetration. The continuous development of innovative brewing technologies that enhance the speed and quality of tea preparation further contributes to the appeal and adoption of portable tea solutions.
Key Players Shaping the Portable Flavored Tea Bags Market
- Twining and Company Limited
- Numi Inc
- ITO EN (North America) Inc
- Tata Global Beverages Ltd
- The Unilever Group
- Barry's Tea Ltd
- R.C. Bigelow
- Celestial Seasonings
- Harney & Sons Tea Corp
- Mighty Leaf Tea Company
- Cofco Limited
- Mengding Shanwei Duzhen Tea Industry
- Chayizuiren
- KOCA
- Longruntea
- UMTEA
- Gusong Economy And Trade
Notable Milestones in Portable Flavored Tea Bags Sector
- 2019: Introduction of biodegradable pyramid tea bags by several key players, enhancing sustainability credentials.
- 2020: Increased demand for immune-boosting flavored teas (e.g., with ginger, lemon, elderberry) due to global health concerns.
- 2021: Launch of functional flavored tea lines targeting specific wellness benefits like sleep and stress relief.
- 2022: Expansion of direct-to-consumer (DTC) sales channels and subscription box services by major brands.
- 2023: Significant investment in sustainable packaging solutions and the development of plant-based tea bag materials.
- 2024: Introduction of exotic and globally inspired flavor fusions, catering to adventurous consumer palates.
In-Depth Portable Flavored Tea Bags Market Outlook
The future of the portable flavored tea bags market appears exceptionally promising, driven by the persistent consumer pursuit of convenience, health consciousness, and diverse flavor experiences. Continued innovation in functional ingredients and sustainable packaging will serve as significant growth accelerators, aligning with evolving consumer values and regulatory landscapes. Strategic market expansion into emerging economies, coupled with a focus on premium product offerings, will unlock new revenue streams and solidify market dominance. The industry is poised for sustained growth, offering considerable strategic opportunities for both established players and agile new entrants looking to capture a share of this dynamic and expanding market.
Portable Flavored Tea Bags Segmentation
-
1. Application
- 1.1. Hypermarkets and Supermarkets
- 1.2. Convenience Stores
- 1.3. Others
-
2. Type
- 2.1. Black Tea
- 2.2. Green Tea
- 2.3. White Tea
- 2.4. Others
Portable Flavored Tea Bags Segmentation By Geography
-
1. North America
- 1.1. United States
- 1.2. Canada
- 1.3. Mexico
-
2. South America
- 2.1. Brazil
- 2.2. Argentina
- 2.3. Rest of South America
-
3. Europe
- 3.1. United Kingdom
- 3.2. Germany
- 3.3. France
- 3.4. Italy
- 3.5. Spain
- 3.6. Russia
- 3.7. Benelux
- 3.8. Nordics
- 3.9. Rest of Europe
-
4. Middle East & Africa
- 4.1. Turkey
- 4.2. Israel
- 4.3. GCC
- 4.4. North Africa
- 4.5. South Africa
- 4.6. Rest of Middle East & Africa
-
5. Asia Pacific
- 5.1. China
- 5.2. India
- 5.3. Japan
- 5.4. South Korea
- 5.5. ASEAN
- 5.6. Oceania
- 5.7. Rest of Asia Pacific
Portable Flavored Tea Bags Regional Market Share
Geographic Coverage of Portable Flavored Tea Bags
Portable Flavored Tea Bags REPORT HIGHLIGHTS
| Aspects | Details |
|---|---|
| Study Period | 2020-2034 |
| Base Year | 2025 |
| Estimated Year | 2026 |
| Forecast Period | 2026-2034 |
| Historical Period | 2020-2025 |
| Growth Rate | CAGR of 5.38% from 2020-2034 |
| Segmentation |
|
Table of Contents
- 1. Introduction
- 1.1. Research Scope
- 1.2. Market Segmentation
- 1.3. Research Methodology
- 1.4. Definitions and Assumptions
- 2. Executive Summary
- 2.1. Introduction
- 3. Market Dynamics
- 3.1. Introduction
- 3.2. Market Drivers
- 3.3. Market Restrains
- 3.4. Market Trends
- 4. Market Factor Analysis
- 4.1. Porters Five Forces
- 4.2. Supply/Value Chain
- 4.3. PESTEL analysis
- 4.4. Market Entropy
- 4.5. Patent/Trademark Analysis
- 5. Global Portable Flavored Tea Bags Analysis, Insights and Forecast, 2020-2032
- 5.1. Market Analysis, Insights and Forecast - by Application
- 5.1.1. Hypermarkets and Supermarkets
- 5.1.2. Convenience Stores
- 5.1.3. Others
- 5.2. Market Analysis, Insights and Forecast - by Type
- 5.2.1. Black Tea
- 5.2.2. Green Tea
- 5.2.3. White Tea
- 5.2.4. Others
- 5.3. Market Analysis, Insights and Forecast - by Region
- 5.3.1. North America
- 5.3.2. South America
- 5.3.3. Europe
- 5.3.4. Middle East & Africa
- 5.3.5. Asia Pacific
- 5.1. Market Analysis, Insights and Forecast - by Application
- 6. North America Portable Flavored Tea Bags Analysis, Insights and Forecast, 2020-2032
- 6.1. Market Analysis, Insights and Forecast - by Application
- 6.1.1. Hypermarkets and Supermarkets
- 6.1.2. Convenience Stores
- 6.1.3. Others
- 6.2. Market Analysis, Insights and Forecast - by Type
- 6.2.1. Black Tea
- 6.2.2. Green Tea
- 6.2.3. White Tea
- 6.2.4. Others
- 6.1. Market Analysis, Insights and Forecast - by Application
- 7. South America Portable Flavored Tea Bags Analysis, Insights and Forecast, 2020-2032
- 7.1. Market Analysis, Insights and Forecast - by Application
- 7.1.1. Hypermarkets and Supermarkets
- 7.1.2. Convenience Stores
- 7.1.3. Others
- 7.2. Market Analysis, Insights and Forecast - by Type
- 7.2.1. Black Tea
- 7.2.2. Green Tea
- 7.2.3. White Tea
- 7.2.4. Others
- 7.1. Market Analysis, Insights and Forecast - by Application
- 8. Europe Portable Flavored Tea Bags Analysis, Insights and Forecast, 2020-2032
- 8.1. Market Analysis, Insights and Forecast - by Application
- 8.1.1. Hypermarkets and Supermarkets
- 8.1.2. Convenience Stores
- 8.1.3. Others
- 8.2. Market Analysis, Insights and Forecast - by Type
- 8.2.1. Black Tea
- 8.2.2. Green Tea
- 8.2.3. White Tea
- 8.2.4. Others
- 8.1. Market Analysis, Insights and Forecast - by Application
- 9. Middle East & Africa Portable Flavored Tea Bags Analysis, Insights and Forecast, 2020-2032
- 9.1. Market Analysis, Insights and Forecast - by Application
- 9.1.1. Hypermarkets and Supermarkets
- 9.1.2. Convenience Stores
- 9.1.3. Others
- 9.2. Market Analysis, Insights and Forecast - by Type
- 9.2.1. Black Tea
- 9.2.2. Green Tea
- 9.2.3. White Tea
- 9.2.4. Others
- 9.1. Market Analysis, Insights and Forecast - by Application
- 10. Asia Pacific Portable Flavored Tea Bags Analysis, Insights and Forecast, 2020-2032
- 10.1. Market Analysis, Insights and Forecast - by Application
- 10.1.1. Hypermarkets and Supermarkets
- 10.1.2. Convenience Stores
- 10.1.3. Others
- 10.2. Market Analysis, Insights and Forecast - by Type
- 10.2.1. Black Tea
- 10.2.2. Green Tea
- 10.2.3. White Tea
- 10.2.4. Others
- 10.1. Market Analysis, Insights and Forecast - by Application
- 11. Competitive Analysis
- 11.1. Global Market Share Analysis 2025
- 11.2. Company Profiles
- 11.2.1 Twining and Company Limited
- 11.2.1.1. Overview
- 11.2.1.2. Products
- 11.2.1.3. SWOT Analysis
- 11.2.1.4. Recent Developments
- 11.2.1.5. Financials (Based on Availability)
- 11.2.2 Numi Inc
- 11.2.2.1. Overview
- 11.2.2.2. Products
- 11.2.2.3. SWOT Analysis
- 11.2.2.4. Recent Developments
- 11.2.2.5. Financials (Based on Availability)
- 11.2.3 ITO EN (North America) Inc
- 11.2.3.1. Overview
- 11.2.3.2. Products
- 11.2.3.3. SWOT Analysis
- 11.2.3.4. Recent Developments
- 11.2.3.5. Financials (Based on Availability)
- 11.2.4 Tata Global Beverages Ltd
- 11.2.4.1. Overview
- 11.2.4.2. Products
- 11.2.4.3. SWOT Analysis
- 11.2.4.4. Recent Developments
- 11.2.4.5. Financials (Based on Availability)
- 11.2.5 The Unilever Group
- 11.2.5.1. Overview
- 11.2.5.2. Products
- 11.2.5.3. SWOT Analysis
- 11.2.5.4. Recent Developments
- 11.2.5.5. Financials (Based on Availability)
- 11.2.6 Barry's Tea Ltd
- 11.2.6.1. Overview
- 11.2.6.2. Products
- 11.2.6.3. SWOT Analysis
- 11.2.6.4. Recent Developments
- 11.2.6.5. Financials (Based on Availability)
- 11.2.7 R.C. Bigelow
- 11.2.7.1. Overview
- 11.2.7.2. Products
- 11.2.7.3. SWOT Analysis
- 11.2.7.4. Recent Developments
- 11.2.7.5. Financials (Based on Availability)
- 11.2.8 Celestial Seasonings
- 11.2.8.1. Overview
- 11.2.8.2. Products
- 11.2.8.3. SWOT Analysis
- 11.2.8.4. Recent Developments
- 11.2.8.5. Financials (Based on Availability)
- 11.2.9 Harney & Sons Tea Corp
- 11.2.9.1. Overview
- 11.2.9.2. Products
- 11.2.9.3. SWOT Analysis
- 11.2.9.4. Recent Developments
- 11.2.9.5. Financials (Based on Availability)
- 11.2.10 Mighty Leaf Tea Company
- 11.2.10.1. Overview
- 11.2.10.2. Products
- 11.2.10.3. SWOT Analysis
- 11.2.10.4. Recent Developments
- 11.2.10.5. Financials (Based on Availability)
- 11.2.11 Cofco Limited
- 11.2.11.1. Overview
- 11.2.11.2. Products
- 11.2.11.3. SWOT Analysis
- 11.2.11.4. Recent Developments
- 11.2.11.5. Financials (Based on Availability)
- 11.2.12 Mengding Shanwei Duzhen Tea Industry
- 11.2.12.1. Overview
- 11.2.12.2. Products
- 11.2.12.3. SWOT Analysis
- 11.2.12.4. Recent Developments
- 11.2.12.5. Financials (Based on Availability)
- 11.2.13 Chayizuiren
- 11.2.13.1. Overview
- 11.2.13.2. Products
- 11.2.13.3. SWOT Analysis
- 11.2.13.4. Recent Developments
- 11.2.13.5. Financials (Based on Availability)
- 11.2.14 KOCA
- 11.2.14.1. Overview
- 11.2.14.2. Products
- 11.2.14.3. SWOT Analysis
- 11.2.14.4. Recent Developments
- 11.2.14.5. Financials (Based on Availability)
- 11.2.15 Longruntea
- 11.2.15.1. Overview
- 11.2.15.2. Products
- 11.2.15.3. SWOT Analysis
- 11.2.15.4. Recent Developments
- 11.2.15.5. Financials (Based on Availability)
- 11.2.16 UMTEA
- 11.2.16.1. Overview
- 11.2.16.2. Products
- 11.2.16.3. SWOT Analysis
- 11.2.16.4. Recent Developments
- 11.2.16.5. Financials (Based on Availability)
- 11.2.17 Gusong Economy And Trade
- 11.2.17.1. Overview
- 11.2.17.2. Products
- 11.2.17.3. SWOT Analysis
- 11.2.17.4. Recent Developments
- 11.2.17.5. Financials (Based on Availability)
- 11.2.1 Twining and Company Limited
List of Figures
- Figure 1: Global Portable Flavored Tea Bags Revenue Breakdown (undefined, %) by Region 2025 & 2033
- Figure 2: North America Portable Flavored Tea Bags Revenue (undefined), by Application 2025 & 2033
- Figure 3: North America Portable Flavored Tea Bags Revenue Share (%), by Application 2025 & 2033
- Figure 4: North America Portable Flavored Tea Bags Revenue (undefined), by Type 2025 & 2033
- Figure 5: North America Portable Flavored Tea Bags Revenue Share (%), by Type 2025 & 2033
- Figure 6: North America Portable Flavored Tea Bags Revenue (undefined), by Country 2025 & 2033
- Figure 7: North America Portable Flavored Tea Bags Revenue Share (%), by Country 2025 & 2033
- Figure 8: South America Portable Flavored Tea Bags Revenue (undefined), by Application 2025 & 2033
- Figure 9: South America Portable Flavored Tea Bags Revenue Share (%), by Application 2025 & 2033
- Figure 10: South America Portable Flavored Tea Bags Revenue (undefined), by Type 2025 & 2033
- Figure 11: South America Portable Flavored Tea Bags Revenue Share (%), by Type 2025 & 2033
- Figure 12: South America Portable Flavored Tea Bags Revenue (undefined), by Country 2025 & 2033
- Figure 13: South America Portable Flavored Tea Bags Revenue Share (%), by Country 2025 & 2033
- Figure 14: Europe Portable Flavored Tea Bags Revenue (undefined), by Application 2025 & 2033
- Figure 15: Europe Portable Flavored Tea Bags Revenue Share (%), by Application 2025 & 2033
- Figure 16: Europe Portable Flavored Tea Bags Revenue (undefined), by Type 2025 & 2033
- Figure 17: Europe Portable Flavored Tea Bags Revenue Share (%), by Type 2025 & 2033
- Figure 18: Europe Portable Flavored Tea Bags Revenue (undefined), by Country 2025 & 2033
- Figure 19: Europe Portable Flavored Tea Bags Revenue Share (%), by Country 2025 & 2033
- Figure 20: Middle East & Africa Portable Flavored Tea Bags Revenue (undefined), by Application 2025 & 2033
- Figure 21: Middle East & Africa Portable Flavored Tea Bags Revenue Share (%), by Application 2025 & 2033
- Figure 22: Middle East & Africa Portable Flavored Tea Bags Revenue (undefined), by Type 2025 & 2033
- Figure 23: Middle East & Africa Portable Flavored Tea Bags Revenue Share (%), by Type 2025 & 2033
- Figure 24: Middle East & Africa Portable Flavored Tea Bags Revenue (undefined), by Country 2025 & 2033
- Figure 25: Middle East & Africa Portable Flavored Tea Bags Revenue Share (%), by Country 2025 & 2033
- Figure 26: Asia Pacific Portable Flavored Tea Bags Revenue (undefined), by Application 2025 & 2033
- Figure 27: Asia Pacific Portable Flavored Tea Bags Revenue Share (%), by Application 2025 & 2033
- Figure 28: Asia Pacific Portable Flavored Tea Bags Revenue (undefined), by Type 2025 & 2033
- Figure 29: Asia Pacific Portable Flavored Tea Bags Revenue Share (%), by Type 2025 & 2033
- Figure 30: Asia Pacific Portable Flavored Tea Bags Revenue (undefined), by Country 2025 & 2033
- Figure 31: Asia Pacific Portable Flavored Tea Bags Revenue Share (%), by Country 2025 & 2033
List of Tables
- Table 1: Global Portable Flavored Tea Bags Revenue undefined Forecast, by Application 2020 & 2033
- Table 2: Global Portable Flavored Tea Bags Revenue undefined Forecast, by Type 2020 & 2033
- Table 3: Global Portable Flavored Tea Bags Revenue undefined Forecast, by Region 2020 & 2033
- Table 4: Global Portable Flavored Tea Bags Revenue undefined Forecast, by Application 2020 & 2033
- Table 5: Global Portable Flavored Tea Bags Revenue undefined Forecast, by Type 2020 & 2033
- Table 6: Global Portable Flavored Tea Bags Revenue undefined Forecast, by Country 2020 & 2033
- Table 7: United States Portable Flavored Tea Bags Revenue (undefined) Forecast, by Application 2020 & 2033
- Table 8: Canada Portable Flavored Tea Bags Revenue (undefined) Forecast, by Application 2020 & 2033
- Table 9: Mexico Portable Flavored Tea Bags Revenue (undefined) Forecast, by Application 2020 & 2033
- Table 10: Global Portable Flavored Tea Bags Revenue undefined Forecast, by Application 2020 & 2033
- Table 11: Global Portable Flavored Tea Bags Revenue undefined Forecast, by Type 2020 & 2033
- Table 12: Global Portable Flavored Tea Bags Revenue undefined Forecast, by Country 2020 & 2033
- Table 13: Brazil Portable Flavored Tea Bags Revenue (undefined) Forecast, by Application 2020 & 2033
- Table 14: Argentina Portable Flavored Tea Bags Revenue (undefined) Forecast, by Application 2020 & 2033
- Table 15: Rest of South America Portable Flavored Tea Bags Revenue (undefined) Forecast, by Application 2020 & 2033
- Table 16: Global Portable Flavored Tea Bags Revenue undefined Forecast, by Application 2020 & 2033
- Table 17: Global Portable Flavored Tea Bags Revenue undefined Forecast, by Type 2020 & 2033
- Table 18: Global Portable Flavored Tea Bags Revenue undefined Forecast, by Country 2020 & 2033
- Table 19: United Kingdom Portable Flavored Tea Bags Revenue (undefined) Forecast, by Application 2020 & 2033
- Table 20: Germany Portable Flavored Tea Bags Revenue (undefined) Forecast, by Application 2020 & 2033
- Table 21: France Portable Flavored Tea Bags Revenue (undefined) Forecast, by Application 2020 & 2033
- Table 22: Italy Portable Flavored Tea Bags Revenue (undefined) Forecast, by Application 2020 & 2033
- Table 23: Spain Portable Flavored Tea Bags Revenue (undefined) Forecast, by Application 2020 & 2033
- Table 24: Russia Portable Flavored Tea Bags Revenue (undefined) Forecast, by Application 2020 & 2033
- Table 25: Benelux Portable Flavored Tea Bags Revenue (undefined) Forecast, by Application 2020 & 2033
- Table 26: Nordics Portable Flavored Tea Bags Revenue (undefined) Forecast, by Application 2020 & 2033
- Table 27: Rest of Europe Portable Flavored Tea Bags Revenue (undefined) Forecast, by Application 2020 & 2033
- Table 28: Global Portable Flavored Tea Bags Revenue undefined Forecast, by Application 2020 & 2033
- Table 29: Global Portable Flavored Tea Bags Revenue undefined Forecast, by Type 2020 & 2033
- Table 30: Global Portable Flavored Tea Bags Revenue undefined Forecast, by Country 2020 & 2033
- Table 31: Turkey Portable Flavored Tea Bags Revenue (undefined) Forecast, by Application 2020 & 2033
- Table 32: Israel Portable Flavored Tea Bags Revenue (undefined) Forecast, by Application 2020 & 2033
- Table 33: GCC Portable Flavored Tea Bags Revenue (undefined) Forecast, by Application 2020 & 2033
- Table 34: North Africa Portable Flavored Tea Bags Revenue (undefined) Forecast, by Application 2020 & 2033
- Table 35: South Africa Portable Flavored Tea Bags Revenue (undefined) Forecast, by Application 2020 & 2033
- Table 36: Rest of Middle East & Africa Portable Flavored Tea Bags Revenue (undefined) Forecast, by Application 2020 & 2033
- Table 37: Global Portable Flavored Tea Bags Revenue undefined Forecast, by Application 2020 & 2033
- Table 38: Global Portable Flavored Tea Bags Revenue undefined Forecast, by Type 2020 & 2033
- Table 39: Global Portable Flavored Tea Bags Revenue undefined Forecast, by Country 2020 & 2033
- Table 40: China Portable Flavored Tea Bags Revenue (undefined) Forecast, by Application 2020 & 2033
- Table 41: India Portable Flavored Tea Bags Revenue (undefined) Forecast, by Application 2020 & 2033
- Table 42: Japan Portable Flavored Tea Bags Revenue (undefined) Forecast, by Application 2020 & 2033
- Table 43: South Korea Portable Flavored Tea Bags Revenue (undefined) Forecast, by Application 2020 & 2033
- Table 44: ASEAN Portable Flavored Tea Bags Revenue (undefined) Forecast, by Application 2020 & 2033
- Table 45: Oceania Portable Flavored Tea Bags Revenue (undefined) Forecast, by Application 2020 & 2033
- Table 46: Rest of Asia Pacific Portable Flavored Tea Bags Revenue (undefined) Forecast, by Application 2020 & 2033
Frequently Asked Questions
1. What is the projected Compound Annual Growth Rate (CAGR) of the Portable Flavored Tea Bags?
The projected CAGR is approximately 5.38%.
2. Which companies are prominent players in the Portable Flavored Tea Bags?
Key companies in the market include Twining and Company Limited, Numi Inc, ITO EN (North America) Inc, Tata Global Beverages Ltd, The Unilever Group, Barry's Tea Ltd, R.C. Bigelow, Celestial Seasonings, Harney & Sons Tea Corp, Mighty Leaf Tea Company, Cofco Limited, Mengding Shanwei Duzhen Tea Industry, Chayizuiren, KOCA, Longruntea, UMTEA, Gusong Economy And Trade.
3. What are the main segments of the Portable Flavored Tea Bags?
The market segments include Application, Type.
4. Can you provide details about the market size?
The market size is estimated to be USD XXX N/A as of 2022.
5. What are some drivers contributing to market growth?
N/A
6. What are the notable trends driving market growth?
N/A
7. Are there any restraints impacting market growth?
N/A
8. Can you provide examples of recent developments in the market?
N/A
9. What pricing options are available for accessing the report?
Pricing options include single-user, multi-user, and enterprise licenses priced at USD 4250.00, USD 6375.00, and USD 8500.00 respectively.
10. Is the market size provided in terms of value or volume?
The market size is provided in terms of value, measured in N/A.
11. Are there any specific market keywords associated with the report?
Yes, the market keyword associated with the report is "Portable Flavored Tea Bags," which aids in identifying and referencing the specific market segment covered.
12. How do I determine which pricing option suits my needs best?
The pricing options vary based on user requirements and access needs. Individual users may opt for single-user licenses, while businesses requiring broader access may choose multi-user or enterprise licenses for cost-effective access to the report.
13. Are there any additional resources or data provided in the Portable Flavored Tea Bags report?
While the report offers comprehensive insights, it's advisable to review the specific contents or supplementary materials provided to ascertain if additional resources or data are available.
14. How can I stay updated on further developments or reports in the Portable Flavored Tea Bags?
To stay informed about further developments, trends, and reports in the Portable Flavored Tea Bags, consider subscribing to industry newsletters, following relevant companies and organizations, or regularly checking reputable industry news sources and publications.
Methodology
Step 1 - Identification of Relevant Samples Size from Population Database


Step 2 - Approaches for Defining Global Market Size (Value, Volume* & Price*)

Note*: In applicable scenarios
Step 3 - Data Sources
Primary Research
- Web Analytics
- Survey Reports
- Research Institute
- Latest Research Reports
- Opinion Leaders
Secondary Research
- Annual Reports
- White Paper
- Latest Press Release
- Industry Association
- Paid Database
- Investor Presentations

Step 4 - Data Triangulation
Involves using different sources of information in order to increase the validity of a study
These sources are likely to be stakeholders in a program - participants, other researchers, program staff, other community members, and so on.
Then we put all data in single framework & apply various statistical tools to find out the dynamic on the market.
During the analysis stage, feedback from the stakeholder groups would be compared to determine areas of agreement as well as areas of divergence