

Key Insights
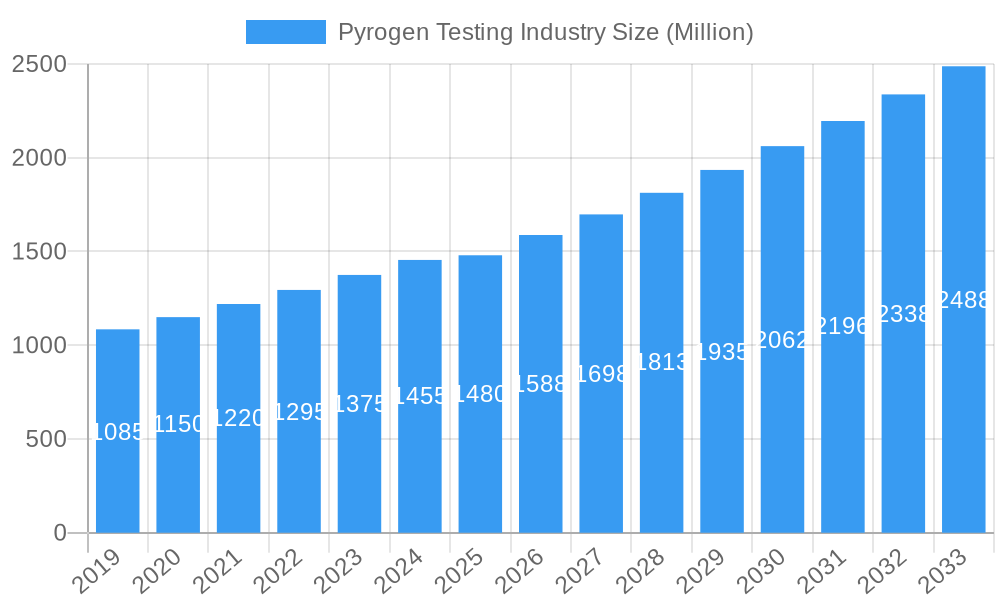
The Pyrogen Testing Market is poised for significant expansion, projected to reach approximately USD 1.48 billion in 2025, with a robust Compound Annual Growth Rate (CAGR) of 7.13% anticipated through 2033. This upward trajectory is primarily fueled by the escalating demand for parenteral drugs and sophisticated medical devices, both of which necessitate stringent pyrogenicity assessments to ensure patient safety. The growing emphasis on pharmaceutical and biopharmaceutical product quality, coupled with increasingly rigorous regulatory frameworks worldwide, further underpins this market growth. Key drivers include advancements in testing methodologies, such as the widespread adoption of more sensitive and efficient LAL (Limulus Amebocyte Lysate) tests, including chromogenic, turbidimetric, and gel clot variants, alongside the increasing utilization of Rabbit Pyrogen Tests and Monocyte Activation Tests for comprehensive safety profiling. The pharmaceutical and biotechnology sector emerges as a dominant end-user, investing heavily in these testing solutions to meet compliance standards and maintain the integrity of their innovative therapies.
Pyrogen Testing Industry Market Size (In Billion)
The market's expansion is further bolstered by ongoing research and development efforts aimed at creating faster, more cost-effective, and animal-alternative pyrogen testing solutions, addressing growing ethical concerns and the need for rapid batch release. The "Other Test Types" segment, encompassing emerging technologies and novel assay development, is also expected to witness considerable growth. Geographically, North America and Europe currently hold substantial market shares due to their established pharmaceutical industries, advanced healthcare infrastructure, and stringent regulatory oversight. However, the Asia Pacific region is anticipated to exhibit the highest growth rate, driven by a burgeoning biopharmaceutical manufacturing base, increasing healthcare expenditure, and a growing awareness of product safety standards in emerging economies. Restraints, such as the high initial investment for advanced testing instruments and the availability of alternative, albeit less comprehensive, testing methods, are present but are increasingly being outweighed by the compelling need for reliable and regulatory-compliant pyrogen detection.
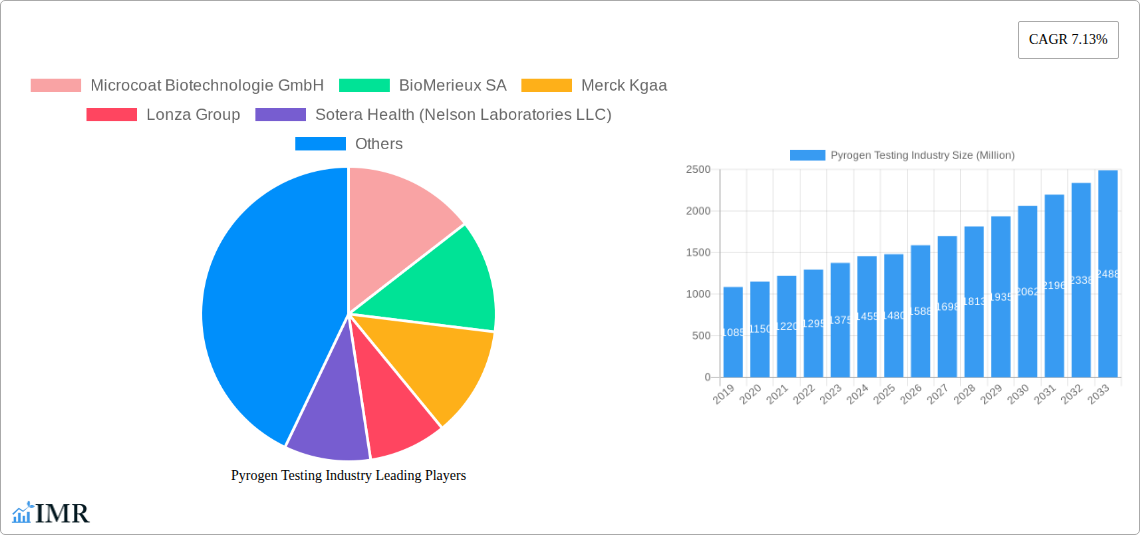
Pyrogen Testing Industry Company Market Share
This in-depth report provides a detailed analysis of the global Pyrogen Testing Industry, offering critical insights for stakeholders and industry professionals. Spanning a comprehensive study period from 2019 to 2033, with a base year of 2025, this report delves into market dynamics, growth trajectories, regional dominance, product innovation, key challenges, and emerging opportunities. We present a meticulously researched overview of the parent and child markets, with all values presented in Million units for clear understanding.
Pyrogen Testing Industry Market Dynamics & Structure
The Pyrogen Testing Industry exhibits a moderately concentrated market structure, characterized by significant technological innovation and stringent regulatory frameworks. The increasing demand for parenteral drugs and biologics, coupled with the rising incidence of hospital-acquired infections, are primary drivers propelling market growth. Key companies like Thermo Fisher Scientific Inc., Merck Kgaa, and Lonza Group are actively investing in research and development to enhance the sensitivity and speed of pyrogen testing methods. Regulatory bodies such as the FDA and EMA continue to emphasize the importance of robust pyrogenicity testing, driving adoption of advanced technologies. Competitive product substitutes, including advancements in non-animal-based assays, are emerging but have yet to fully displace established methods like Limulus Amebocyte Lysate (LAL) tests. End-user demographics are shifting towards a greater reliance on outsourced testing services, particularly among small and medium-sized enterprises (SMEs) in the pharmaceutical and biotechnology sectors. Merger and acquisition (M&A) activity remains robust, with companies seeking to expand their service portfolios and geographical reach. For instance, the acquisition of Sotera Health (Nelson Laboratories LLC) by a private equity firm signals consolidation trends.
- Market Concentration: Moderately concentrated with key players dominating market share.
- Technological Innovation: Driven by the need for faster, more sensitive, and cost-effective pyrogen detection methods.
- Regulatory Frameworks: Stringent guidelines from agencies like FDA and EMA are critical market determinants.
- Competitive Product Substitutes: Emergence of in vitro alternatives to traditional rabbit tests.
- End-User Demographics: Increasing outsourcing of pyrogen testing by pharmaceutical and biotech companies.
- M&A Trends: Strategic acquisitions to expand service offerings and market presence.
Pyrogen Testing Industry Growth Trends & Insights
The Pyrogen Testing Industry is poised for substantial growth, driven by an expanding global pharmaceutical and biotechnology sector, increasing healthcare expenditure, and a heightened emphasis on patient safety. The market size evolution is projected to witness a healthy Compound Annual Growth Rate (CAGR) of xx% from 2025 to 2033. Adoption rates for advanced pyrogen testing methods, particularly LAL-based assays, are on an upward trajectory due to their reliability and regulatory acceptance. Technological disruptions, such as the development of cell-based assays and advanced instrumentation, are transforming the testing landscape, offering faster turnaround times and improved accuracy. Consumer behavior shifts are evident in the increasing demand for rapid and reliable testing solutions, especially for biologics and complex drug formulations. The market penetration of LAL tests, which currently holds a dominant share, is expected to continue its growth, supported by ongoing innovation in chromogenic and turbidimetric formats. The growing complexity of drug development, including cell and gene therapies, necessitates sophisticated pyrogen testing, further fueling market expansion. The increasing global prevalence of infectious diseases and the corresponding growth in the vaccine market also contribute significantly to the demand for pyrogen testing services. Furthermore, stringent regulatory requirements worldwide mandate rigorous pyrogen testing for all injectable products, creating a stable and growing demand.
Dominant Regions, Countries, or Segments in Pyrogen Testing Industry
North America, led by the United States, currently dominates the global Pyrogen Testing Industry, driven by a robust pharmaceutical and biotechnology ecosystem, significant R&D investments, and stringent regulatory oversight. The region's dominance is further bolstered by the presence of leading pyrogen testing service providers and instrument manufacturers. In terms of product segments, Kits and Reagents are the largest segment, accounting for an estimated xx% of the market share in 2025, owing to their widespread use in routine testing. Among test types, LAL Tests, particularly Chromogenic Tests, are the most prominent, driven by their speed, sensitivity, and cost-effectiveness. The Pharmaceutical and Biotechnology Companies segment constitutes the largest end-user group, representing approximately xx% of the market share, due to the extensive use of pyrogen testing in drug development and quality control.
Key drivers for North America's dominance include:
- Economic Policies: Favorable government policies supporting pharmaceutical research and development.
- Infrastructure: Well-developed healthcare and research infrastructure.
- Regulatory Landscape: Strict adherence to FDA guidelines for drug safety and efficacy.
- Market Penetration: High adoption rates of advanced pyrogen testing technologies.
The Services segment is also experiencing significant growth, as more companies opt for outsourced testing solutions. This trend is particularly pronounced in the Medical Device Companies end-user segment, where specialized expertise and adherence to evolving regulations are crucial. The Asia-Pacific region, with countries like China and India, is emerging as a high-growth market due to the rapid expansion of its pharmaceutical manufacturing capabilities and increasing investments in quality control measures. This regional growth is further fueled by the increasing number of contract research organizations (CROs) and contract manufacturing organizations (CMOs) operating in these areas.
Pyrogen Testing Industry Product Landscape
The Pyrogen Testing Industry's product landscape is characterized by continuous innovation in assay development and instrumentation. Kits and Reagents, predominantly based on the Limulus Amebocyte Lysate (LAL) assay, remain the cornerstone, offering both chromogenic and turbidimetric formats that provide rapid and sensitive detection of bacterial endotoxins. Advancements in Instruments are focused on automating testing processes, improving data management, and reducing hands-on time. Services are increasingly sophisticated, encompassing comprehensive testing strategies, validation support, and consultation. Unique selling propositions include enhanced sensitivity, reduced assay times, and improved specificity, catering to the evolving needs of biologics, vaccines, and advanced therapies.
Key Drivers, Barriers & Challenges in Pyrogen Testing Industry
Key Drivers:
- Escalating demand for parenteral drugs and biologics: The expanding global market for injectables fuels the need for rigorous pyrogen testing.
- Stringent regulatory requirements: Global health authorities mandate strict endotoxin limits for pharmaceutical products.
- Increasing incidence of hospital-acquired infections: Growing awareness of contamination risks drives demand for effective pyrogen detection.
- Technological advancements in LAL and alternative assays: Innovations enhance speed, sensitivity, and cost-effectiveness of testing.
- Growth of the biopharmaceutical industry and outsourcing trends: Increased R&D in biologics and gene therapies necessitates specialized testing services.
Barriers & Challenges:
- High cost of instrumentation and reagents: Advanced technologies can be prohibitively expensive for smaller laboratories.
- Stringent validation requirements for new methods: Introducing novel pyrogen testing approaches involves lengthy and costly validation processes.
- Competition from established methods: Existing LAL-based tests, while effective, face competition from emerging alternative assays.
- Skilled workforce shortage: A lack of trained personnel capable of performing complex pyrogen testing procedures.
- Supply chain disruptions: Potential interruptions in the supply of critical raw materials and reagents.
Emerging Opportunities in Pyrogen Testing Industry
Emerging opportunities in the Pyrogen Testing Industry lie in the development and adoption of fully in vitro, non-animal-based pyrogen testing methods, such as the Monocyte Activation Test (MAT) and Toll-like Receptor (TLR) assays, which offer potential ethical and efficiency advantages over traditional rabbit tests. The rapidly growing field of cell and gene therapies presents a significant untapped market, requiring specialized and sensitive pyrogen detection. Furthermore, the expansion of biopharmaceutical manufacturing in emerging economies and the increasing demand for point-of-care diagnostic devices offer new avenues for market penetration. Automation and AI-driven data analysis for pyrogen testing platforms also represent a promising area for innovation and market growth.
Growth Accelerators in the Pyrogen Testing Industry Industry
Long-term growth in the Pyrogen Testing Industry will be significantly accelerated by ongoing technological breakthroughs in developing highly sensitive and rapid pyrogen detection methods. Strategic partnerships between instrument manufacturers, reagent suppliers, and contract research organizations (CROs) will foster collaborative innovation and market expansion. Furthermore, proactive engagement with regulatory bodies to streamline the validation and approval processes for novel testing technologies will be crucial. Market expansion strategies targeting underserved regions and the development of cost-effective solutions for smaller pharmaceutical and biotechnology companies will also act as significant growth catalysts.
Key Players Shaping the Pyrogen Testing Industry Market
- Microcoat Biotechnologie GmbH
- BioMerieux SA
- Merck Kgaa
- Lonza Group
- Sotera Health (Nelson Laboratories LLC)
- Fujifilm Holdings Corporation (FUJIFILM Wako Pure Chemical Corporation)
- Eurofins Scientific
- Thermo Fisher Scientific Inc.
- WUXI Pharmatech (Cayman) Inc.
- Genscript
- Associates of Cape Cod Inc (Seikagaku Biobusiness Corporation)
- Charles River Laboratories Inc.
- Sanquin
- Pyrostar
- Ellab AS
Notable Milestones in Pyrogen Testing Industry Sector
- 2019: Launch of advanced chromogenic LAL reagent kits with enhanced sensitivity.
- 2020: Increased regulatory focus on endotoxin testing for novel biologics and vaccines.
- 2021: Significant investment in the development of alternative non-animal pyrogen testing methods.
- 2022: Expansion of pyrogen testing services by major CROs to meet growing demand.
- 2023: Advancements in automated laboratory instrumentation for faster pyrogen testing.
- 2024: Strategic collaborations aimed at developing integrated pyrogen testing solutions.
In-Depth Pyrogen Testing Industry Market Outlook
The future market outlook for the Pyrogen Testing Industry is exceptionally positive, driven by sustained growth in the pharmaceutical and biotechnology sectors, coupled with increasingly stringent global regulatory standards. Key growth accelerators include continuous technological innovation in both LAL-based and alternative pyrogen testing methods, leading to faster, more sensitive, and cost-effective solutions. Strategic partnerships and market expansion initiatives, particularly in emerging economies, will further fuel market penetration. The growing demand for cell and gene therapies, and the ongoing development of novel parenteral drugs, will create sustained opportunities. The industry is poised for significant transformation, with a strong emphasis on automation, data analytics, and the widespread adoption of in vitro testing technologies.
Pyrogen Testing Industry Segmentation
-
1. Product
- 1.1. Kits and Reagents
- 1.2. Services
- 1.3. Instruments
-
2. Test Type
-
2.1. LAL Tests
- 2.1.1. Chromogenic Tests
- 2.1.2. Turbidimetric Tests
- 2.1.3. Gel Clot Tests
- 2.2. Rabbit Pyrogen Test
- 2.3. Monocyte Activation Test
- 2.4. Other Test Types
-
2.1. LAL Tests
-
3. End User
- 3.1. Pharmaceutical and Biotechnology Companies
- 3.2. Medical Device Companies
- 3.3. Other End Users
Pyrogen Testing Industry Segmentation By Geography
-
1. North America
- 1.1. United States
- 1.2. Canada
- 1.3. Mexico
-
2. Europe
- 2.1. Germany
- 2.2. United Kingdom
- 2.3. France
- 2.4. Italy
- 2.5. Spain
- 2.6. Rest of Europe
-
3. Asia Pacific
- 3.1. China
- 3.2. Japan
- 3.3. India
- 3.4. Australia
- 3.5. South Korea
- 3.6. Rest of Asia Pacific
-
4. Middle East and Africa
- 4.1. GCC
- 4.2. South Africa
- 4.3. Rest of Middle East and Africa
-
5. South America
- 5.1. Brazil
- 5.2. Argentina
- 5.3. Rest of South America
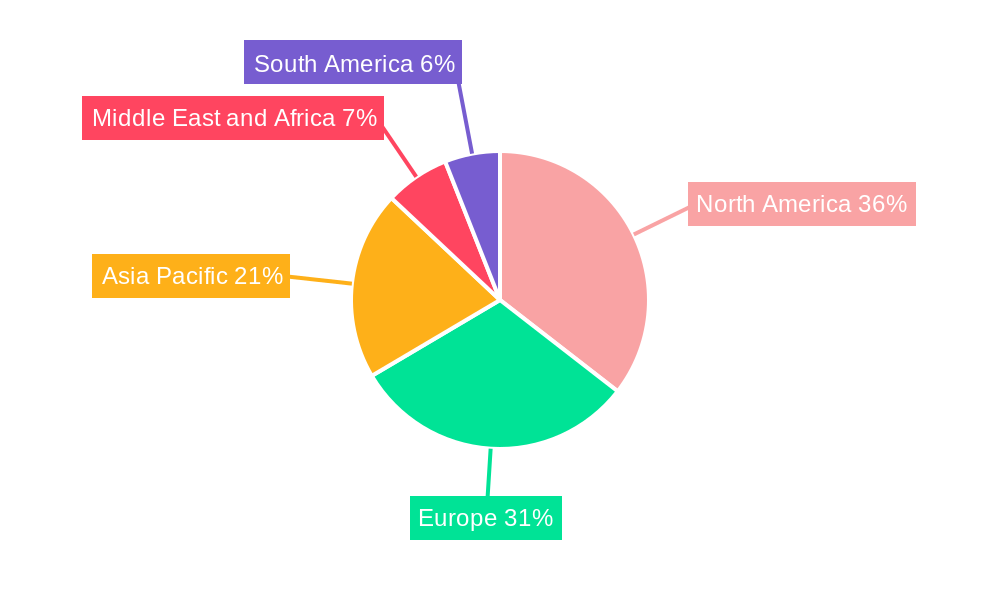
Pyrogen Testing Industry Regional Market Share
Geographic Coverage of Pyrogen Testing Industry
Pyrogen Testing Industry REPORT HIGHLIGHTS
| Aspects | Details |
|---|---|
| Study Period | 2020-2034 |
| Base Year | 2025 |
| Estimated Year | 2026 |
| Forecast Period | 2026-2034 |
| Historical Period | 2020-2025 |
| Growth Rate | CAGR of 7.13% from 2020-2034 |
| Segmentation |
|
Table of Contents
- 1. Introduction
- 1.1. Research Scope
- 1.2. Market Segmentation
- 1.3. Research Objective
- 1.4. Definitions and Assumptions
- 2. Executive Summary
- 2.1. Market Snapshot
- 3. Market Dynamics
- 3.1. Market Drivers
- 3.2. Market Restrains
- 3.3. Market Trends
- 3.4. Market Opportunities
- 4. Market Factor Analysis
- 4.1. Porters Five Forces
- 4.1.1. Bargaining Power of Suppliers
- 4.1.2. Bargaining Power of Buyers
- 4.1.3. Threat of New Entrants
- 4.1.4. Threat of Substitutes
- 4.1.5. Competitive Rivalry
- 4.2. PESTEL analysis
- 4.3. BCG Analysis
- 4.3.1. Stars (High Growth, High Market Share)
- 4.3.2. Cash Cows (Low Growth, High Market Share)
- 4.3.3. Question Mark (High Growth, Low Market Share)
- 4.3.4. Dogs (Low Growth, Low Market Share)
- 4.4. Ansoff Matrix Analysis
- 4.5. Supply Chain Analysis
- 4.6. Regulatory Landscape
- 4.7. Current Market Potential and Opportunity Assessment (TAM–SAM–SOM Framework)
- 4.8. IMR Analyst Note
- 4.1. Porters Five Forces
- 5. Market Analysis, Insights and Forecast 2021-2033
- 5.1. Market Analysis, Insights and Forecast - by Product
- 5.1.1. Kits and Reagents
- 5.1.2. Services
- 5.1.3. Instruments
- 5.2. Market Analysis, Insights and Forecast - by Test Type
- 5.2.1. LAL Tests
- 5.2.1.1. Chromogenic Tests
- 5.2.1.2. Turbidimetric Tests
- 5.2.1.3. Gel Clot Tests
- 5.2.2. Rabbit Pyrogen Test
- 5.2.3. Monocyte Activation Test
- 5.2.4. Other Test Types
- 5.2.1. LAL Tests
- 5.3. Market Analysis, Insights and Forecast - by End User
- 5.3.1. Pharmaceutical and Biotechnology Companies
- 5.3.2. Medical Device Companies
- 5.3.3. Other End Users
- 5.4. Market Analysis, Insights and Forecast - by Region
- 5.4.1. North America
- 5.4.2. Europe
- 5.4.3. Asia Pacific
- 5.4.4. Middle East and Africa
- 5.4.5. South America
- 5.1. Market Analysis, Insights and Forecast - by Product
- 6. Global Pyrogen Testing Industry Analysis, Insights and Forecast, 2021-2033
- 6.1. Market Analysis, Insights and Forecast - by Product
- 6.1.1. Kits and Reagents
- 6.1.2. Services
- 6.1.3. Instruments
- 6.2. Market Analysis, Insights and Forecast - by Test Type
- 6.2.1. LAL Tests
- 6.2.1.1. Chromogenic Tests
- 6.2.1.2. Turbidimetric Tests
- 6.2.1.3. Gel Clot Tests
- 6.2.2. Rabbit Pyrogen Test
- 6.2.3. Monocyte Activation Test
- 6.2.4. Other Test Types
- 6.2.1. LAL Tests
- 6.3. Market Analysis, Insights and Forecast - by End User
- 6.3.1. Pharmaceutical and Biotechnology Companies
- 6.3.2. Medical Device Companies
- 6.3.3. Other End Users
- 6.1. Market Analysis, Insights and Forecast - by Product
- 7. North America Pyrogen Testing Industry Analysis, Insights and Forecast, 2020-2032
- 7.1. Market Analysis, Insights and Forecast - by Product
- 7.1.1. Kits and Reagents
- 7.1.2. Services
- 7.1.3. Instruments
- 7.2. Market Analysis, Insights and Forecast - by Test Type
- 7.2.1. LAL Tests
- 7.2.1.1. Chromogenic Tests
- 7.2.1.2. Turbidimetric Tests
- 7.2.1.3. Gel Clot Tests
- 7.2.2. Rabbit Pyrogen Test
- 7.2.3. Monocyte Activation Test
- 7.2.4. Other Test Types
- 7.2.1. LAL Tests
- 7.3. Market Analysis, Insights and Forecast - by End User
- 7.3.1. Pharmaceutical and Biotechnology Companies
- 7.3.2. Medical Device Companies
- 7.3.3. Other End Users
- 7.1. Market Analysis, Insights and Forecast - by Product
- 8. Europe Pyrogen Testing Industry Analysis, Insights and Forecast, 2020-2032
- 8.1. Market Analysis, Insights and Forecast - by Product
- 8.1.1. Kits and Reagents
- 8.1.2. Services
- 8.1.3. Instruments
- 8.2. Market Analysis, Insights and Forecast - by Test Type
- 8.2.1. LAL Tests
- 8.2.1.1. Chromogenic Tests
- 8.2.1.2. Turbidimetric Tests
- 8.2.1.3. Gel Clot Tests
- 8.2.2. Rabbit Pyrogen Test
- 8.2.3. Monocyte Activation Test
- 8.2.4. Other Test Types
- 8.2.1. LAL Tests
- 8.3. Market Analysis, Insights and Forecast - by End User
- 8.3.1. Pharmaceutical and Biotechnology Companies
- 8.3.2. Medical Device Companies
- 8.3.3. Other End Users
- 8.1. Market Analysis, Insights and Forecast - by Product
- 9. Asia Pacific Pyrogen Testing Industry Analysis, Insights and Forecast, 2020-2032
- 9.1. Market Analysis, Insights and Forecast - by Product
- 9.1.1. Kits and Reagents
- 9.1.2. Services
- 9.1.3. Instruments
- 9.2. Market Analysis, Insights and Forecast - by Test Type
- 9.2.1. LAL Tests
- 9.2.1.1. Chromogenic Tests
- 9.2.1.2. Turbidimetric Tests
- 9.2.1.3. Gel Clot Tests
- 9.2.2. Rabbit Pyrogen Test
- 9.2.3. Monocyte Activation Test
- 9.2.4. Other Test Types
- 9.2.1. LAL Tests
- 9.3. Market Analysis, Insights and Forecast - by End User
- 9.3.1. Pharmaceutical and Biotechnology Companies
- 9.3.2. Medical Device Companies
- 9.3.3. Other End Users
- 9.1. Market Analysis, Insights and Forecast - by Product
- 10. Middle East and Africa Pyrogen Testing Industry Analysis, Insights and Forecast, 2020-2032
- 10.1. Market Analysis, Insights and Forecast - by Product
- 10.1.1. Kits and Reagents
- 10.1.2. Services
- 10.1.3. Instruments
- 10.2. Market Analysis, Insights and Forecast - by Test Type
- 10.2.1. LAL Tests
- 10.2.1.1. Chromogenic Tests
- 10.2.1.2. Turbidimetric Tests
- 10.2.1.3. Gel Clot Tests
- 10.2.2. Rabbit Pyrogen Test
- 10.2.3. Monocyte Activation Test
- 10.2.4. Other Test Types
- 10.2.1. LAL Tests
- 10.3. Market Analysis, Insights and Forecast - by End User
- 10.3.1. Pharmaceutical and Biotechnology Companies
- 10.3.2. Medical Device Companies
- 10.3.3. Other End Users
- 10.1. Market Analysis, Insights and Forecast - by Product
- 11. South America Pyrogen Testing Industry Analysis, Insights and Forecast, 2020-2032
- 11.1. Market Analysis, Insights and Forecast - by Product
- 11.1.1. Kits and Reagents
- 11.1.2. Services
- 11.1.3. Instruments
- 11.2. Market Analysis, Insights and Forecast - by Test Type
- 11.2.1. LAL Tests
- 11.2.1.1. Chromogenic Tests
- 11.2.1.2. Turbidimetric Tests
- 11.2.1.3. Gel Clot Tests
- 11.2.2. Rabbit Pyrogen Test
- 11.2.3. Monocyte Activation Test
- 11.2.4. Other Test Types
- 11.2.1. LAL Tests
- 11.3. Market Analysis, Insights and Forecast - by End User
- 11.3.1. Pharmaceutical and Biotechnology Companies
- 11.3.2. Medical Device Companies
- 11.3.3. Other End Users
- 11.1. Market Analysis, Insights and Forecast - by Product
- 12. Competitive Analysis
- 12.1. Company Profiles
- 12.1.1 Microcoat Biotechnologie GmbH
- 12.1.1.1. Company Overview
- 12.1.1.2. Products
- 12.1.1.3. Company Financials
- 12.1.1.4. SWOT Analysis
- 12.1.2 BioMerieux SA
- 12.1.2.1. Company Overview
- 12.1.2.2. Products
- 12.1.2.3. Company Financials
- 12.1.2.4. SWOT Analysis
- 12.1.3 Merck Kgaa
- 12.1.3.1. Company Overview
- 12.1.3.2. Products
- 12.1.3.3. Company Financials
- 12.1.3.4. SWOT Analysis
- 12.1.4 Lonza Group
- 12.1.4.1. Company Overview
- 12.1.4.2. Products
- 12.1.4.3. Company Financials
- 12.1.4.4. SWOT Analysis
- 12.1.5 Sotera Health (Nelson Laboratories LLC)
- 12.1.5.1. Company Overview
- 12.1.5.2. Products
- 12.1.5.3. Company Financials
- 12.1.5.4. SWOT Analysis
- 12.1.6 Fujifilm Holdings Corporation (FUJIFILM Wako Pure Chemical Corporation)
- 12.1.6.1. Company Overview
- 12.1.6.2. Products
- 12.1.6.3. Company Financials
- 12.1.6.4. SWOT Analysis
- 12.1.7 Eurofins Scientific
- 12.1.7.1. Company Overview
- 12.1.7.2. Products
- 12.1.7.3. Company Financials
- 12.1.7.4. SWOT Analysis
- 12.1.8 Thermo Fisher Scientific Inc
- 12.1.8.1. Company Overview
- 12.1.8.2. Products
- 12.1.8.3. Company Financials
- 12.1.8.4. SWOT Analysis
- 12.1.9 WUXI Pharmatech (Cayman) Inc
- 12.1.9.1. Company Overview
- 12.1.9.2. Products
- 12.1.9.3. Company Financials
- 12.1.9.4. SWOT Analysis
- 12.1.10 Genscript
- 12.1.10.1. Company Overview
- 12.1.10.2. Products
- 12.1.10.3. Company Financials
- 12.1.10.4. SWOT Analysis
- 12.1.11 Associates of Cape Cod Inc (Seikagaku Biobusiness Corporation)
- 12.1.11.1. Company Overview
- 12.1.11.2. Products
- 12.1.11.3. Company Financials
- 12.1.11.4. SWOT Analysis
- 12.1.12 Microcoat Biotechnologie GmbH
- 12.1.12.1. Company Overview
- 12.1.12.2. Products
- 12.1.12.3. Company Financials
- 12.1.12.4. SWOT Analysis
- 12.1.13 Charles River Laboratories Inc
- 12.1.13.1. Company Overview
- 12.1.13.2. Products
- 12.1.13.3. Company Financials
- 12.1.13.4. SWOT Analysis
- 12.1.14 Sanquin
- 12.1.14.1. Company Overview
- 12.1.14.2. Products
- 12.1.14.3. Company Financials
- 12.1.14.4. SWOT Analysis
- 12.1.15 Pyrostar
- 12.1.15.1. Company Overview
- 12.1.15.2. Products
- 12.1.15.3. Company Financials
- 12.1.15.4. SWOT Analysis
- 12.1.16 Ellab AS
- 12.1.16.1. Company Overview
- 12.1.16.2. Products
- 12.1.16.3. Company Financials
- 12.1.16.4. SWOT Analysis
- 12.1.1 Microcoat Biotechnologie GmbH
- 12.2. Market Entropy
- 12.2.1 Company's Key Areas Served
- 12.2.2 Recent Developments
- 12.3. Company Market Share Analysis 2025
- 12.3.1 Top 5 Companies Market Share Analysis
- 12.3.2 Top 3 Companies Market Share Analysis
- 12.4. List of Potential Customers
- 13. Research Methodology
List of Figures
- Figure 1: Global Pyrogen Testing Industry Revenue Breakdown (Million, %) by Region 2025 & 2033
- Figure 2: Global Pyrogen Testing Industry Volume Breakdown (K Unit, %) by Region 2025 & 2033
- Figure 3: North America Pyrogen Testing Industry Revenue (Million), by Product 2025 & 2033
- Figure 4: North America Pyrogen Testing Industry Volume (K Unit), by Product 2025 & 2033
- Figure 5: North America Pyrogen Testing Industry Revenue Share (%), by Product 2025 & 2033
- Figure 6: North America Pyrogen Testing Industry Volume Share (%), by Product 2025 & 2033
- Figure 7: North America Pyrogen Testing Industry Revenue (Million), by Test Type 2025 & 2033
- Figure 8: North America Pyrogen Testing Industry Volume (K Unit), by Test Type 2025 & 2033
- Figure 9: North America Pyrogen Testing Industry Revenue Share (%), by Test Type 2025 & 2033
- Figure 10: North America Pyrogen Testing Industry Volume Share (%), by Test Type 2025 & 2033
- Figure 11: North America Pyrogen Testing Industry Revenue (Million), by End User 2025 & 2033
- Figure 12: North America Pyrogen Testing Industry Volume (K Unit), by End User 2025 & 2033
- Figure 13: North America Pyrogen Testing Industry Revenue Share (%), by End User 2025 & 2033
- Figure 14: North America Pyrogen Testing Industry Volume Share (%), by End User 2025 & 2033
- Figure 15: North America Pyrogen Testing Industry Revenue (Million), by Country 2025 & 2033
- Figure 16: North America Pyrogen Testing Industry Volume (K Unit), by Country 2025 & 2033
- Figure 17: North America Pyrogen Testing Industry Revenue Share (%), by Country 2025 & 2033
- Figure 18: North America Pyrogen Testing Industry Volume Share (%), by Country 2025 & 2033
- Figure 19: Europe Pyrogen Testing Industry Revenue (Million), by Product 2025 & 2033
- Figure 20: Europe Pyrogen Testing Industry Volume (K Unit), by Product 2025 & 2033
- Figure 21: Europe Pyrogen Testing Industry Revenue Share (%), by Product 2025 & 2033
- Figure 22: Europe Pyrogen Testing Industry Volume Share (%), by Product 2025 & 2033
- Figure 23: Europe Pyrogen Testing Industry Revenue (Million), by Test Type 2025 & 2033
- Figure 24: Europe Pyrogen Testing Industry Volume (K Unit), by Test Type 2025 & 2033
- Figure 25: Europe Pyrogen Testing Industry Revenue Share (%), by Test Type 2025 & 2033
- Figure 26: Europe Pyrogen Testing Industry Volume Share (%), by Test Type 2025 & 2033
- Figure 27: Europe Pyrogen Testing Industry Revenue (Million), by End User 2025 & 2033
- Figure 28: Europe Pyrogen Testing Industry Volume (K Unit), by End User 2025 & 2033
- Figure 29: Europe Pyrogen Testing Industry Revenue Share (%), by End User 2025 & 2033
- Figure 30: Europe Pyrogen Testing Industry Volume Share (%), by End User 2025 & 2033
- Figure 31: Europe Pyrogen Testing Industry Revenue (Million), by Country 2025 & 2033
- Figure 32: Europe Pyrogen Testing Industry Volume (K Unit), by Country 2025 & 2033
- Figure 33: Europe Pyrogen Testing Industry Revenue Share (%), by Country 2025 & 2033
- Figure 34: Europe Pyrogen Testing Industry Volume Share (%), by Country 2025 & 2033
- Figure 35: Asia Pacific Pyrogen Testing Industry Revenue (Million), by Product 2025 & 2033
- Figure 36: Asia Pacific Pyrogen Testing Industry Volume (K Unit), by Product 2025 & 2033
- Figure 37: Asia Pacific Pyrogen Testing Industry Revenue Share (%), by Product 2025 & 2033
- Figure 38: Asia Pacific Pyrogen Testing Industry Volume Share (%), by Product 2025 & 2033
- Figure 39: Asia Pacific Pyrogen Testing Industry Revenue (Million), by Test Type 2025 & 2033
- Figure 40: Asia Pacific Pyrogen Testing Industry Volume (K Unit), by Test Type 2025 & 2033
- Figure 41: Asia Pacific Pyrogen Testing Industry Revenue Share (%), by Test Type 2025 & 2033
- Figure 42: Asia Pacific Pyrogen Testing Industry Volume Share (%), by Test Type 2025 & 2033
- Figure 43: Asia Pacific Pyrogen Testing Industry Revenue (Million), by End User 2025 & 2033
- Figure 44: Asia Pacific Pyrogen Testing Industry Volume (K Unit), by End User 2025 & 2033
- Figure 45: Asia Pacific Pyrogen Testing Industry Revenue Share (%), by End User 2025 & 2033
- Figure 46: Asia Pacific Pyrogen Testing Industry Volume Share (%), by End User 2025 & 2033
- Figure 47: Asia Pacific Pyrogen Testing Industry Revenue (Million), by Country 2025 & 2033
- Figure 48: Asia Pacific Pyrogen Testing Industry Volume (K Unit), by Country 2025 & 2033
- Figure 49: Asia Pacific Pyrogen Testing Industry Revenue Share (%), by Country 2025 & 2033
- Figure 50: Asia Pacific Pyrogen Testing Industry Volume Share (%), by Country 2025 & 2033
- Figure 51: Middle East and Africa Pyrogen Testing Industry Revenue (Million), by Product 2025 & 2033
- Figure 52: Middle East and Africa Pyrogen Testing Industry Volume (K Unit), by Product 2025 & 2033
- Figure 53: Middle East and Africa Pyrogen Testing Industry Revenue Share (%), by Product 2025 & 2033
- Figure 54: Middle East and Africa Pyrogen Testing Industry Volume Share (%), by Product 2025 & 2033
- Figure 55: Middle East and Africa Pyrogen Testing Industry Revenue (Million), by Test Type 2025 & 2033
- Figure 56: Middle East and Africa Pyrogen Testing Industry Volume (K Unit), by Test Type 2025 & 2033
- Figure 57: Middle East and Africa Pyrogen Testing Industry Revenue Share (%), by Test Type 2025 & 2033
- Figure 58: Middle East and Africa Pyrogen Testing Industry Volume Share (%), by Test Type 2025 & 2033
- Figure 59: Middle East and Africa Pyrogen Testing Industry Revenue (Million), by End User 2025 & 2033
- Figure 60: Middle East and Africa Pyrogen Testing Industry Volume (K Unit), by End User 2025 & 2033
- Figure 61: Middle East and Africa Pyrogen Testing Industry Revenue Share (%), by End User 2025 & 2033
- Figure 62: Middle East and Africa Pyrogen Testing Industry Volume Share (%), by End User 2025 & 2033
- Figure 63: Middle East and Africa Pyrogen Testing Industry Revenue (Million), by Country 2025 & 2033
- Figure 64: Middle East and Africa Pyrogen Testing Industry Volume (K Unit), by Country 2025 & 2033
- Figure 65: Middle East and Africa Pyrogen Testing Industry Revenue Share (%), by Country 2025 & 2033
- Figure 66: Middle East and Africa Pyrogen Testing Industry Volume Share (%), by Country 2025 & 2033
- Figure 67: South America Pyrogen Testing Industry Revenue (Million), by Product 2025 & 2033
- Figure 68: South America Pyrogen Testing Industry Volume (K Unit), by Product 2025 & 2033
- Figure 69: South America Pyrogen Testing Industry Revenue Share (%), by Product 2025 & 2033
- Figure 70: South America Pyrogen Testing Industry Volume Share (%), by Product 2025 & 2033
- Figure 71: South America Pyrogen Testing Industry Revenue (Million), by Test Type 2025 & 2033
- Figure 72: South America Pyrogen Testing Industry Volume (K Unit), by Test Type 2025 & 2033
- Figure 73: South America Pyrogen Testing Industry Revenue Share (%), by Test Type 2025 & 2033
- Figure 74: South America Pyrogen Testing Industry Volume Share (%), by Test Type 2025 & 2033
- Figure 75: South America Pyrogen Testing Industry Revenue (Million), by End User 2025 & 2033
- Figure 76: South America Pyrogen Testing Industry Volume (K Unit), by End User 2025 & 2033
- Figure 77: South America Pyrogen Testing Industry Revenue Share (%), by End User 2025 & 2033
- Figure 78: South America Pyrogen Testing Industry Volume Share (%), by End User 2025 & 2033
- Figure 79: South America Pyrogen Testing Industry Revenue (Million), by Country 2025 & 2033
- Figure 80: South America Pyrogen Testing Industry Volume (K Unit), by Country 2025 & 2033
- Figure 81: South America Pyrogen Testing Industry Revenue Share (%), by Country 2025 & 2033
- Figure 82: South America Pyrogen Testing Industry Volume Share (%), by Country 2025 & 2033
List of Tables
- Table 1: Global Pyrogen Testing Industry Revenue Million Forecast, by Product 2020 & 2033
- Table 2: Global Pyrogen Testing Industry Volume K Unit Forecast, by Product 2020 & 2033
- Table 3: Global Pyrogen Testing Industry Revenue Million Forecast, by Test Type 2020 & 2033
- Table 4: Global Pyrogen Testing Industry Volume K Unit Forecast, by Test Type 2020 & 2033
- Table 5: Global Pyrogen Testing Industry Revenue Million Forecast, by End User 2020 & 2033
- Table 6: Global Pyrogen Testing Industry Volume K Unit Forecast, by End User 2020 & 2033
- Table 7: Global Pyrogen Testing Industry Revenue Million Forecast, by Region 2020 & 2033
- Table 8: Global Pyrogen Testing Industry Volume K Unit Forecast, by Region 2020 & 2033
- Table 9: Global Pyrogen Testing Industry Revenue Million Forecast, by Product 2020 & 2033
- Table 10: Global Pyrogen Testing Industry Volume K Unit Forecast, by Product 2020 & 2033
- Table 11: Global Pyrogen Testing Industry Revenue Million Forecast, by Test Type 2020 & 2033
- Table 12: Global Pyrogen Testing Industry Volume K Unit Forecast, by Test Type 2020 & 2033
- Table 13: Global Pyrogen Testing Industry Revenue Million Forecast, by End User 2020 & 2033
- Table 14: Global Pyrogen Testing Industry Volume K Unit Forecast, by End User 2020 & 2033
- Table 15: Global Pyrogen Testing Industry Revenue Million Forecast, by Country 2020 & 2033
- Table 16: Global Pyrogen Testing Industry Volume K Unit Forecast, by Country 2020 & 2033
- Table 17: United States Pyrogen Testing Industry Revenue (Million) Forecast, by Application 2020 & 2033
- Table 18: United States Pyrogen Testing Industry Volume (K Unit) Forecast, by Application 2020 & 2033
- Table 19: Canada Pyrogen Testing Industry Revenue (Million) Forecast, by Application 2020 & 2033
- Table 20: Canada Pyrogen Testing Industry Volume (K Unit) Forecast, by Application 2020 & 2033
- Table 21: Mexico Pyrogen Testing Industry Revenue (Million) Forecast, by Application 2020 & 2033
- Table 22: Mexico Pyrogen Testing Industry Volume (K Unit) Forecast, by Application 2020 & 2033
- Table 23: Global Pyrogen Testing Industry Revenue Million Forecast, by Product 2020 & 2033
- Table 24: Global Pyrogen Testing Industry Volume K Unit Forecast, by Product 2020 & 2033
- Table 25: Global Pyrogen Testing Industry Revenue Million Forecast, by Test Type 2020 & 2033
- Table 26: Global Pyrogen Testing Industry Volume K Unit Forecast, by Test Type 2020 & 2033
- Table 27: Global Pyrogen Testing Industry Revenue Million Forecast, by End User 2020 & 2033
- Table 28: Global Pyrogen Testing Industry Volume K Unit Forecast, by End User 2020 & 2033
- Table 29: Global Pyrogen Testing Industry Revenue Million Forecast, by Country 2020 & 2033
- Table 30: Global Pyrogen Testing Industry Volume K Unit Forecast, by Country 2020 & 2033
- Table 31: Germany Pyrogen Testing Industry Revenue (Million) Forecast, by Application 2020 & 2033
- Table 32: Germany Pyrogen Testing Industry Volume (K Unit) Forecast, by Application 2020 & 2033
- Table 33: United Kingdom Pyrogen Testing Industry Revenue (Million) Forecast, by Application 2020 & 2033
- Table 34: United Kingdom Pyrogen Testing Industry Volume (K Unit) Forecast, by Application 2020 & 2033
- Table 35: France Pyrogen Testing Industry Revenue (Million) Forecast, by Application 2020 & 2033
- Table 36: France Pyrogen Testing Industry Volume (K Unit) Forecast, by Application 2020 & 2033
- Table 37: Italy Pyrogen Testing Industry Revenue (Million) Forecast, by Application 2020 & 2033
- Table 38: Italy Pyrogen Testing Industry Volume (K Unit) Forecast, by Application 2020 & 2033
- Table 39: Spain Pyrogen Testing Industry Revenue (Million) Forecast, by Application 2020 & 2033
- Table 40: Spain Pyrogen Testing Industry Volume (K Unit) Forecast, by Application 2020 & 2033
- Table 41: Rest of Europe Pyrogen Testing Industry Revenue (Million) Forecast, by Application 2020 & 2033
- Table 42: Rest of Europe Pyrogen Testing Industry Volume (K Unit) Forecast, by Application 2020 & 2033
- Table 43: Global Pyrogen Testing Industry Revenue Million Forecast, by Product 2020 & 2033
- Table 44: Global Pyrogen Testing Industry Volume K Unit Forecast, by Product 2020 & 2033
- Table 45: Global Pyrogen Testing Industry Revenue Million Forecast, by Test Type 2020 & 2033
- Table 46: Global Pyrogen Testing Industry Volume K Unit Forecast, by Test Type 2020 & 2033
- Table 47: Global Pyrogen Testing Industry Revenue Million Forecast, by End User 2020 & 2033
- Table 48: Global Pyrogen Testing Industry Volume K Unit Forecast, by End User 2020 & 2033
- Table 49: Global Pyrogen Testing Industry Revenue Million Forecast, by Country 2020 & 2033
- Table 50: Global Pyrogen Testing Industry Volume K Unit Forecast, by Country 2020 & 2033
- Table 51: China Pyrogen Testing Industry Revenue (Million) Forecast, by Application 2020 & 2033
- Table 52: China Pyrogen Testing Industry Volume (K Unit) Forecast, by Application 2020 & 2033
- Table 53: Japan Pyrogen Testing Industry Revenue (Million) Forecast, by Application 2020 & 2033
- Table 54: Japan Pyrogen Testing Industry Volume (K Unit) Forecast, by Application 2020 & 2033
- Table 55: India Pyrogen Testing Industry Revenue (Million) Forecast, by Application 2020 & 2033
- Table 56: India Pyrogen Testing Industry Volume (K Unit) Forecast, by Application 2020 & 2033
- Table 57: Australia Pyrogen Testing Industry Revenue (Million) Forecast, by Application 2020 & 2033
- Table 58: Australia Pyrogen Testing Industry Volume (K Unit) Forecast, by Application 2020 & 2033
- Table 59: South Korea Pyrogen Testing Industry Revenue (Million) Forecast, by Application 2020 & 2033
- Table 60: South Korea Pyrogen Testing Industry Volume (K Unit) Forecast, by Application 2020 & 2033
- Table 61: Rest of Asia Pacific Pyrogen Testing Industry Revenue (Million) Forecast, by Application 2020 & 2033
- Table 62: Rest of Asia Pacific Pyrogen Testing Industry Volume (K Unit) Forecast, by Application 2020 & 2033
- Table 63: Global Pyrogen Testing Industry Revenue Million Forecast, by Product 2020 & 2033
- Table 64: Global Pyrogen Testing Industry Volume K Unit Forecast, by Product 2020 & 2033
- Table 65: Global Pyrogen Testing Industry Revenue Million Forecast, by Test Type 2020 & 2033
- Table 66: Global Pyrogen Testing Industry Volume K Unit Forecast, by Test Type 2020 & 2033
- Table 67: Global Pyrogen Testing Industry Revenue Million Forecast, by End User 2020 & 2033
- Table 68: Global Pyrogen Testing Industry Volume K Unit Forecast, by End User 2020 & 2033
- Table 69: Global Pyrogen Testing Industry Revenue Million Forecast, by Country 2020 & 2033
- Table 70: Global Pyrogen Testing Industry Volume K Unit Forecast, by Country 2020 & 2033
- Table 71: GCC Pyrogen Testing Industry Revenue (Million) Forecast, by Application 2020 & 2033
- Table 72: GCC Pyrogen Testing Industry Volume (K Unit) Forecast, by Application 2020 & 2033
- Table 73: South Africa Pyrogen Testing Industry Revenue (Million) Forecast, by Application 2020 & 2033
- Table 74: South Africa Pyrogen Testing Industry Volume (K Unit) Forecast, by Application 2020 & 2033
- Table 75: Rest of Middle East and Africa Pyrogen Testing Industry Revenue (Million) Forecast, by Application 2020 & 2033
- Table 76: Rest of Middle East and Africa Pyrogen Testing Industry Volume (K Unit) Forecast, by Application 2020 & 2033
- Table 77: Global Pyrogen Testing Industry Revenue Million Forecast, by Product 2020 & 2033
- Table 78: Global Pyrogen Testing Industry Volume K Unit Forecast, by Product 2020 & 2033
- Table 79: Global Pyrogen Testing Industry Revenue Million Forecast, by Test Type 2020 & 2033
- Table 80: Global Pyrogen Testing Industry Volume K Unit Forecast, by Test Type 2020 & 2033
- Table 81: Global Pyrogen Testing Industry Revenue Million Forecast, by End User 2020 & 2033
- Table 82: Global Pyrogen Testing Industry Volume K Unit Forecast, by End User 2020 & 2033
- Table 83: Global Pyrogen Testing Industry Revenue Million Forecast, by Country 2020 & 2033
- Table 84: Global Pyrogen Testing Industry Volume K Unit Forecast, by Country 2020 & 2033
- Table 85: Brazil Pyrogen Testing Industry Revenue (Million) Forecast, by Application 2020 & 2033
- Table 86: Brazil Pyrogen Testing Industry Volume (K Unit) Forecast, by Application 2020 & 2033
- Table 87: Argentina Pyrogen Testing Industry Revenue (Million) Forecast, by Application 2020 & 2033
- Table 88: Argentina Pyrogen Testing Industry Volume (K Unit) Forecast, by Application 2020 & 2033
- Table 89: Rest of South America Pyrogen Testing Industry Revenue (Million) Forecast, by Application 2020 & 2033
- Table 90: Rest of South America Pyrogen Testing Industry Volume (K Unit) Forecast, by Application 2020 & 2033
Frequently Asked Questions
1. What is the projected Compound Annual Growth Rate (CAGR) of the Pyrogen Testing Industry?
The projected CAGR is approximately 7.13%.
2. Which companies are prominent players in the Pyrogen Testing Industry?
Key companies in the market include Microcoat Biotechnologie GmbH, BioMerieux SA, Merck Kgaa, Lonza Group, Sotera Health (Nelson Laboratories LLC), Fujifilm Holdings Corporation (FUJIFILM Wako Pure Chemical Corporation), Eurofins Scientific, Thermo Fisher Scientific Inc, WUXI Pharmatech (Cayman) Inc, Genscript, Associates of Cape Cod Inc (Seikagaku Biobusiness Corporation), Microcoat Biotechnologie GmbH, Charles River Laboratories Inc, Sanquin, Pyrostar, Ellab AS.
3. What are the main segments of the Pyrogen Testing Industry?
The market segments include Product, Test Type, End User.
4. Can you provide details about the market size?
The market size is estimated to be USD 1.48 Million as of 2022.
5. What are some drivers contributing to market growth?
Rapid Growth in Pharmaceutical and Biotechnology Industries; Rising R&D Expenditure in Life Science.
6. What are the notable trends driving market growth?
The Monocyte Activation Test Segment is Expected to Witness Good Growth Over the Forecast Period.
7. Are there any restraints impacting market growth?
Stringent Government Regulations.
8. Can you provide examples of recent developments in the market?
N/A
9. What pricing options are available for accessing the report?
Pricing options include single-user, multi-user, and enterprise licenses priced at USD 4750, USD 5250, and USD 8750 respectively.
10. Is the market size provided in terms of value or volume?
The market size is provided in terms of value, measured in Million and volume, measured in K Unit.
11. Are there any specific market keywords associated with the report?
Yes, the market keyword associated with the report is "Pyrogen Testing Industry," which aids in identifying and referencing the specific market segment covered.
12. How do I determine which pricing option suits my needs best?
The pricing options vary based on user requirements and access needs. Individual users may opt for single-user licenses, while businesses requiring broader access may choose multi-user or enterprise licenses for cost-effective access to the report.
13. Are there any additional resources or data provided in the Pyrogen Testing Industry report?
While the report offers comprehensive insights, it's advisable to review the specific contents or supplementary materials provided to ascertain if additional resources or data are available.
14. How can I stay updated on further developments or reports in the Pyrogen Testing Industry?
To stay informed about further developments, trends, and reports in the Pyrogen Testing Industry, consider subscribing to industry newsletters, following relevant companies and organizations, or regularly checking reputable industry news sources and publications.
Methodology
Step 1 - Identification of Relevant Samples Size from Population Database


Step 2 - Approaches for Defining Global Market Size (Value, Volume* & Price*)

Note*: In applicable scenarios
Step 3 - Data Sources
Primary Research
- Web Analytics
- Survey Reports
- Research Institute
- Latest Research Reports
- Opinion Leaders
Secondary Research
- Annual Reports
- White Paper
- Latest Press Release
- Industry Association
- Paid Database
- Investor Presentations

Step 4 - Data Triangulation
Involves using different sources of information in order to increase the validity of a study
These sources are likely to be stakeholders in a program - participants, other researchers, program staff, other community members, and so on.
Then we put all data in single framework & apply various statistical tools to find out the dynamic on the market.
During the analysis stage, feedback from the stakeholder groups would be compared to determine areas of agreement as well as areas of divergence