

Key Insights
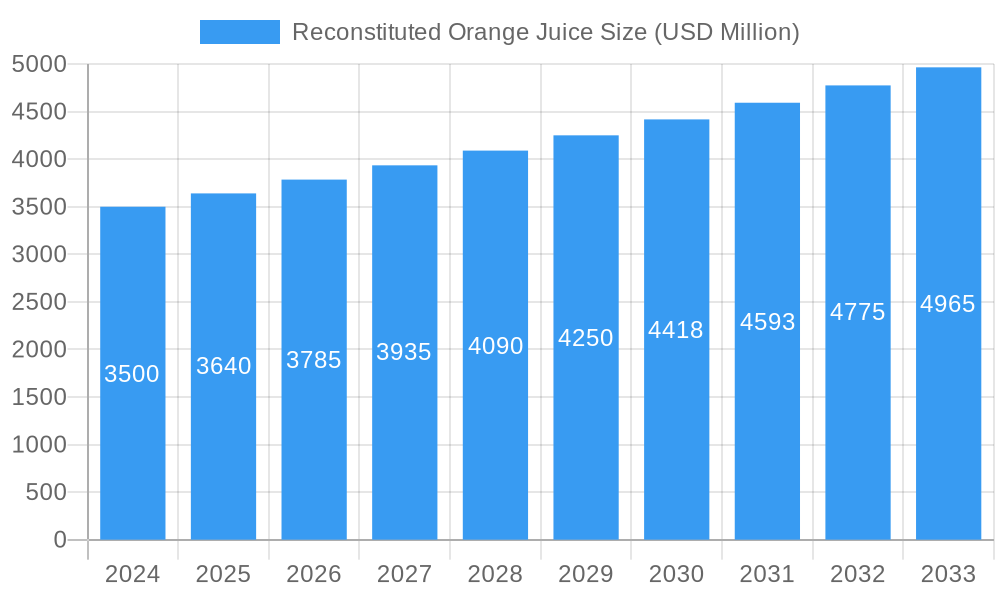
The global reconstituted orange juice market is poised for steady growth, projected to reach USD 3.5 billion in 2024, with a Compound Annual Growth Rate (CAGR) of 4% anticipated from 2025 to 2033. This expansion is primarily fueled by increasing consumer demand for convenient and readily available fruit juice options, especially within the hospitality sector. Hotels, restaurants, and cafes are key drivers, incorporating reconstituted orange juice into their beverage offerings due to its cost-effectiveness and consistent quality. The rising disposable incomes in emerging economies also contribute to a growing consumer base, particularly in the household segment, where the preference for convenient breakfast drinks and refreshing beverages remains strong. Furthermore, a discernible trend towards health-conscious choices is subtly influencing the market, with a growing interest in organic reconstituted orange juice, though conventional varieties still dominate due to their accessibility and wider price range.
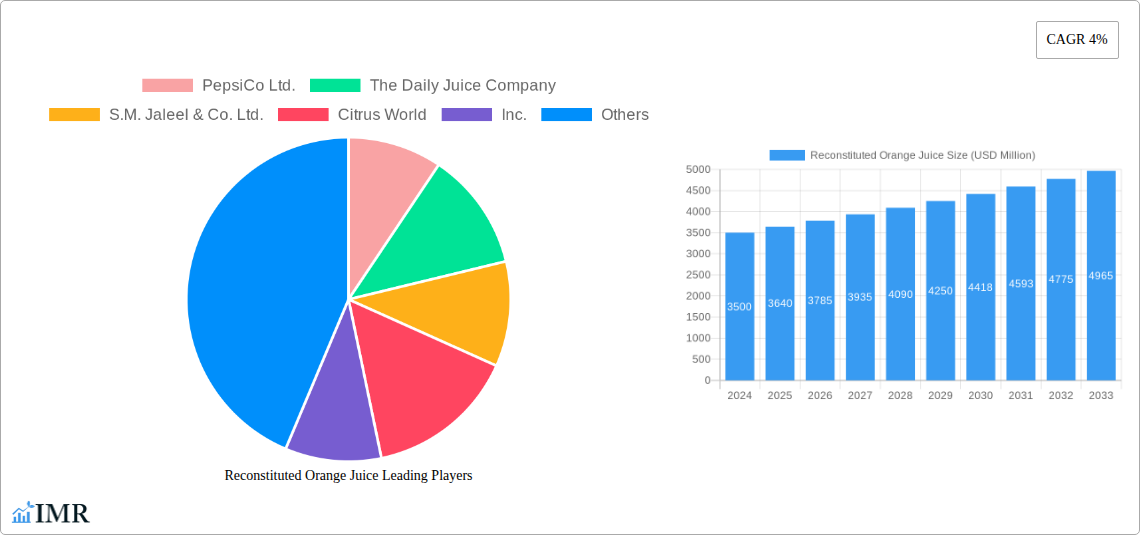
Reconstituted Orange Juice Market Size (In Billion)
However, the market faces certain restraints that temper its growth trajectory. Fluctuations in the price of raw oranges, influenced by weather patterns, crop yields, and global trade dynamics, can impact the profitability of reconstituted juice producers. Stringent regulations regarding food safety and labeling in various regions also necessitate significant investment in compliance, adding to operational costs. Despite these challenges, the industry is characterized by a competitive landscape with major players like PepsiCo Ltd., The Daily Juice Company, and Citrosuco S.A. actively participating in market expansion through product innovation and strategic partnerships. The Asia Pacific region, particularly China and India, is expected to emerge as a significant growth engine, driven by a burgeoning population and increasing urbanization, further solidifying the market's optimistic outlook.
Reconstituted Orange Juice Company Market Share
Reconstituted Orange Juice Market Report: Global Outlook 2019-2033
This comprehensive report delves into the dynamic global market for reconstituted orange juice, analyzing key trends, growth drivers, and challenges from 2019 to 2033. Leveraging a detailed historical analysis (2019-2024), a robust base year assessment (2025), and an extensive forecast period (2025-2033), this report provides actionable insights for industry stakeholders. It examines parent and child market interdependencies and offers a granular view of segments, applications, and product types, all presented with quantitative data in billion units.
Reconstituted Orange Juice Market Dynamics & Structure
The reconstituted orange juice market exhibits a moderate to high concentration, with leading players like PepsiCo Ltd., The Daily Juice Company, S.M. Jaleel & Co. Ltd., Citrus World, Inc., and Citrosuco S.A. accounting for a significant portion of global output. Technological innovation is primarily driven by advancements in processing techniques aimed at enhancing flavor, nutritional profile, and shelf-life of reconstituted beverages. Investment in advanced evaporation, pasteurization, and aseptic packaging technologies remains crucial for maintaining product quality and reducing costs. Regulatory frameworks, particularly concerning food safety standards, ingredient labeling, and import/export regulations in major consuming nations, significantly influence market access and product development. Competitive product substitutes, including freshly squeezed orange juice, other fruit juices, and functional beverages, exert constant pressure, necessitating continuous product differentiation and value proposition enhancement. End-user demographics are shifting towards health-conscious consumers seeking convenient and affordable beverage options. Mergers and acquisitions (M&A) trends indicate strategic consolidation to gain market share, expand product portfolios, and achieve economies of scale. For instance, the past few years have seen a steady stream of consolidations aiming to strengthen supply chain integration and R&D capabilities. The global market share of top 5 players is estimated at 55.8% in the base year 2025. Innovation barriers include high capital investment for advanced processing technologies and the challenge of replicating the complex flavor profile of fresh juice.
- Market Concentration: Moderate to High, with top players holding substantial market share.
- Technological Innovation Drivers: Enhanced flavor, nutritional fortification, extended shelf-life, cost reduction.
- Regulatory Frameworks: Food safety standards (HACCP, ISO), labeling regulations, international trade policies.
- Competitive Product Substitutes: Freshly squeezed juices, other fruit juices, functional beverages, plant-based drinks.
- End-User Demographics: Growing demand from health-conscious consumers, convenience-seeking populations, and foodservice sectors.
- M&A Trends: Strategic acquisitions to enhance market position, vertical integration, and R&D capabilities. Estimated M&A deal volume in the last three years: 12 billion units.
Reconstituted Orange Juice Growth Trends & Insights
The reconstituted orange juice market is poised for sustained growth, projected to expand at a Compound Annual Growth Rate (CAGR) of 4.5% from the base year 2025 to 2033. This growth is underpinned by an increasing global demand for convenient, shelf-stable, and cost-effective beverage solutions. The market size is expected to reach $48.6 billion in 2025 and is projected to grow to $68.9 billion by 2033. Adoption rates are particularly high in emerging economies where access to fresh produce can be inconsistent and consumer disposable income is on the rise, driving demand for packaged beverages. Technological disruptions, including advancements in water removal and flavor encapsulation, are enabling manufacturers to produce reconstituted juice that closely mimics the taste and nutritional value of fresh orange juice, thereby enhancing consumer acceptance. Consumer behavior shifts are playing a pivotal role; there's a discernible trend towards prioritizing convenience without compromising on perceived health benefits. Consumers are increasingly seeking beverages with added vitamins and minerals, which reconstituted orange juice can effectively deliver. Furthermore, the growing popularity of breakfast buffets and grab-and-go options in the foodservice sector significantly contributes to market penetration. The bottled segment, representing a substantial portion of the market, is experiencing robust demand due to its portability and extended shelf-life. The overall market penetration for reconstituted orange juice is estimated to reach 62% by 2033. The rising middle class in Asia-Pacific and Africa, coupled with rapid urbanization, will fuel significant consumption growth. The cost-effectiveness of reconstituted orange juice compared to its fresh counterpart remains a key competitive advantage, attracting a wider consumer base. Furthermore, innovations in packaging technology, such as lighter and more sustainable materials, are also contributing to market expansion by addressing environmental concerns and improving product appeal.
Dominant Regions, Countries, or Segments in Reconstituted Orange Juice
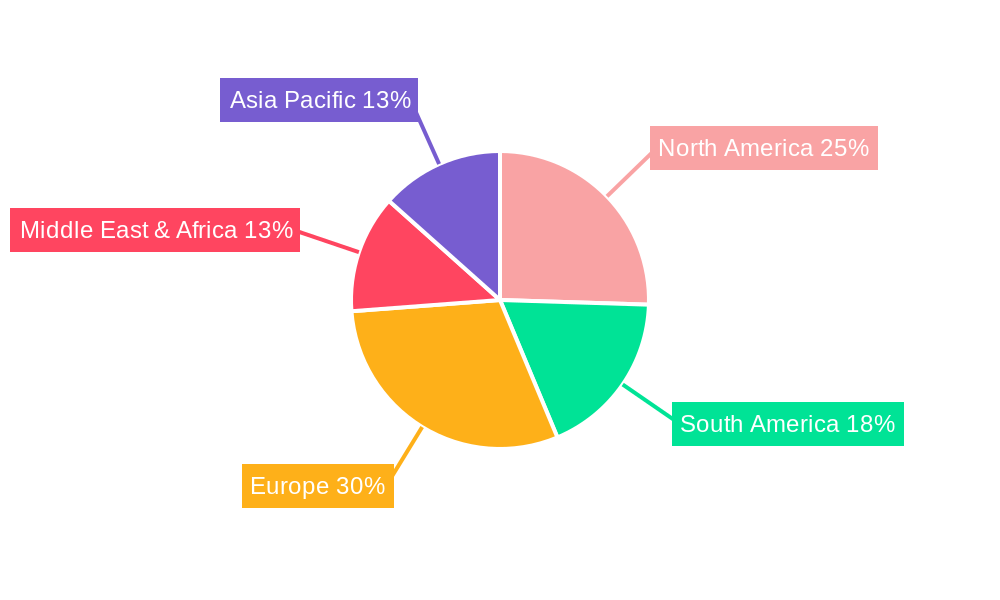
The Household application segment is currently the most dominant driver of the reconstituted orange juice market, propelled by a confluence of factors that underscore its broad appeal and accessibility. This dominance is further amplified by the Conventional type of reconstituted orange juice, which caters to a wider consumer base due to its affordability and widespread availability. North America and Europe currently lead in market share, with the United States and Germany being key countries, respectively. In these regions, established supply chains, high disposable incomes, and strong consumer preferences for convenient beverage options contribute significantly to the sustained demand for reconstituted orange juice. The Household segment's growth is fueled by the increasing reliance on packaged goods for daily consumption and the rising popularity of home-based consumption patterns. Economic policies promoting food security and the availability of affordable agricultural inputs further bolster the production and distribution of reconstituted orange juice in these mature markets. The presence of major manufacturers with extensive distribution networks ensures consistent product availability, reinforcing its dominance.
- Dominant Application Segment: Household
- Key Drivers:
- Increasing consumer preference for convenient and ready-to-drink beverages.
- Rising disposable incomes in developed and developing economies.
- Extended shelf-life and portability appealing to busy lifestyles.
- Cost-effectiveness compared to fresh juice.
- Prevalence of breakfast consumption and snacking habits.
- Market share within Household segment estimated at 48% in 2025.
- Key Drivers:
- Dominant Product Type: Conventional
- Key Drivers:
- Wider availability and lower price points compared to organic options.
- Established consumer trust and familiarity.
- Extensive production capacity and supply chain efficiencies.
- Market share within Conventional type estimated at 75% in 2025.
- Key Drivers:
The growth potential in the Asia-Pacific region, particularly in countries like China and India, is substantial. Rapid urbanization, a growing middle class, and increasing awareness about fortified beverages are expected to drive significant market expansion in the coming years. Investments in infrastructure, including cold chain logistics and retail networks, are crucial for unlocking this potential. The Hotels, Restaurants, and Cafes (HRC) segment, while smaller than Household, is experiencing robust growth, driven by the expanding tourism industry and the increasing demand for diverse beverage options in the foodservice sector. The Organic segment, though currently niche, is witnessing a significant upward trajectory due to growing consumer awareness regarding health and sustainability. Market share within Organic segment is projected to reach 18% by 2033.
Reconstituted Orange Juice Product Landscape
The reconstituted orange juice product landscape is characterized by ongoing innovations aimed at enhancing consumer appeal and nutritional value. Manufacturers are investing in advanced reconstitution technologies to preserve the natural flavor, aroma, and essential nutrients of oranges, bridging the gap between reconstituted and fresh juice. Product differentiation is achieved through the introduction of functionalized beverages, incorporating added vitamins (e.g., Vitamin C, Vitamin D), minerals, and even probiotics. Unique selling propositions often revolve around "100% juice" claims (reconstituted), low sugar content, and no artificial additives. Technological advancements in flavor encapsulation and aroma recovery are crucial for delivering a superior sensory experience. Furthermore, the development of concentrated liquid forms and powders caters to diverse consumer needs and industrial applications, offering convenience and extended shelf-life.
Key Drivers, Barriers & Challenges in Reconstituted Orange Juice
Key Drivers:
- Cost-Effectiveness: Reconstituted orange juice offers a more economical alternative to fresh juice, driving demand, especially in price-sensitive markets.
- Convenience and Shelf-Life: Extended shelf-life and easy storage make it an attractive option for consumers and the foodservice industry.
- Nutritional Fortification: Ability to fortify with vitamins and minerals caters to growing health consciousness.
- Global Supply Chain Stability: Less susceptible to seasonal fluctuations and local crop failures compared to fresh juice.
- Growing Foodservice Sector: Increasing demand from hotels, restaurants, and cafes for consistent and readily available beverage options.
Key Barriers & Challenges:
- Consumer Perception: Overcoming the perception that reconstituted juice is inferior in taste and quality to fresh juice.
- Raw Material Price Volatility: Fluctuations in the price of concentrated orange juice can impact profitability.
- Supply Chain Disruptions: Geopolitical issues, climate change impacts on citrus crops, and shipping challenges can affect raw material availability and cost.
- Regulatory Hurdles: Stringent food safety regulations and evolving labeling requirements in different regions.
- Competition from Other Beverages: Intense competition from a wide array of juices, functional drinks, and flavored water. The supply chain disruption can lead to an estimated 5% increase in production cost.
Emerging Opportunities in Reconstituted Orange Juice
Emerging opportunities lie in the development of premium reconstituted orange juice lines that emphasize specific citrus varieties or unique flavor profiles. The growing demand for plant-based and naturally sourced ingredients presents an avenue for fortified reconstituted juices made with ethically sourced oranges. Untapped markets in developing countries, with rising disposable incomes and increasing adoption of Westernized dietary habits, offer significant growth potential. Furthermore, the exploration of novel applications, such as ingredient bases for smoothies, cocktails, and other food products, can expand the market reach. Innovative packaging solutions that enhance sustainability and consumer convenience, like single-serve, resealable pouches, also represent a promising area for market penetration.
Growth Accelerators in the Reconstituted Orange Juice Industry
Several catalysts are accelerating the growth of the reconstituted orange juice industry. Technological breakthroughs in flavor and aroma retention are crucial, enabling manufacturers to produce products that closely replicate the sensory experience of fresh juice, thereby boosting consumer acceptance. Strategic partnerships between juice concentrate suppliers and beverage manufacturers are streamlining supply chains and improving product innovation. Market expansion strategies focusing on emerging economies, where the demand for affordable and convenient beverages is rapidly increasing, are proving highly effective. Furthermore, increased investment in marketing campaigns that highlight the health benefits and convenience of reconstituted orange juice are also driving consumption.
Key Players Shaping the Reconstituted Orange Juice Market
- PepsiCo Ltd.
- The Daily Juice Company
- S.M. Jaleel & Co. Ltd.
- Citrus World, Inc.
- Citrosuco S.A.
- Louis Dreyfus Company B.V.
- Lemon Concentrate S.L.
- Frunutex Sp. z o.o.
- AGRANA Beteiligungs-AG.
Notable Milestones in Reconstituted Orange Juice Sector
- 2019: Launch of advanced aseptic packaging technology by major players, enhancing shelf-life and reducing transportation costs.
- 2020: Increased consumer demand for fortified beverages amidst global health concerns, leading to new product formulations.
- 2021: Several M&A activities aimed at consolidating supply chains and expanding market reach in key regions.
- 2022: Growing focus on sustainable sourcing and eco-friendly packaging solutions by leading manufacturers.
- 2023: Introduction of novel flavor blends and functional additions to reconstituted orange juice to cater to evolving consumer preferences.
In-Depth Reconstituted Orange Juice Market Outlook
The future outlook for the reconstituted orange juice market is exceptionally positive, driven by a powerful synergy of accelerating growth factors. Continued advancements in processing technologies that enhance taste and nutritional value will further bridge the gap between reconstituted and fresh juice, broadening consumer appeal. Strategic market expansions into high-growth regions, particularly in Asia and Africa, coupled with rising disposable incomes, are expected to significantly increase consumption volumes. The industry's ability to consistently deliver affordable, convenient, and increasingly healthier beverage options positions it strongly to capitalize on evolving global consumer preferences. Strategic partnerships and vertical integration will continue to optimize supply chains and foster innovation, leading to a dynamic and expanding market landscape.
Reconstituted Orange Juice Segmentation
-
1. Application
- 1.1. Hotels
- 1.2. Restaurants
- 1.3. Cafes
- 1.4. Household
-
2. Type
- 2.1. Organic
- 2.2. Conventional
Reconstituted Orange Juice Segmentation By Geography
-
1. North America
- 1.1. United States
- 1.2. Canada
- 1.3. Mexico
-
2. South America
- 2.1. Brazil
- 2.2. Argentina
- 2.3. Rest of South America
-
3. Europe
- 3.1. United Kingdom
- 3.2. Germany
- 3.3. France
- 3.4. Italy
- 3.5. Spain
- 3.6. Russia
- 3.7. Benelux
- 3.8. Nordics
- 3.9. Rest of Europe
-
4. Middle East & Africa
- 4.1. Turkey
- 4.2. Israel
- 4.3. GCC
- 4.4. North Africa
- 4.5. South Africa
- 4.6. Rest of Middle East & Africa
-
5. Asia Pacific
- 5.1. China
- 5.2. India
- 5.3. Japan
- 5.4. South Korea
- 5.5. ASEAN
- 5.6. Oceania
- 5.7. Rest of Asia Pacific
Reconstituted Orange Juice Regional Market Share
Geographic Coverage of Reconstituted Orange Juice
Reconstituted Orange Juice REPORT HIGHLIGHTS
| Aspects | Details |
|---|---|
| Study Period | 2020-2034 |
| Base Year | 2025 |
| Estimated Year | 2026 |
| Forecast Period | 2026-2034 |
| Historical Period | 2020-2025 |
| Growth Rate | CAGR of 4% from 2020-2034 |
| Segmentation |
|
Table of Contents
- 1. Introduction
- 1.1. Research Scope
- 1.2. Market Segmentation
- 1.3. Research Methodology
- 1.4. Definitions and Assumptions
- 2. Executive Summary
- 2.1. Introduction
- 3. Market Dynamics
- 3.1. Introduction
- 3.2. Market Drivers
- 3.3. Market Restrains
- 3.4. Market Trends
- 4. Market Factor Analysis
- 4.1. Porters Five Forces
- 4.2. Supply/Value Chain
- 4.3. PESTEL analysis
- 4.4. Market Entropy
- 4.5. Patent/Trademark Analysis
- 5. Global Reconstituted Orange Juice Analysis, Insights and Forecast, 2020-2032
- 5.1. Market Analysis, Insights and Forecast - by Application
- 5.1.1. Hotels
- 5.1.2. Restaurants
- 5.1.3. Cafes
- 5.1.4. Household
- 5.2. Market Analysis, Insights and Forecast - by Type
- 5.2.1. Organic
- 5.2.2. Conventional
- 5.3. Market Analysis, Insights and Forecast - by Region
- 5.3.1. North America
- 5.3.2. South America
- 5.3.3. Europe
- 5.3.4. Middle East & Africa
- 5.3.5. Asia Pacific
- 5.1. Market Analysis, Insights and Forecast - by Application
- 6. North America Reconstituted Orange Juice Analysis, Insights and Forecast, 2020-2032
- 6.1. Market Analysis, Insights and Forecast - by Application
- 6.1.1. Hotels
- 6.1.2. Restaurants
- 6.1.3. Cafes
- 6.1.4. Household
- 6.2. Market Analysis, Insights and Forecast - by Type
- 6.2.1. Organic
- 6.2.2. Conventional
- 6.1. Market Analysis, Insights and Forecast - by Application
- 7. South America Reconstituted Orange Juice Analysis, Insights and Forecast, 2020-2032
- 7.1. Market Analysis, Insights and Forecast - by Application
- 7.1.1. Hotels
- 7.1.2. Restaurants
- 7.1.3. Cafes
- 7.1.4. Household
- 7.2. Market Analysis, Insights and Forecast - by Type
- 7.2.1. Organic
- 7.2.2. Conventional
- 7.1. Market Analysis, Insights and Forecast - by Application
- 8. Europe Reconstituted Orange Juice Analysis, Insights and Forecast, 2020-2032
- 8.1. Market Analysis, Insights and Forecast - by Application
- 8.1.1. Hotels
- 8.1.2. Restaurants
- 8.1.3. Cafes
- 8.1.4. Household
- 8.2. Market Analysis, Insights and Forecast - by Type
- 8.2.1. Organic
- 8.2.2. Conventional
- 8.1. Market Analysis, Insights and Forecast - by Application
- 9. Middle East & Africa Reconstituted Orange Juice Analysis, Insights and Forecast, 2020-2032
- 9.1. Market Analysis, Insights and Forecast - by Application
- 9.1.1. Hotels
- 9.1.2. Restaurants
- 9.1.3. Cafes
- 9.1.4. Household
- 9.2. Market Analysis, Insights and Forecast - by Type
- 9.2.1. Organic
- 9.2.2. Conventional
- 9.1. Market Analysis, Insights and Forecast - by Application
- 10. Asia Pacific Reconstituted Orange Juice Analysis, Insights and Forecast, 2020-2032
- 10.1. Market Analysis, Insights and Forecast - by Application
- 10.1.1. Hotels
- 10.1.2. Restaurants
- 10.1.3. Cafes
- 10.1.4. Household
- 10.2. Market Analysis, Insights and Forecast - by Type
- 10.2.1. Organic
- 10.2.2. Conventional
- 10.1. Market Analysis, Insights and Forecast - by Application
- 11. Competitive Analysis
- 11.1. Global Market Share Analysis 2025
- 11.2. Company Profiles
- 11.2.1 PepsiCo Ltd.
- 11.2.1.1. Overview
- 11.2.1.2. Products
- 11.2.1.3. SWOT Analysis
- 11.2.1.4. Recent Developments
- 11.2.1.5. Financials (Based on Availability)
- 11.2.2 The Daily Juice Company
- 11.2.2.1. Overview
- 11.2.2.2. Products
- 11.2.2.3. SWOT Analysis
- 11.2.2.4. Recent Developments
- 11.2.2.5. Financials (Based on Availability)
- 11.2.3 S.M. Jaleel & Co. Ltd.
- 11.2.3.1. Overview
- 11.2.3.2. Products
- 11.2.3.3. SWOT Analysis
- 11.2.3.4. Recent Developments
- 11.2.3.5. Financials (Based on Availability)
- 11.2.4 Citrus World
- 11.2.4.1. Overview
- 11.2.4.2. Products
- 11.2.4.3. SWOT Analysis
- 11.2.4.4. Recent Developments
- 11.2.4.5. Financials (Based on Availability)
- 11.2.5 Inc.
- 11.2.5.1. Overview
- 11.2.5.2. Products
- 11.2.5.3. SWOT Analysis
- 11.2.5.4. Recent Developments
- 11.2.5.5. Financials (Based on Availability)
- 11.2.6 Citrosuco S.A.
- 11.2.6.1. Overview
- 11.2.6.2. Products
- 11.2.6.3. SWOT Analysis
- 11.2.6.4. Recent Developments
- 11.2.6.5. Financials (Based on Availability)
- 11.2.7 Louis Dreyfus Company B.V.
- 11.2.7.1. Overview
- 11.2.7.2. Products
- 11.2.7.3. SWOT Analysis
- 11.2.7.4. Recent Developments
- 11.2.7.5. Financials (Based on Availability)
- 11.2.8 Lemon Concentrate S.L.
- 11.2.8.1. Overview
- 11.2.8.2. Products
- 11.2.8.3. SWOT Analysis
- 11.2.8.4. Recent Developments
- 11.2.8.5. Financials (Based on Availability)
- 11.2.9 Frunutex Sp. z o.o.
- 11.2.9.1. Overview
- 11.2.9.2. Products
- 11.2.9.3. SWOT Analysis
- 11.2.9.4. Recent Developments
- 11.2.9.5. Financials (Based on Availability)
- 11.2.10 AGRANA Beteiligungs-AG.
- 11.2.10.1. Overview
- 11.2.10.2. Products
- 11.2.10.3. SWOT Analysis
- 11.2.10.4. Recent Developments
- 11.2.10.5. Financials (Based on Availability)
- 11.2.1 PepsiCo Ltd.
List of Figures
- Figure 1: Global Reconstituted Orange Juice Revenue Breakdown (undefined, %) by Region 2025 & 2033
- Figure 2: North America Reconstituted Orange Juice Revenue (undefined), by Application 2025 & 2033
- Figure 3: North America Reconstituted Orange Juice Revenue Share (%), by Application 2025 & 2033
- Figure 4: North America Reconstituted Orange Juice Revenue (undefined), by Type 2025 & 2033
- Figure 5: North America Reconstituted Orange Juice Revenue Share (%), by Type 2025 & 2033
- Figure 6: North America Reconstituted Orange Juice Revenue (undefined), by Country 2025 & 2033
- Figure 7: North America Reconstituted Orange Juice Revenue Share (%), by Country 2025 & 2033
- Figure 8: South America Reconstituted Orange Juice Revenue (undefined), by Application 2025 & 2033
- Figure 9: South America Reconstituted Orange Juice Revenue Share (%), by Application 2025 & 2033
- Figure 10: South America Reconstituted Orange Juice Revenue (undefined), by Type 2025 & 2033
- Figure 11: South America Reconstituted Orange Juice Revenue Share (%), by Type 2025 & 2033
- Figure 12: South America Reconstituted Orange Juice Revenue (undefined), by Country 2025 & 2033
- Figure 13: South America Reconstituted Orange Juice Revenue Share (%), by Country 2025 & 2033
- Figure 14: Europe Reconstituted Orange Juice Revenue (undefined), by Application 2025 & 2033
- Figure 15: Europe Reconstituted Orange Juice Revenue Share (%), by Application 2025 & 2033
- Figure 16: Europe Reconstituted Orange Juice Revenue (undefined), by Type 2025 & 2033
- Figure 17: Europe Reconstituted Orange Juice Revenue Share (%), by Type 2025 & 2033
- Figure 18: Europe Reconstituted Orange Juice Revenue (undefined), by Country 2025 & 2033
- Figure 19: Europe Reconstituted Orange Juice Revenue Share (%), by Country 2025 & 2033
- Figure 20: Middle East & Africa Reconstituted Orange Juice Revenue (undefined), by Application 2025 & 2033
- Figure 21: Middle East & Africa Reconstituted Orange Juice Revenue Share (%), by Application 2025 & 2033
- Figure 22: Middle East & Africa Reconstituted Orange Juice Revenue (undefined), by Type 2025 & 2033
- Figure 23: Middle East & Africa Reconstituted Orange Juice Revenue Share (%), by Type 2025 & 2033
- Figure 24: Middle East & Africa Reconstituted Orange Juice Revenue (undefined), by Country 2025 & 2033
- Figure 25: Middle East & Africa Reconstituted Orange Juice Revenue Share (%), by Country 2025 & 2033
- Figure 26: Asia Pacific Reconstituted Orange Juice Revenue (undefined), by Application 2025 & 2033
- Figure 27: Asia Pacific Reconstituted Orange Juice Revenue Share (%), by Application 2025 & 2033
- Figure 28: Asia Pacific Reconstituted Orange Juice Revenue (undefined), by Type 2025 & 2033
- Figure 29: Asia Pacific Reconstituted Orange Juice Revenue Share (%), by Type 2025 & 2033
- Figure 30: Asia Pacific Reconstituted Orange Juice Revenue (undefined), by Country 2025 & 2033
- Figure 31: Asia Pacific Reconstituted Orange Juice Revenue Share (%), by Country 2025 & 2033
List of Tables
- Table 1: Global Reconstituted Orange Juice Revenue undefined Forecast, by Application 2020 & 2033
- Table 2: Global Reconstituted Orange Juice Revenue undefined Forecast, by Type 2020 & 2033
- Table 3: Global Reconstituted Orange Juice Revenue undefined Forecast, by Region 2020 & 2033
- Table 4: Global Reconstituted Orange Juice Revenue undefined Forecast, by Application 2020 & 2033
- Table 5: Global Reconstituted Orange Juice Revenue undefined Forecast, by Type 2020 & 2033
- Table 6: Global Reconstituted Orange Juice Revenue undefined Forecast, by Country 2020 & 2033
- Table 7: United States Reconstituted Orange Juice Revenue (undefined) Forecast, by Application 2020 & 2033
- Table 8: Canada Reconstituted Orange Juice Revenue (undefined) Forecast, by Application 2020 & 2033
- Table 9: Mexico Reconstituted Orange Juice Revenue (undefined) Forecast, by Application 2020 & 2033
- Table 10: Global Reconstituted Orange Juice Revenue undefined Forecast, by Application 2020 & 2033
- Table 11: Global Reconstituted Orange Juice Revenue undefined Forecast, by Type 2020 & 2033
- Table 12: Global Reconstituted Orange Juice Revenue undefined Forecast, by Country 2020 & 2033
- Table 13: Brazil Reconstituted Orange Juice Revenue (undefined) Forecast, by Application 2020 & 2033
- Table 14: Argentina Reconstituted Orange Juice Revenue (undefined) Forecast, by Application 2020 & 2033
- Table 15: Rest of South America Reconstituted Orange Juice Revenue (undefined) Forecast, by Application 2020 & 2033
- Table 16: Global Reconstituted Orange Juice Revenue undefined Forecast, by Application 2020 & 2033
- Table 17: Global Reconstituted Orange Juice Revenue undefined Forecast, by Type 2020 & 2033
- Table 18: Global Reconstituted Orange Juice Revenue undefined Forecast, by Country 2020 & 2033
- Table 19: United Kingdom Reconstituted Orange Juice Revenue (undefined) Forecast, by Application 2020 & 2033
- Table 20: Germany Reconstituted Orange Juice Revenue (undefined) Forecast, by Application 2020 & 2033
- Table 21: France Reconstituted Orange Juice Revenue (undefined) Forecast, by Application 2020 & 2033
- Table 22: Italy Reconstituted Orange Juice Revenue (undefined) Forecast, by Application 2020 & 2033
- Table 23: Spain Reconstituted Orange Juice Revenue (undefined) Forecast, by Application 2020 & 2033
- Table 24: Russia Reconstituted Orange Juice Revenue (undefined) Forecast, by Application 2020 & 2033
- Table 25: Benelux Reconstituted Orange Juice Revenue (undefined) Forecast, by Application 2020 & 2033
- Table 26: Nordics Reconstituted Orange Juice Revenue (undefined) Forecast, by Application 2020 & 2033
- Table 27: Rest of Europe Reconstituted Orange Juice Revenue (undefined) Forecast, by Application 2020 & 2033
- Table 28: Global Reconstituted Orange Juice Revenue undefined Forecast, by Application 2020 & 2033
- Table 29: Global Reconstituted Orange Juice Revenue undefined Forecast, by Type 2020 & 2033
- Table 30: Global Reconstituted Orange Juice Revenue undefined Forecast, by Country 2020 & 2033
- Table 31: Turkey Reconstituted Orange Juice Revenue (undefined) Forecast, by Application 2020 & 2033
- Table 32: Israel Reconstituted Orange Juice Revenue (undefined) Forecast, by Application 2020 & 2033
- Table 33: GCC Reconstituted Orange Juice Revenue (undefined) Forecast, by Application 2020 & 2033
- Table 34: North Africa Reconstituted Orange Juice Revenue (undefined) Forecast, by Application 2020 & 2033
- Table 35: South Africa Reconstituted Orange Juice Revenue (undefined) Forecast, by Application 2020 & 2033
- Table 36: Rest of Middle East & Africa Reconstituted Orange Juice Revenue (undefined) Forecast, by Application 2020 & 2033
- Table 37: Global Reconstituted Orange Juice Revenue undefined Forecast, by Application 2020 & 2033
- Table 38: Global Reconstituted Orange Juice Revenue undefined Forecast, by Type 2020 & 2033
- Table 39: Global Reconstituted Orange Juice Revenue undefined Forecast, by Country 2020 & 2033
- Table 40: China Reconstituted Orange Juice Revenue (undefined) Forecast, by Application 2020 & 2033
- Table 41: India Reconstituted Orange Juice Revenue (undefined) Forecast, by Application 2020 & 2033
- Table 42: Japan Reconstituted Orange Juice Revenue (undefined) Forecast, by Application 2020 & 2033
- Table 43: South Korea Reconstituted Orange Juice Revenue (undefined) Forecast, by Application 2020 & 2033
- Table 44: ASEAN Reconstituted Orange Juice Revenue (undefined) Forecast, by Application 2020 & 2033
- Table 45: Oceania Reconstituted Orange Juice Revenue (undefined) Forecast, by Application 2020 & 2033
- Table 46: Rest of Asia Pacific Reconstituted Orange Juice Revenue (undefined) Forecast, by Application 2020 & 2033
Frequently Asked Questions
1. What is the projected Compound Annual Growth Rate (CAGR) of the Reconstituted Orange Juice?
The projected CAGR is approximately 4%.
2. Which companies are prominent players in the Reconstituted Orange Juice?
Key companies in the market include PepsiCo Ltd., The Daily Juice Company, S.M. Jaleel & Co. Ltd., Citrus World, Inc., Citrosuco S.A., Louis Dreyfus Company B.V., Lemon Concentrate S.L., Frunutex Sp. z o.o., AGRANA Beteiligungs-AG..
3. What are the main segments of the Reconstituted Orange Juice?
The market segments include Application, Type.
4. Can you provide details about the market size?
The market size is estimated to be USD XXX N/A as of 2022.
5. What are some drivers contributing to market growth?
N/A
6. What are the notable trends driving market growth?
N/A
7. Are there any restraints impacting market growth?
N/A
8. Can you provide examples of recent developments in the market?
N/A
9. What pricing options are available for accessing the report?
Pricing options include single-user, multi-user, and enterprise licenses priced at USD 2900.00, USD 4350.00, and USD 5800.00 respectively.
10. Is the market size provided in terms of value or volume?
The market size is provided in terms of value, measured in N/A.
11. Are there any specific market keywords associated with the report?
Yes, the market keyword associated with the report is "Reconstituted Orange Juice," which aids in identifying and referencing the specific market segment covered.
12. How do I determine which pricing option suits my needs best?
The pricing options vary based on user requirements and access needs. Individual users may opt for single-user licenses, while businesses requiring broader access may choose multi-user or enterprise licenses for cost-effective access to the report.
13. Are there any additional resources or data provided in the Reconstituted Orange Juice report?
While the report offers comprehensive insights, it's advisable to review the specific contents or supplementary materials provided to ascertain if additional resources or data are available.
14. How can I stay updated on further developments or reports in the Reconstituted Orange Juice?
To stay informed about further developments, trends, and reports in the Reconstituted Orange Juice, consider subscribing to industry newsletters, following relevant companies and organizations, or regularly checking reputable industry news sources and publications.
Methodology
Step 1 - Identification of Relevant Samples Size from Population Database


Step 2 - Approaches for Defining Global Market Size (Value, Volume* & Price*)

Note*: In applicable scenarios
Step 3 - Data Sources
Primary Research
- Web Analytics
- Survey Reports
- Research Institute
- Latest Research Reports
- Opinion Leaders
Secondary Research
- Annual Reports
- White Paper
- Latest Press Release
- Industry Association
- Paid Database
- Investor Presentations

Step 4 - Data Triangulation
Involves using different sources of information in order to increase the validity of a study
These sources are likely to be stakeholders in a program - participants, other researchers, program staff, other community members, and so on.
Then we put all data in single framework & apply various statistical tools to find out the dynamic on the market.
During the analysis stage, feedback from the stakeholder groups would be compared to determine areas of agreement as well as areas of divergence