

Key Insights
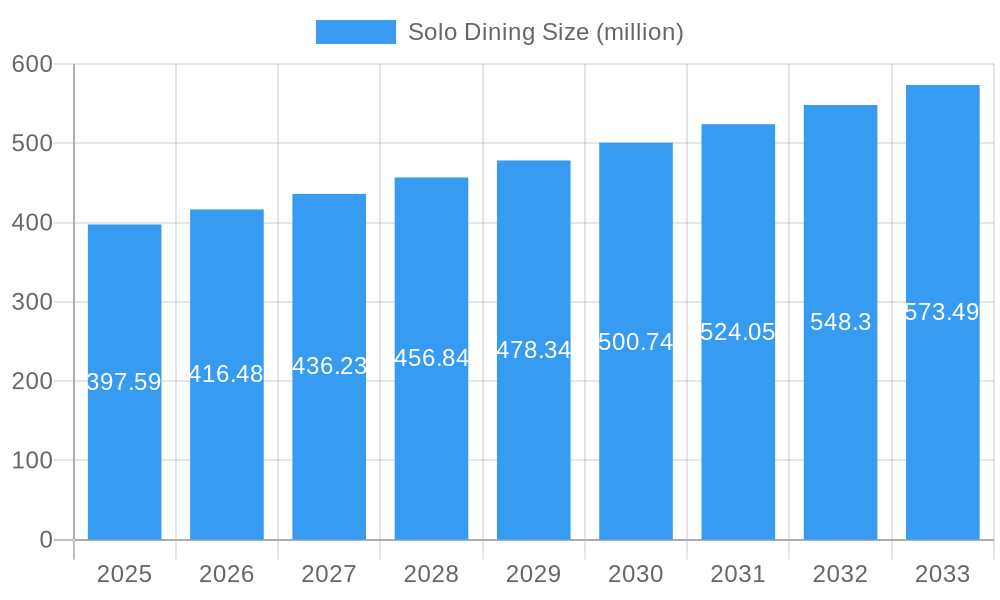
The solo dining market, valued at $397.59 million in 2025, is experiencing robust growth, projected to expand at a compound annual growth rate (CAGR) of 4.8% from 2025 to 2033. This surge is driven by several key factors. Increasing urbanization and a rise in single-person households contribute significantly to the market's expansion. Furthermore, changing lifestyles, including longer working hours and a greater emphasis on convenience and individual experiences, fuel the demand for readily available and appealing solo dining options. The market is witnessing innovation in restaurant offerings, with many establishments catering specifically to solo diners through features such as comfortable single-person seating, quick service options, and personalized digital ordering systems. The rise of food delivery platforms and the growing popularity of "grab-and-go" meals further enhance the accessibility and convenience of solo dining experiences. Major players such as McDonald's, KFC, Starbucks, and others are adapting their strategies to capture this growing market segment.
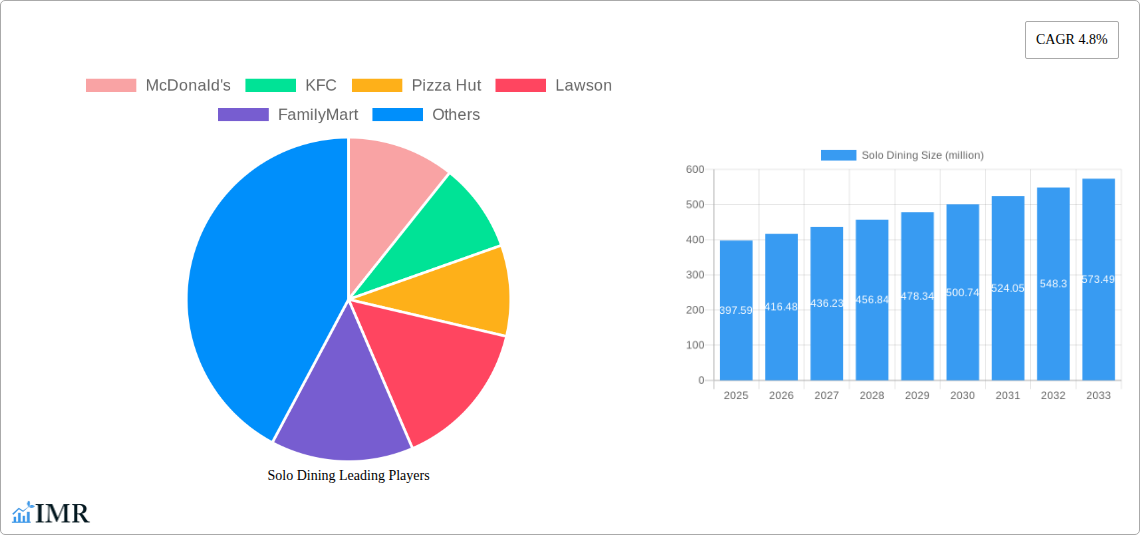
Solo Dining Market Size (In Million)
The competitive landscape is diverse, encompassing both fast-food chains and upscale restaurants, reflecting the broad appeal of solo dining across various demographics and price points. While the fast-casual segment holds a substantial share, the market is also witnessing the emergence of specialized eateries designed exclusively for solo diners, indicating the increasing sophistication of consumer preferences. Challenges remain, such as the social perception of solo dining in certain cultures and the need to create an atmosphere that fosters a sense of comfort and belonging for individuals dining alone. However, the overall growth trajectory indicates a promising future for this market segment, with continued expansion driven by evolving consumer preferences and innovative business models.
Solo Dining Company Market Share
Solo Dining Market Report: 2019-2033
This comprehensive report provides an in-depth analysis of the global Solo Dining market, encompassing historical data (2019-2024), current estimates (2025), and future projections (2025-2033). We delve into market dynamics, growth trends, regional performance, product innovation, and key players, offering actionable insights for industry professionals and investors. The report covers the parent market of Food Service and the child market of Quick Service Restaurants (QSR) and Convenience Stores, providing a granular understanding of the solo dining phenomenon. The market size is projected to reach xx million by 2033.
Solo Dining Market Dynamics & Structure
This section analyzes the competitive landscape, technological advancements, and regulatory influences shaping the solo dining experience. The market exhibits moderate concentration, with key players like McDonald's and Starbucks holding significant shares. Technological innovation, particularly in mobile ordering and contactless payment systems, is a major growth driver. Regulatory changes concerning food safety and hygiene significantly impact operations. The rise of meal delivery services presents a strong competitive substitute. End-user demographics show a strong correlation with younger, urban populations with busy lifestyles. M&A activity in the sector has been moderate, with xx deals recorded during the historical period (2019-2024), primarily focused on expansion and diversification.
- Market Concentration: Moderately concentrated, with top 5 players holding xx% market share in 2025.
- Technological Innovation: Mobile ordering, AI-powered recommendations, and automated kiosks are key drivers.
- Regulatory Framework: Food safety standards and labor regulations significantly influence operational costs.
- Competitive Substitutes: Meal delivery services and home-cooked meals pose a considerable threat.
- End-User Demographics: Young professionals (25-45 years) and urban dwellers are primary consumers.
- M&A Trends: xx M&A deals between 2019 and 2024, primarily for expansion into new markets.
Solo Dining Growth Trends & Insights
The Solo Dining market has witnessed robust growth over the historical period (2019-2024), driven by changing lifestyles, increased urbanization, and the proliferation of convenient food options. The market size expanded from xx million in 2019 to xx million in 2024, exhibiting a CAGR of xx%. Technological disruptions, such as the rise of mobile ordering and delivery apps, have significantly accelerated market adoption. Consumer behavior shifts toward convenience and individualization further fuel this trend. The market penetration rate is expected to reach xx% by 2033. Furthermore, the increasing disposable income in emerging economies is anticipated to contribute significantly to market expansion.
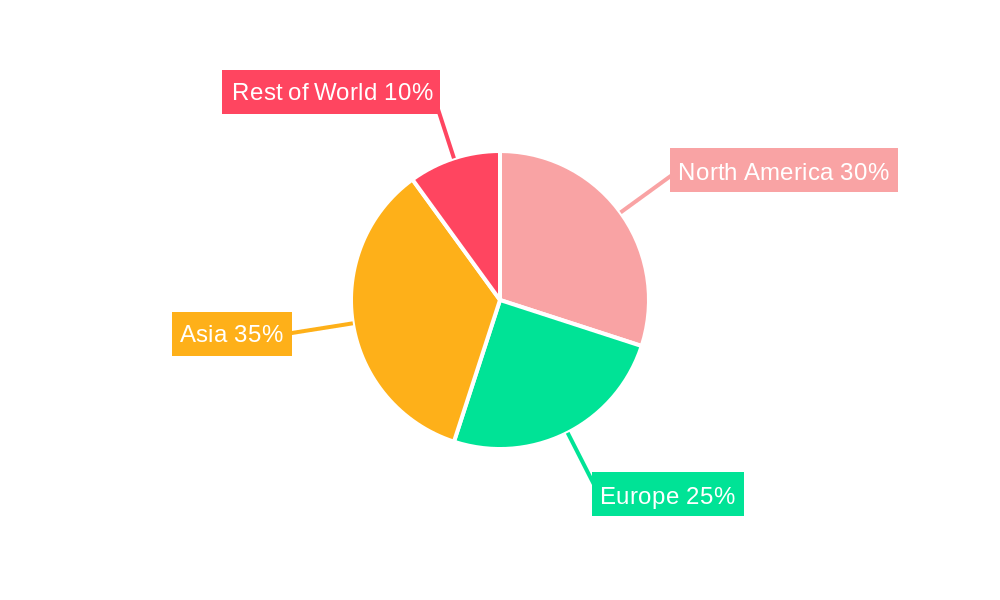
Dominant Regions, Countries, or Segments in Solo Dining
The [Region/Country - e.g., North America] region dominates the global Solo Dining market, driven by high disposable income, busy lifestyles, and a developed infrastructure supporting QSR and convenience store chains. China and other Asian markets are rapidly catching up, fueled by rapid urbanization and rising middle-class incomes. The QSR segment is the largest contributor to the market, while the convenience store segment demonstrates faster growth.
- Key Drivers in [Region/Country - e.g., North America]: High disposable incomes, strong QSR presence, and established delivery infrastructure.
- Key Drivers in Asia: Rapid urbanization, rising middle-class, and growing demand for convenient food solutions.
- Market Share: [Region/Country - e.g., North America] holds approximately xx% of the global market in 2025.
- Growth Potential: Asia-Pacific is projected to experience the highest CAGR during the forecast period.
Solo Dining Product Landscape
Solo dining options have expanded beyond traditional fast food, encompassing a diverse range of products catering to various dietary preferences and lifestyles. Innovations include personalized meal customization options, healthier choices (e.g., vegetarian, vegan), and convenient packaging formats for takeaway and delivery. Technological advancements in food preparation and delivery optimize efficiency and customer experience. Unique selling propositions focus on convenience, speed, and customization.
Key Drivers, Barriers & Challenges in Solo Dining
Key Drivers: Increasing urbanization, rising disposable incomes, time-constrained lifestyles, technological advancements (mobile ordering, delivery apps), and growing awareness of diverse dietary preferences.
Challenges: Intense competition, rising food costs, stringent food safety regulations, maintaining consistent food quality, and managing operational efficiency in high-volume settings. Supply chain disruptions can cause significant revenue loss, estimated to be xx million annually in 2025.
Emerging Opportunities in Solo Dining
Untapped markets in developing countries present significant growth opportunities. Innovations in personalized nutrition and customized meal options cater to evolving consumer preferences. Expansion into niche segments, such as healthy and sustainable food options, presents promising avenues. Technological advancements in AI-powered personalized recommendations enhance customer experience and drive sales.
Growth Accelerators in the Solo Dining Industry
Strategic partnerships between QSR chains and technology providers enhance delivery efficiency and customer engagement. Expansion into new markets, particularly developing economies, presents significant growth potential. Technological advancements in food preparation and automation will further enhance efficiency and customer experience. Investment in sustainable and eco-friendly packaging is becoming increasingly crucial.
Key Players Shaping the Solo Dining Market
- McDonald's
- KFC
- Pizza Hut
- Lawson
- FamilyMart
- Nestle
- Starbucks
- 7-Eleven
- Costa Coffee
- Kraft Foods
- Fujiya
- BHC
- Zihaiguo
- Uni-President
- Haidilao
- Sanquan Food
- Three Squirrels
- BESTORE
- Weilong
- Laochengnan
- Mo Xiaoxian
Notable Milestones in Solo Dining Sector
- 2020: Increased adoption of contactless ordering and payment systems due to the pandemic.
- 2021: Launch of several AI-powered food recommendation apps by major QSR chains.
- 2022: Significant growth in the meal kit delivery segment, targeting solo diners.
- 2023: Expansion of plant-based and sustainable food options in major QSR chains.
In-Depth Solo Dining Market Outlook
The Solo Dining market is poised for continued growth, driven by evolving consumer preferences, technological advancements, and expanding market penetration in developing economies. Strategic partnerships, investments in technology, and a focus on sustainability will be critical for long-term success. The market presents significant opportunities for innovative players to cater to the diverse needs and preferences of solo diners.
Solo Dining Segmentation
-
1. Application
- 1.1. Office Lunch
- 1.2. Hotels & B&Bs
- 1.3. Others
-
2. Type
- 2.1. Self-Heating Food
- 2.2. Convenience Store Bento
- 2.3. Others
Solo Dining Segmentation By Geography
-
1. North America
- 1.1. United States
- 1.2. Canada
- 1.3. Mexico
-
2. South America
- 2.1. Brazil
- 2.2. Argentina
- 2.3. Rest of South America
-
3. Europe
- 3.1. United Kingdom
- 3.2. Germany
- 3.3. France
- 3.4. Italy
- 3.5. Spain
- 3.6. Russia
- 3.7. Benelux
- 3.8. Nordics
- 3.9. Rest of Europe
-
4. Middle East & Africa
- 4.1. Turkey
- 4.2. Israel
- 4.3. GCC
- 4.4. North Africa
- 4.5. South Africa
- 4.6. Rest of Middle East & Africa
-
5. Asia Pacific
- 5.1. China
- 5.2. India
- 5.3. Japan
- 5.4. South Korea
- 5.5. ASEAN
- 5.6. Oceania
- 5.7. Rest of Asia Pacific
Solo Dining Regional Market Share
Geographic Coverage of Solo Dining
Solo Dining REPORT HIGHLIGHTS
| Aspects | Details |
|---|---|
| Study Period | 2020-2034 |
| Base Year | 2025 |
| Estimated Year | 2026 |
| Forecast Period | 2026-2034 |
| Historical Period | 2020-2025 |
| Growth Rate | CAGR of 4.8% from 2020-2034 |
| Segmentation |
|
Table of Contents
- 1. Introduction
- 1.1. Research Scope
- 1.2. Market Segmentation
- 1.3. Research Methodology
- 1.4. Definitions and Assumptions
- 2. Executive Summary
- 2.1. Introduction
- 3. Market Dynamics
- 3.1. Introduction
- 3.2. Market Drivers
- 3.3. Market Restrains
- 3.4. Market Trends
- 4. Market Factor Analysis
- 4.1. Porters Five Forces
- 4.2. Supply/Value Chain
- 4.3. PESTEL analysis
- 4.4. Market Entropy
- 4.5. Patent/Trademark Analysis
- 5. Global Solo Dining Analysis, Insights and Forecast, 2020-2032
- 5.1. Market Analysis, Insights and Forecast - by Application
- 5.1.1. Office Lunch
- 5.1.2. Hotels & B&Bs
- 5.1.3. Others
- 5.2. Market Analysis, Insights and Forecast - by Type
- 5.2.1. Self-Heating Food
- 5.2.2. Convenience Store Bento
- 5.2.3. Others
- 5.3. Market Analysis, Insights and Forecast - by Region
- 5.3.1. North America
- 5.3.2. South America
- 5.3.3. Europe
- 5.3.4. Middle East & Africa
- 5.3.5. Asia Pacific
- 5.1. Market Analysis, Insights and Forecast - by Application
- 6. North America Solo Dining Analysis, Insights and Forecast, 2020-2032
- 6.1. Market Analysis, Insights and Forecast - by Application
- 6.1.1. Office Lunch
- 6.1.2. Hotels & B&Bs
- 6.1.3. Others
- 6.2. Market Analysis, Insights and Forecast - by Type
- 6.2.1. Self-Heating Food
- 6.2.2. Convenience Store Bento
- 6.2.3. Others
- 6.1. Market Analysis, Insights and Forecast - by Application
- 7. South America Solo Dining Analysis, Insights and Forecast, 2020-2032
- 7.1. Market Analysis, Insights and Forecast - by Application
- 7.1.1. Office Lunch
- 7.1.2. Hotels & B&Bs
- 7.1.3. Others
- 7.2. Market Analysis, Insights and Forecast - by Type
- 7.2.1. Self-Heating Food
- 7.2.2. Convenience Store Bento
- 7.2.3. Others
- 7.1. Market Analysis, Insights and Forecast - by Application
- 8. Europe Solo Dining Analysis, Insights and Forecast, 2020-2032
- 8.1. Market Analysis, Insights and Forecast - by Application
- 8.1.1. Office Lunch
- 8.1.2. Hotels & B&Bs
- 8.1.3. Others
- 8.2. Market Analysis, Insights and Forecast - by Type
- 8.2.1. Self-Heating Food
- 8.2.2. Convenience Store Bento
- 8.2.3. Others
- 8.1. Market Analysis, Insights and Forecast - by Application
- 9. Middle East & Africa Solo Dining Analysis, Insights and Forecast, 2020-2032
- 9.1. Market Analysis, Insights and Forecast - by Application
- 9.1.1. Office Lunch
- 9.1.2. Hotels & B&Bs
- 9.1.3. Others
- 9.2. Market Analysis, Insights and Forecast - by Type
- 9.2.1. Self-Heating Food
- 9.2.2. Convenience Store Bento
- 9.2.3. Others
- 9.1. Market Analysis, Insights and Forecast - by Application
- 10. Asia Pacific Solo Dining Analysis, Insights and Forecast, 2020-2032
- 10.1. Market Analysis, Insights and Forecast - by Application
- 10.1.1. Office Lunch
- 10.1.2. Hotels & B&Bs
- 10.1.3. Others
- 10.2. Market Analysis, Insights and Forecast - by Type
- 10.2.1. Self-Heating Food
- 10.2.2. Convenience Store Bento
- 10.2.3. Others
- 10.1. Market Analysis, Insights and Forecast - by Application
- 11. Competitive Analysis
- 11.1. Global Market Share Analysis 2025
- 11.2. Company Profiles
- 11.2.1 McDonald's
- 11.2.1.1. Overview
- 11.2.1.2. Products
- 11.2.1.3. SWOT Analysis
- 11.2.1.4. Recent Developments
- 11.2.1.5. Financials (Based on Availability)
- 11.2.2 KFC
- 11.2.2.1. Overview
- 11.2.2.2. Products
- 11.2.2.3. SWOT Analysis
- 11.2.2.4. Recent Developments
- 11.2.2.5. Financials (Based on Availability)
- 11.2.3 Pizza Hut
- 11.2.3.1. Overview
- 11.2.3.2. Products
- 11.2.3.3. SWOT Analysis
- 11.2.3.4. Recent Developments
- 11.2.3.5. Financials (Based on Availability)
- 11.2.4 Lawson
- 11.2.4.1. Overview
- 11.2.4.2. Products
- 11.2.4.3. SWOT Analysis
- 11.2.4.4. Recent Developments
- 11.2.4.5. Financials (Based on Availability)
- 11.2.5 FamilyMart
- 11.2.5.1. Overview
- 11.2.5.2. Products
- 11.2.5.3. SWOT Analysis
- 11.2.5.4. Recent Developments
- 11.2.5.5. Financials (Based on Availability)
- 11.2.6 Nestle
- 11.2.6.1. Overview
- 11.2.6.2. Products
- 11.2.6.3. SWOT Analysis
- 11.2.6.4. Recent Developments
- 11.2.6.5. Financials (Based on Availability)
- 11.2.7 Starbucks
- 11.2.7.1. Overview
- 11.2.7.2. Products
- 11.2.7.3. SWOT Analysis
- 11.2.7.4. Recent Developments
- 11.2.7.5. Financials (Based on Availability)
- 11.2.8 7-Eleven
- 11.2.8.1. Overview
- 11.2.8.2. Products
- 11.2.8.3. SWOT Analysis
- 11.2.8.4. Recent Developments
- 11.2.8.5. Financials (Based on Availability)
- 11.2.9 Costa Coffee
- 11.2.9.1. Overview
- 11.2.9.2. Products
- 11.2.9.3. SWOT Analysis
- 11.2.9.4. Recent Developments
- 11.2.9.5. Financials (Based on Availability)
- 11.2.10 Kraft Foods
- 11.2.10.1. Overview
- 11.2.10.2. Products
- 11.2.10.3. SWOT Analysis
- 11.2.10.4. Recent Developments
- 11.2.10.5. Financials (Based on Availability)
- 11.2.11 Fujiya
- 11.2.11.1. Overview
- 11.2.11.2. Products
- 11.2.11.3. SWOT Analysis
- 11.2.11.4. Recent Developments
- 11.2.11.5. Financials (Based on Availability)
- 11.2.12 BHC
- 11.2.12.1. Overview
- 11.2.12.2. Products
- 11.2.12.3. SWOT Analysis
- 11.2.12.4. Recent Developments
- 11.2.12.5. Financials (Based on Availability)
- 11.2.13 Zihaiguo
- 11.2.13.1. Overview
- 11.2.13.2. Products
- 11.2.13.3. SWOT Analysis
- 11.2.13.4. Recent Developments
- 11.2.13.5. Financials (Based on Availability)
- 11.2.14 Uni-President
- 11.2.14.1. Overview
- 11.2.14.2. Products
- 11.2.14.3. SWOT Analysis
- 11.2.14.4. Recent Developments
- 11.2.14.5. Financials (Based on Availability)
- 11.2.15 Haidilao
- 11.2.15.1. Overview
- 11.2.15.2. Products
- 11.2.15.3. SWOT Analysis
- 11.2.15.4. Recent Developments
- 11.2.15.5. Financials (Based on Availability)
- 11.2.16 Sanquan Food
- 11.2.16.1. Overview
- 11.2.16.2. Products
- 11.2.16.3. SWOT Analysis
- 11.2.16.4. Recent Developments
- 11.2.16.5. Financials (Based on Availability)
- 11.2.17 Three Squirrels
- 11.2.17.1. Overview
- 11.2.17.2. Products
- 11.2.17.3. SWOT Analysis
- 11.2.17.4. Recent Developments
- 11.2.17.5. Financials (Based on Availability)
- 11.2.18 BESTORE
- 11.2.18.1. Overview
- 11.2.18.2. Products
- 11.2.18.3. SWOT Analysis
- 11.2.18.4. Recent Developments
- 11.2.18.5. Financials (Based on Availability)
- 11.2.19 Weilong
- 11.2.19.1. Overview
- 11.2.19.2. Products
- 11.2.19.3. SWOT Analysis
- 11.2.19.4. Recent Developments
- 11.2.19.5. Financials (Based on Availability)
- 11.2.20 Laochengnan
- 11.2.20.1. Overview
- 11.2.20.2. Products
- 11.2.20.3. SWOT Analysis
- 11.2.20.4. Recent Developments
- 11.2.20.5. Financials (Based on Availability)
- 11.2.21 Mo Xiaoxian
- 11.2.21.1. Overview
- 11.2.21.2. Products
- 11.2.21.3. SWOT Analysis
- 11.2.21.4. Recent Developments
- 11.2.21.5. Financials (Based on Availability)
- 11.2.1 McDonald's
List of Figures
- Figure 1: Global Solo Dining Revenue Breakdown (million, %) by Region 2025 & 2033
- Figure 2: North America Solo Dining Revenue (million), by Application 2025 & 2033
- Figure 3: North America Solo Dining Revenue Share (%), by Application 2025 & 2033
- Figure 4: North America Solo Dining Revenue (million), by Type 2025 & 2033
- Figure 5: North America Solo Dining Revenue Share (%), by Type 2025 & 2033
- Figure 6: North America Solo Dining Revenue (million), by Country 2025 & 2033
- Figure 7: North America Solo Dining Revenue Share (%), by Country 2025 & 2033
- Figure 8: South America Solo Dining Revenue (million), by Application 2025 & 2033
- Figure 9: South America Solo Dining Revenue Share (%), by Application 2025 & 2033
- Figure 10: South America Solo Dining Revenue (million), by Type 2025 & 2033
- Figure 11: South America Solo Dining Revenue Share (%), by Type 2025 & 2033
- Figure 12: South America Solo Dining Revenue (million), by Country 2025 & 2033
- Figure 13: South America Solo Dining Revenue Share (%), by Country 2025 & 2033
- Figure 14: Europe Solo Dining Revenue (million), by Application 2025 & 2033
- Figure 15: Europe Solo Dining Revenue Share (%), by Application 2025 & 2033
- Figure 16: Europe Solo Dining Revenue (million), by Type 2025 & 2033
- Figure 17: Europe Solo Dining Revenue Share (%), by Type 2025 & 2033
- Figure 18: Europe Solo Dining Revenue (million), by Country 2025 & 2033
- Figure 19: Europe Solo Dining Revenue Share (%), by Country 2025 & 2033
- Figure 20: Middle East & Africa Solo Dining Revenue (million), by Application 2025 & 2033
- Figure 21: Middle East & Africa Solo Dining Revenue Share (%), by Application 2025 & 2033
- Figure 22: Middle East & Africa Solo Dining Revenue (million), by Type 2025 & 2033
- Figure 23: Middle East & Africa Solo Dining Revenue Share (%), by Type 2025 & 2033
- Figure 24: Middle East & Africa Solo Dining Revenue (million), by Country 2025 & 2033
- Figure 25: Middle East & Africa Solo Dining Revenue Share (%), by Country 2025 & 2033
- Figure 26: Asia Pacific Solo Dining Revenue (million), by Application 2025 & 2033
- Figure 27: Asia Pacific Solo Dining Revenue Share (%), by Application 2025 & 2033
- Figure 28: Asia Pacific Solo Dining Revenue (million), by Type 2025 & 2033
- Figure 29: Asia Pacific Solo Dining Revenue Share (%), by Type 2025 & 2033
- Figure 30: Asia Pacific Solo Dining Revenue (million), by Country 2025 & 2033
- Figure 31: Asia Pacific Solo Dining Revenue Share (%), by Country 2025 & 2033
List of Tables
- Table 1: Global Solo Dining Revenue million Forecast, by Application 2020 & 2033
- Table 2: Global Solo Dining Revenue million Forecast, by Type 2020 & 2033
- Table 3: Global Solo Dining Revenue million Forecast, by Region 2020 & 2033
- Table 4: Global Solo Dining Revenue million Forecast, by Application 2020 & 2033
- Table 5: Global Solo Dining Revenue million Forecast, by Type 2020 & 2033
- Table 6: Global Solo Dining Revenue million Forecast, by Country 2020 & 2033
- Table 7: United States Solo Dining Revenue (million) Forecast, by Application 2020 & 2033
- Table 8: Canada Solo Dining Revenue (million) Forecast, by Application 2020 & 2033
- Table 9: Mexico Solo Dining Revenue (million) Forecast, by Application 2020 & 2033
- Table 10: Global Solo Dining Revenue million Forecast, by Application 2020 & 2033
- Table 11: Global Solo Dining Revenue million Forecast, by Type 2020 & 2033
- Table 12: Global Solo Dining Revenue million Forecast, by Country 2020 & 2033
- Table 13: Brazil Solo Dining Revenue (million) Forecast, by Application 2020 & 2033
- Table 14: Argentina Solo Dining Revenue (million) Forecast, by Application 2020 & 2033
- Table 15: Rest of South America Solo Dining Revenue (million) Forecast, by Application 2020 & 2033
- Table 16: Global Solo Dining Revenue million Forecast, by Application 2020 & 2033
- Table 17: Global Solo Dining Revenue million Forecast, by Type 2020 & 2033
- Table 18: Global Solo Dining Revenue million Forecast, by Country 2020 & 2033
- Table 19: United Kingdom Solo Dining Revenue (million) Forecast, by Application 2020 & 2033
- Table 20: Germany Solo Dining Revenue (million) Forecast, by Application 2020 & 2033
- Table 21: France Solo Dining Revenue (million) Forecast, by Application 2020 & 2033
- Table 22: Italy Solo Dining Revenue (million) Forecast, by Application 2020 & 2033
- Table 23: Spain Solo Dining Revenue (million) Forecast, by Application 2020 & 2033
- Table 24: Russia Solo Dining Revenue (million) Forecast, by Application 2020 & 2033
- Table 25: Benelux Solo Dining Revenue (million) Forecast, by Application 2020 & 2033
- Table 26: Nordics Solo Dining Revenue (million) Forecast, by Application 2020 & 2033
- Table 27: Rest of Europe Solo Dining Revenue (million) Forecast, by Application 2020 & 2033
- Table 28: Global Solo Dining Revenue million Forecast, by Application 2020 & 2033
- Table 29: Global Solo Dining Revenue million Forecast, by Type 2020 & 2033
- Table 30: Global Solo Dining Revenue million Forecast, by Country 2020 & 2033
- Table 31: Turkey Solo Dining Revenue (million) Forecast, by Application 2020 & 2033
- Table 32: Israel Solo Dining Revenue (million) Forecast, by Application 2020 & 2033
- Table 33: GCC Solo Dining Revenue (million) Forecast, by Application 2020 & 2033
- Table 34: North Africa Solo Dining Revenue (million) Forecast, by Application 2020 & 2033
- Table 35: South Africa Solo Dining Revenue (million) Forecast, by Application 2020 & 2033
- Table 36: Rest of Middle East & Africa Solo Dining Revenue (million) Forecast, by Application 2020 & 2033
- Table 37: Global Solo Dining Revenue million Forecast, by Application 2020 & 2033
- Table 38: Global Solo Dining Revenue million Forecast, by Type 2020 & 2033
- Table 39: Global Solo Dining Revenue million Forecast, by Country 2020 & 2033
- Table 40: China Solo Dining Revenue (million) Forecast, by Application 2020 & 2033
- Table 41: India Solo Dining Revenue (million) Forecast, by Application 2020 & 2033
- Table 42: Japan Solo Dining Revenue (million) Forecast, by Application 2020 & 2033
- Table 43: South Korea Solo Dining Revenue (million) Forecast, by Application 2020 & 2033
- Table 44: ASEAN Solo Dining Revenue (million) Forecast, by Application 2020 & 2033
- Table 45: Oceania Solo Dining Revenue (million) Forecast, by Application 2020 & 2033
- Table 46: Rest of Asia Pacific Solo Dining Revenue (million) Forecast, by Application 2020 & 2033
Frequently Asked Questions
1. What is the projected Compound Annual Growth Rate (CAGR) of the Solo Dining?
The projected CAGR is approximately 4.8%.
2. Which companies are prominent players in the Solo Dining?
Key companies in the market include McDonald's, KFC, Pizza Hut, Lawson, FamilyMart, Nestle, Starbucks, 7-Eleven, Costa Coffee, Kraft Foods, Fujiya, BHC, Zihaiguo, Uni-President, Haidilao, Sanquan Food, Three Squirrels, BESTORE, Weilong, Laochengnan, Mo Xiaoxian.
3. What are the main segments of the Solo Dining?
The market segments include Application, Type.
4. Can you provide details about the market size?
The market size is estimated to be USD 397590 million as of 2022.
5. What are some drivers contributing to market growth?
N/A
6. What are the notable trends driving market growth?
N/A
7. Are there any restraints impacting market growth?
N/A
8. Can you provide examples of recent developments in the market?
N/A
9. What pricing options are available for accessing the report?
Pricing options include single-user, multi-user, and enterprise licenses priced at USD 2900.00, USD 4350.00, and USD 5800.00 respectively.
10. Is the market size provided in terms of value or volume?
The market size is provided in terms of value, measured in million.
11. Are there any specific market keywords associated with the report?
Yes, the market keyword associated with the report is "Solo Dining," which aids in identifying and referencing the specific market segment covered.
12. How do I determine which pricing option suits my needs best?
The pricing options vary based on user requirements and access needs. Individual users may opt for single-user licenses, while businesses requiring broader access may choose multi-user or enterprise licenses for cost-effective access to the report.
13. Are there any additional resources or data provided in the Solo Dining report?
While the report offers comprehensive insights, it's advisable to review the specific contents or supplementary materials provided to ascertain if additional resources or data are available.
14. How can I stay updated on further developments or reports in the Solo Dining?
To stay informed about further developments, trends, and reports in the Solo Dining, consider subscribing to industry newsletters, following relevant companies and organizations, or regularly checking reputable industry news sources and publications.
Methodology
Step 1 - Identification of Relevant Samples Size from Population Database


Step 2 - Approaches for Defining Global Market Size (Value, Volume* & Price*)

Note*: In applicable scenarios
Step 3 - Data Sources
Primary Research
- Web Analytics
- Survey Reports
- Research Institute
- Latest Research Reports
- Opinion Leaders
Secondary Research
- Annual Reports
- White Paper
- Latest Press Release
- Industry Association
- Paid Database
- Investor Presentations

Step 4 - Data Triangulation
Involves using different sources of information in order to increase the validity of a study
These sources are likely to be stakeholders in a program - participants, other researchers, program staff, other community members, and so on.
Then we put all data in single framework & apply various statistical tools to find out the dynamic on the market.
During the analysis stage, feedback from the stakeholder groups would be compared to determine areas of agreement as well as areas of divergence