

Key Insights
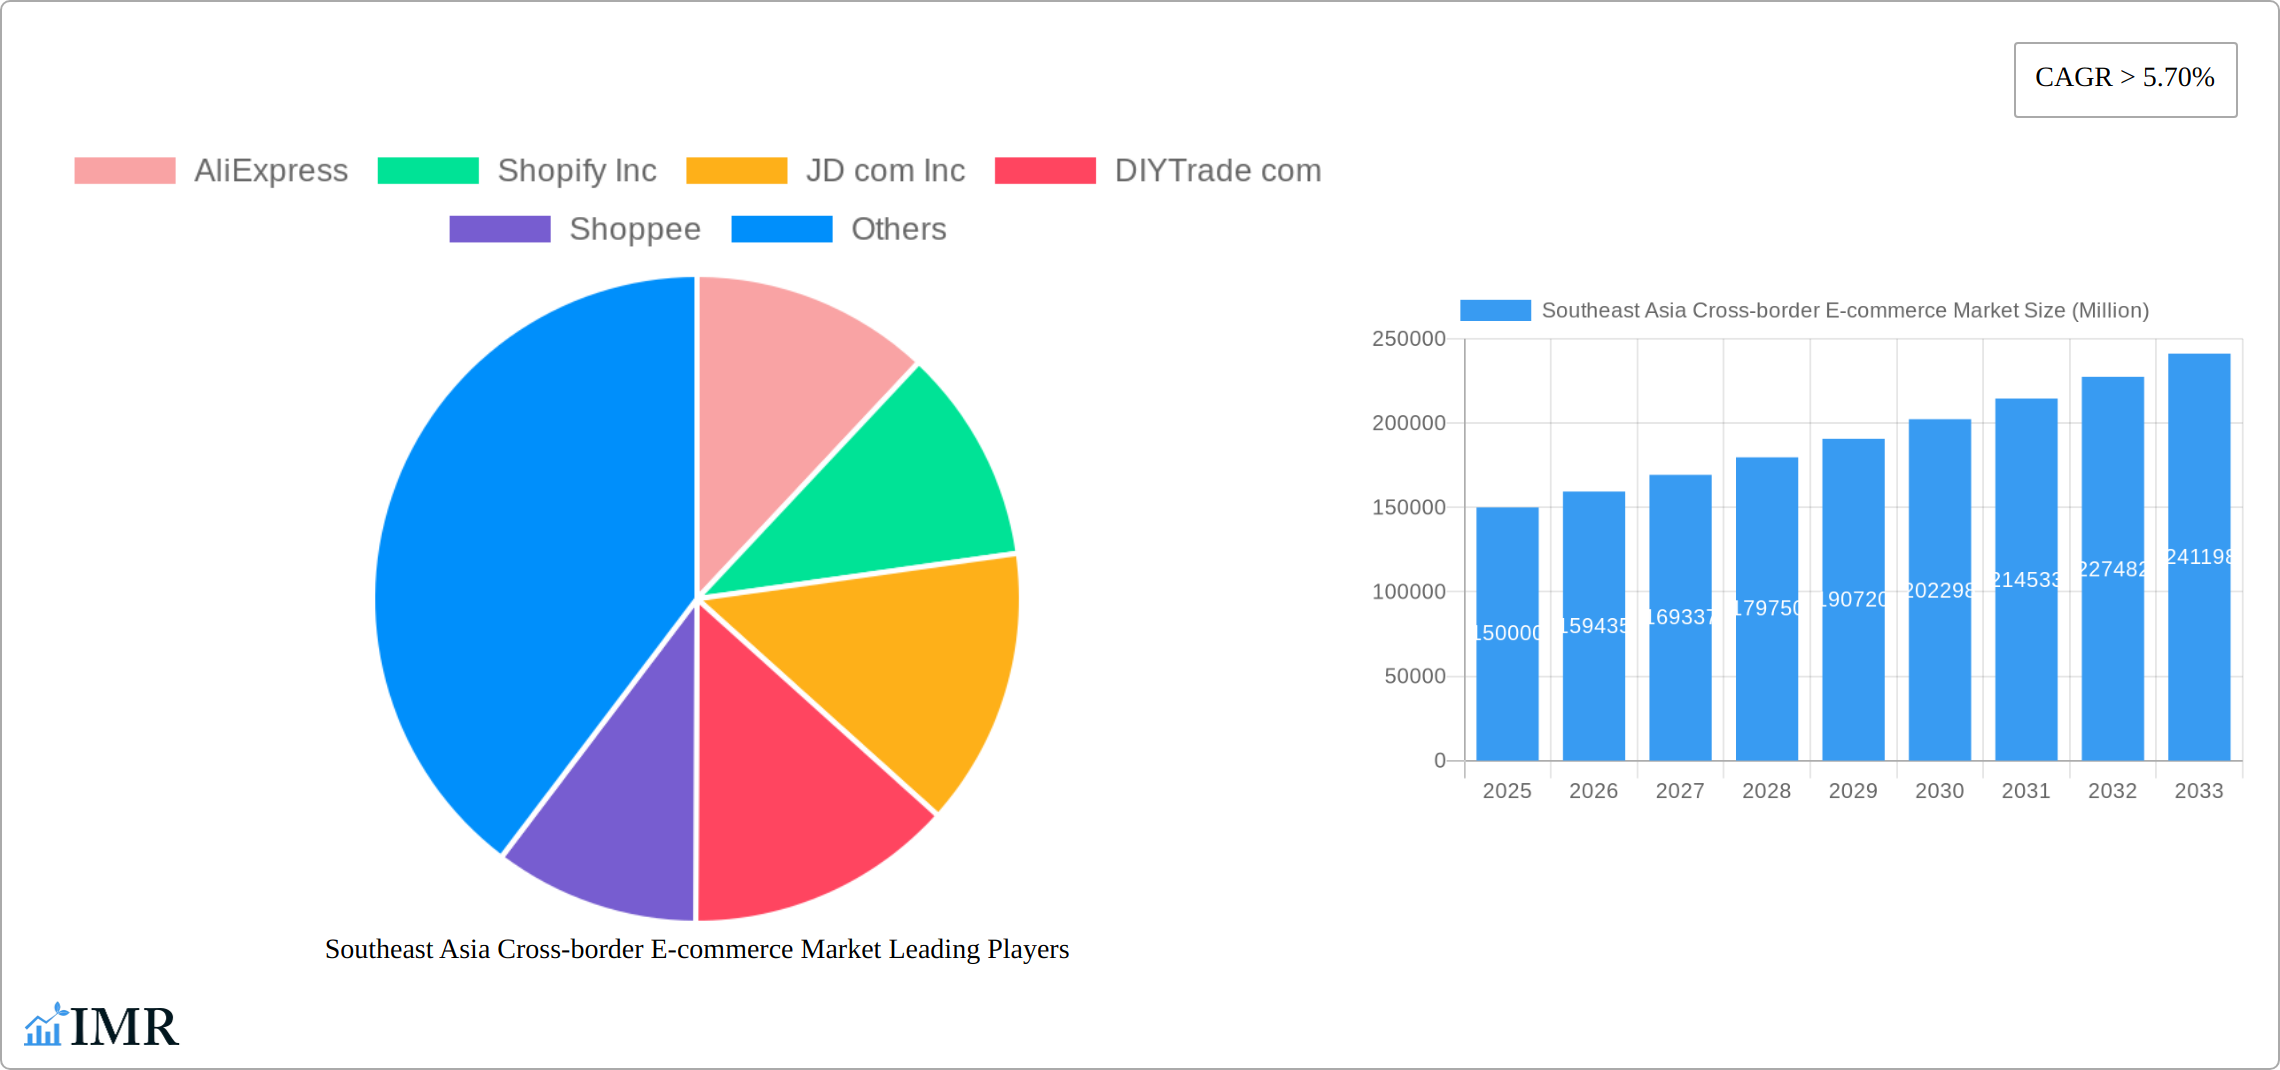
The Southeast Asia cross-border e-commerce market is poised for significant expansion, propelled by enhanced internet and smartphone accessibility, a youthful demographic embracing online retail, and rising regional disposable incomes. The market size is estimated at 201.92 billion as of the base year 2024, with a projected Compound Annual Growth Rate (CAGR) of 21.13%. Key growth catalysts include advancements in logistics, widespread adoption of mobile payment solutions, and the expanding availability of international products. While dominant players like Shopee, Lazada, and AliExpress lead, the fragmented nature of the market presents opportunities for both established and emerging businesses. The fashion and apparel, consumer electronics, and beauty and personal care segments show particularly strong potential, driven by consumer demand for global brands and unique offerings. Challenges such as delivery inconsistencies, product authenticity concerns, and varying digital literacy levels may impact growth. The market segmentation by business model (B2B and B2C) and geography (mature markets like Singapore versus rapidly growing economies like Vietnam and the Philippines) highlights diverse consumer and business needs.
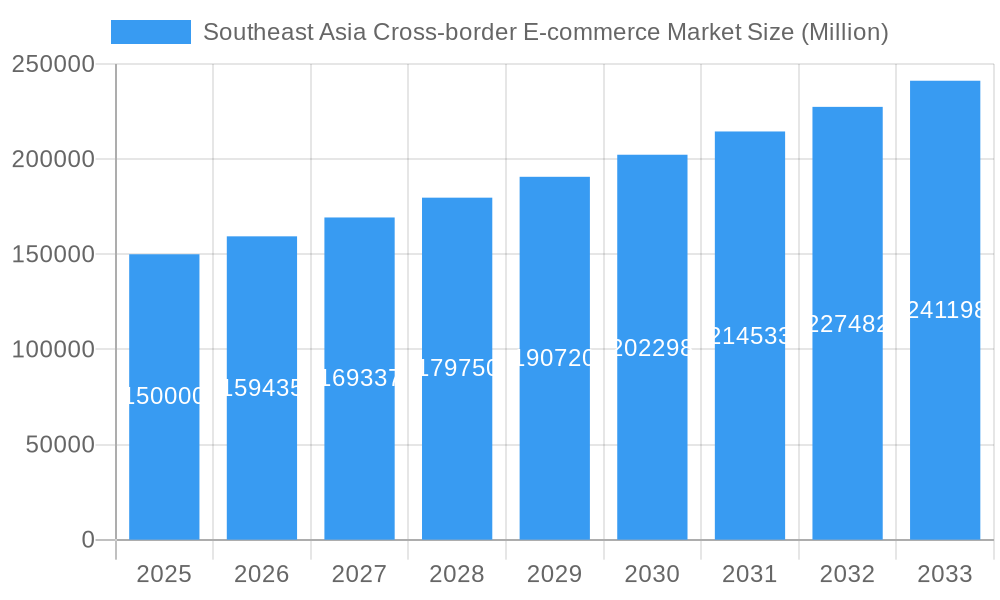
Southeast Asia Cross-border E-commerce Market Market Size (In Billion)
The forecast period of 2025-2033 anticipates sustained market growth across all segments and geographies. Key markets include China, Indonesia, and Vietnam, with the "Rest of Southeast Asia" category offering considerable untapped potential. The increasing adoption of B2B cross-border e-commerce platforms will further fuel expansion, enabling businesses to broaden their reach. Strategic success will depend on addressing logistical hurdles, fostering consumer trust, and adapting to diverse regional preferences. Continued investment in infrastructure, technology, and regulatory frameworks is vital for maintaining the market's impressive growth trajectory.
Southeast Asia Cross-border E-commerce Market Company Market Share
Southeast Asia Cross-border E-commerce Market: A Comprehensive Report (2019-2033)
This in-depth report provides a comprehensive analysis of the Southeast Asia cross-border e-commerce market, covering market dynamics, growth trends, key players, and future opportunities. With a focus on B2B and B2C segments across key product categories and countries, this report is an essential resource for businesses, investors, and industry professionals seeking to understand and capitalize on this rapidly expanding market. The study period spans from 2019 to 2033, with 2025 as the base and estimated year. The forecast period is 2025-2033, and the historical period is 2019-2024.
Southeast Asia Cross-border E-commerce Market Dynamics & Structure
This section analyzes the market's competitive landscape, technological advancements, regulatory environment, and consumer trends. We delve into market concentration, identifying key players and their market share, and exploring the impact of mergers and acquisitions (M&A) activities. The report also examines the influence of technological innovations, regulatory frameworks (including cross-border trade agreements), the presence of competitive product substitutes, and the evolving demographics of end-users on market growth.
- Market Concentration: The Southeast Asian cross-border e-commerce market exhibits a moderately concentrated structure, with a few dominant players capturing a significant share. The market share for the top 5 players is estimated at xx% in 2025.
- Technological Innovation: The market is characterized by rapid technological advancements, including improvements in logistics, payment gateways, and mobile commerce. However, challenges remain in areas like digital literacy and infrastructure development in certain regions.
- Regulatory Frameworks: Varying regulatory landscapes across Southeast Asian nations present both opportunities and challenges for cross-border e-commerce businesses. Harmonization of regulations is crucial for facilitating smoother cross-border trade.
- M&A Activity: The number of M&A deals in the Southeast Asia cross-border e-commerce sector has increased significantly in recent years, driven by both consolidation and expansion strategies. An estimated xx M&A deals occurred between 2019 and 2024.
Southeast Asia Cross-border E-commerce Market Growth Trends & Insights
This section provides a detailed analysis of the market's historical and projected growth, examining factors driving adoption rates and exploring the evolution of consumer behavior. The analysis leverages extensive market research and data, examining key metrics such as Compound Annual Growth Rate (CAGR), market penetration, and technological disruptions to project future growth and highlight potential areas of expansion.
The Southeast Asian cross-border e-commerce market has experienced significant growth over the past few years, driven by increasing internet and smartphone penetration, rising disposable incomes, and a growing preference for online shopping. The market size is projected to reach xx million units by 2025 and xx million units by 2033, exhibiting a CAGR of xx% during the forecast period. This growth is further fueled by advancements in logistics and payment infrastructure, alongside increasing consumer trust in online platforms. Key shifts in consumer behavior include a growing preference for mobile commerce and the increasing adoption of digital payment methods. Significant technological disruptions, such as the rise of social commerce and the integration of artificial intelligence, further accelerate market growth.
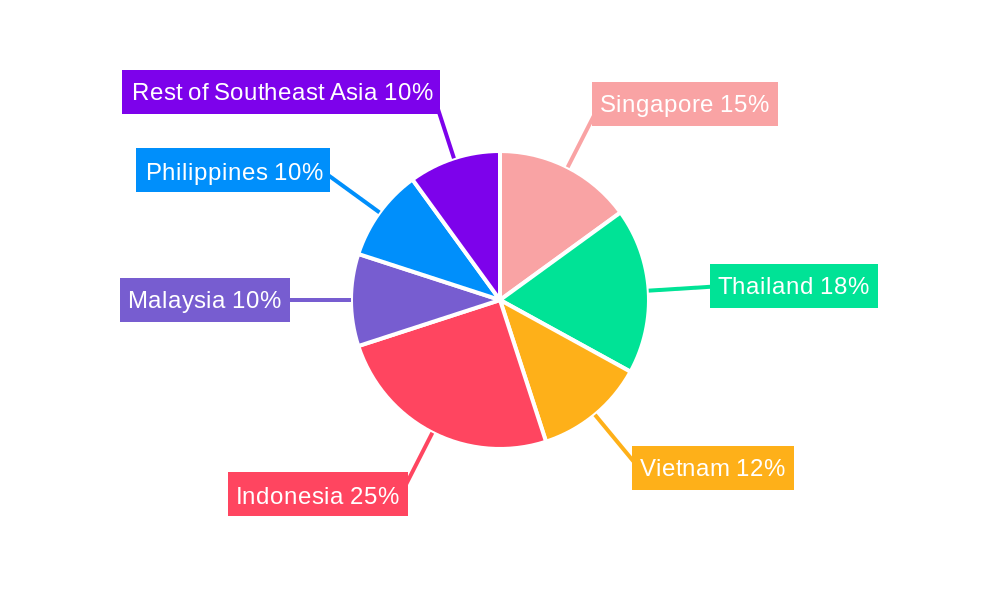
Dominant Regions, Countries, or Segments in Southeast Asia Cross-border E-commerce Market
This section pinpoints the leading regions, countries, and segments within the Southeast Asia cross-border e-commerce market based on business type (B2B, B2C), product category (Fashion and Apparel, Consumer Electronics, Home Appliances, Furniture, Beauty and Personal Care Products, Other Products), and country-specific performance (Singapore, Thailand, Vietnam, Indonesia, Malaysia, Philippines, Rest of South East Asia). We examine the key drivers behind their dominance, including economic policies, infrastructure development, and consumer preferences.
- By Business: The B2C segment currently dominates, but B2B is showing significant growth potential.
- By Product: Fashion and apparel, consumer electronics, and beauty and personal care products are leading product categories.
- By Country: Indonesia, followed by Thailand and Vietnam, are projected to be the largest markets in terms of revenue during the forecast period, driven by factors such as large populations, rising middle class, and increasing smartphone penetration.
Indonesia's dominance is attributed to:
- A large and rapidly growing population.
- Increasing smartphone and internet penetration.
- A burgeoning middle class with rising disposable incomes.
- Government initiatives to promote digital economy growth.
Southeast Asia Cross-border E-commerce Market Product Landscape
The Southeast Asia cross-border e-commerce market showcases a diverse product landscape, characterized by constant innovation and adaptation to consumer preferences. Products range from fashion and apparel to electronics and home goods, with a notable emphasis on personalized experiences and improved delivery services. Technological advancements such as augmented reality (AR) and virtual reality (VR) are increasingly integrated into product presentation and shopping experiences, enhancing customer engagement and boosting sales. The market is witnessing the emergence of innovative solutions, including personalized product recommendations and seamless cross-border payment options. These advancements not only enhance the shopping experience but also contribute to the market's overall growth trajectory.
Key Drivers, Barriers & Challenges in Southeast Asia Cross-border E-commerce Market
Key Drivers:
- Increasing internet and smartphone penetration.
- Rising disposable incomes and a growing middle class.
- Favorable government policies and initiatives supporting the digital economy.
- Advancements in logistics and payment infrastructure.
Key Challenges & Restraints:
- Varying levels of internet infrastructure and digital literacy across the region.
- Complex and fragmented regulatory environments.
- Concerns about cross-border payment security and fraud.
- Intense competition among established and emerging players. This competitive pressure creates a situation where market share is continuously contested. An estimated xx% market share fluctuation was observed between 2020 and 2024.
Emerging Opportunities in Southeast Asia Cross-border E-commerce Market
- Untapped markets in rural areas: Significant growth potential exists in expanding into underserved regions where internet access is rapidly increasing, offering a fresh customer base.
- Growth of mobile commerce: Capitalizing on the mobile-first behavior of the Southeast Asian population is paramount, with a focus on optimizing user experiences for smartphones and tablets.
- Focus on personalized shopping experiences: Employing advanced data analytics to understand individual customer preferences allows for the delivery of highly tailored product recommendations, promotions, and personalized marketing campaigns.
- Adoption of innovative technologies: Integrating cutting-edge technologies such as Augmented Reality (AR) and Virtual Reality (VR) for immersive product previews, AI-powered chatbots for instant customer support, and sophisticated recommendation engines can dramatically enhance customer engagement and conversion rates.
Growth Accelerators in the Southeast Asia Cross-border E-commerce Market Industry
The long-term trajectory of the Southeast Asia cross-border e-commerce market is significantly propelled by several key drivers. Technological advancements, particularly in areas like artificial intelligence (AI) for smart logistics and personalized marketing, and blockchain for secure and transparent payment and supply chain management, are instrumental in driving efficiency and building trust. The formation of strategic alliances between e-commerce giants, specialized logistics partners, and fintech companies is crucial for creating a seamless and frictionless cross-border transaction experience. Furthermore, proactive market expansion strategies that include substantial investments in local infrastructure development, localized content, and culturally relevant marketing campaigns are vital for fostering accessibility and cultivating consumer confidence. The burgeoning middle class, coupled with the ever-increasing penetration of smartphones across the region, provides a robust and expanding customer base, solidifying the market's long-term growth potential.
Key Players Shaping the Southeast Asia Cross-border E-commerce Market Market
- AliExpress
- Shopify Inc
- JD.com Inc
- DIYTrade.com
- Shopee
- Lazada
- ChinaAseanTrade.com
- Bukalapak
- Amazon.com Inc
- Qoo
- eBay Inc
- Tokopedia
- Alibaba Group Holding Limited
- List Not Exhaustive
Notable Milestones in Southeast Asia Cross-border E-commerce Market Sector
- September 2022: Akulaku partners with Alipay+, enabling Indonesian consumers to use Akulaku PayLater at Alipay+ merchants. This significantly expands payment options for Indonesian consumers engaging in cross-border e-commerce.
- February 2022: Razorpay expands into Southeast Asia, acquiring Curlec, a Malaysian fintech firm specializing in recurring payment solutions. This acquisition strengthens Razorpay's presence and capabilities in the region, improving payment processing capabilities for businesses.
In-Depth Southeast Asia Cross-border E-commerce Market Market Outlook
The outlook for the Southeast Asia cross-border e-commerce market is exceptionally promising, characterized by sustained and dynamic growth. Factors such as the continuous rise in internet and smartphone penetration, coupled with the expanding disposable incomes of consumers and the implementation of supportive government initiatives and trade agreements, are set to drive significant market expansion. Technological innovations, particularly advancements in AI for optimized logistics, personalized customer engagement, and enhanced data security, alongside the development of more efficient and reliable cross-border payment solutions, will further streamline operations and unlock new avenues for growth. The strategic consolidation and collaboration between leading e-commerce platforms, sophisticated logistics networks, and innovative financial technology providers will fortify the entire market ecosystem, making it more robust and accessible. The strategic penetration into previously underserved or emerging markets presents substantial opportunities for increased market share and deeper customer engagement. Collectively, these converging trends paint a picture of a vibrant, expansive, and highly lucrative future for the cross-border e-commerce sector in Southeast Asia.
Southeast Asia Cross-border E-commerce Market Segmentation
-
1. Business
- 1.1. B2B
- 1.2. B2C
-
2. Product
- 2.1. Fashion and Apparel
- 2.2. Consumer Electronics
- 2.3. Home Appliances
- 2.4. Furniture
- 2.5. Beauty and Personal Care Products
- 2.6. Other Products (Toys, Food Products, etc.)
Southeast Asia Cross-border E-commerce Market Segmentation By Geography
-
1. North America
- 1.1. United States
- 1.2. Canada
- 1.3. Mexico
-
2. South America
- 2.1. Brazil
- 2.2. Argentina
- 2.3. Rest of South America
-
3. Europe
- 3.1. United Kingdom
- 3.2. Germany
- 3.3. France
- 3.4. Italy
- 3.5. Spain
- 3.6. Russia
- 3.7. Benelux
- 3.8. Nordics
- 3.9. Rest of Europe
-
4. Middle East & Africa
- 4.1. Turkey
- 4.2. Israel
- 4.3. GCC
- 4.4. North Africa
- 4.5. South Africa
- 4.6. Rest of Middle East & Africa
-
5. Asia Pacific
- 5.1. China
- 5.2. India
- 5.3. Japan
- 5.4. South Korea
- 5.5. ASEAN
- 5.6. Oceania
- 5.7. Rest of Asia Pacific
Southeast Asia Cross-border E-commerce Market Regional Market Share
Geographic Coverage of Southeast Asia Cross-border E-commerce Market
Southeast Asia Cross-border E-commerce Market REPORT HIGHLIGHTS
| Aspects | Details |
|---|---|
| Study Period | 2020-2034 |
| Base Year | 2025 |
| Estimated Year | 2026 |
| Forecast Period | 2026-2034 |
| Historical Period | 2020-2025 |
| Growth Rate | CAGR of 21.13% from 2020-2034 |
| Segmentation |
|
Table of Contents
- 1. Introduction
- 1.1. Research Scope
- 1.2. Market Segmentation
- 1.3. Research Objective
- 1.4. Definitions and Assumptions
- 2. Executive Summary
- 2.1. Market Snapshot
- 3. Market Dynamics
- 3.1. Market Drivers
- 3.2. Market Restrains
- 3.3. Market Trends
- 3.4. Market Opportunities
- 4. Market Factor Analysis
- 4.1. Porters Five Forces
- 4.1.1. Bargaining Power of Suppliers
- 4.1.2. Bargaining Power of Buyers
- 4.1.3. Threat of New Entrants
- 4.1.4. Threat of Substitutes
- 4.1.5. Competitive Rivalry
- 4.2. PESTEL analysis
- 4.3. BCG Analysis
- 4.3.1. Stars (High Growth, High Market Share)
- 4.3.2. Cash Cows (Low Growth, High Market Share)
- 4.3.3. Question Mark (High Growth, Low Market Share)
- 4.3.4. Dogs (Low Growth, Low Market Share)
- 4.4. Ansoff Matrix Analysis
- 4.5. Supply Chain Analysis
- 4.6. Regulatory Landscape
- 4.7. Current Market Potential and Opportunity Assessment (TAM–SAM–SOM Framework)
- 4.8. IMR Analyst Note
- 4.1. Porters Five Forces
- 5. Market Analysis, Insights and Forecast 2021-2033
- 5.1. Market Analysis, Insights and Forecast - by Business
- 5.1.1. B2B
- 5.1.2. B2C
- 5.2. Market Analysis, Insights and Forecast - by Product
- 5.2.1. Fashion and Apparel
- 5.2.2. Consumer Electronics
- 5.2.3. Home Appliances
- 5.2.4. Furniture
- 5.2.5. Beauty and Personal Care Products
- 5.2.6. Other Products (Toys, Food Products, etc.)
- 5.3. Market Analysis, Insights and Forecast - by Region
- 5.3.1. North America
- 5.3.2. South America
- 5.3.3. Europe
- 5.3.4. Middle East & Africa
- 5.3.5. Asia Pacific
- 5.1. Market Analysis, Insights and Forecast - by Business
- 6. Global Southeast Asia Cross-border E-commerce Market Analysis, Insights and Forecast, 2021-2033
- 6.1. Market Analysis, Insights and Forecast - by Business
- 6.1.1. B2B
- 6.1.2. B2C
- 6.2. Market Analysis, Insights and Forecast - by Product
- 6.2.1. Fashion and Apparel
- 6.2.2. Consumer Electronics
- 6.2.3. Home Appliances
- 6.2.4. Furniture
- 6.2.5. Beauty and Personal Care Products
- 6.2.6. Other Products (Toys, Food Products, etc.)
- 6.1. Market Analysis, Insights and Forecast - by Business
- 7. North America Southeast Asia Cross-border E-commerce Market Analysis, Insights and Forecast, 2020-2032
- 7.1. Market Analysis, Insights and Forecast - by Business
- 7.1.1. B2B
- 7.1.2. B2C
- 7.2. Market Analysis, Insights and Forecast - by Product
- 7.2.1. Fashion and Apparel
- 7.2.2. Consumer Electronics
- 7.2.3. Home Appliances
- 7.2.4. Furniture
- 7.2.5. Beauty and Personal Care Products
- 7.2.6. Other Products (Toys, Food Products, etc.)
- 7.1. Market Analysis, Insights and Forecast - by Business
- 8. South America Southeast Asia Cross-border E-commerce Market Analysis, Insights and Forecast, 2020-2032
- 8.1. Market Analysis, Insights and Forecast - by Business
- 8.1.1. B2B
- 8.1.2. B2C
- 8.2. Market Analysis, Insights and Forecast - by Product
- 8.2.1. Fashion and Apparel
- 8.2.2. Consumer Electronics
- 8.2.3. Home Appliances
- 8.2.4. Furniture
- 8.2.5. Beauty and Personal Care Products
- 8.2.6. Other Products (Toys, Food Products, etc.)
- 8.1. Market Analysis, Insights and Forecast - by Business
- 9. Europe Southeast Asia Cross-border E-commerce Market Analysis, Insights and Forecast, 2020-2032
- 9.1. Market Analysis, Insights and Forecast - by Business
- 9.1.1. B2B
- 9.1.2. B2C
- 9.2. Market Analysis, Insights and Forecast - by Product
- 9.2.1. Fashion and Apparel
- 9.2.2. Consumer Electronics
- 9.2.3. Home Appliances
- 9.2.4. Furniture
- 9.2.5. Beauty and Personal Care Products
- 9.2.6. Other Products (Toys, Food Products, etc.)
- 9.1. Market Analysis, Insights and Forecast - by Business
- 10. Middle East & Africa Southeast Asia Cross-border E-commerce Market Analysis, Insights and Forecast, 2020-2032
- 10.1. Market Analysis, Insights and Forecast - by Business
- 10.1.1. B2B
- 10.1.2. B2C
- 10.2. Market Analysis, Insights and Forecast - by Product
- 10.2.1. Fashion and Apparel
- 10.2.2. Consumer Electronics
- 10.2.3. Home Appliances
- 10.2.4. Furniture
- 10.2.5. Beauty and Personal Care Products
- 10.2.6. Other Products (Toys, Food Products, etc.)
- 10.1. Market Analysis, Insights and Forecast - by Business
- 11. Asia Pacific Southeast Asia Cross-border E-commerce Market Analysis, Insights and Forecast, 2020-2032
- 11.1. Market Analysis, Insights and Forecast - by Business
- 11.1.1. B2B
- 11.1.2. B2C
- 11.2. Market Analysis, Insights and Forecast - by Product
- 11.2.1. Fashion and Apparel
- 11.2.2. Consumer Electronics
- 11.2.3. Home Appliances
- 11.2.4. Furniture
- 11.2.5. Beauty and Personal Care Products
- 11.2.6. Other Products (Toys, Food Products, etc.)
- 11.1. Market Analysis, Insights and Forecast - by Business
- 12. Competitive Analysis
- 12.1. Company Profiles
- 12.1.1 AliExpress
- 12.1.1.1. Company Overview
- 12.1.1.2. Products
- 12.1.1.3. Company Financials
- 12.1.1.4. SWOT Analysis
- 12.1.2 Shopify Inc
- 12.1.2.1. Company Overview
- 12.1.2.2. Products
- 12.1.2.3. Company Financials
- 12.1.2.4. SWOT Analysis
- 12.1.3 JD com Inc
- 12.1.3.1. Company Overview
- 12.1.3.2. Products
- 12.1.3.3. Company Financials
- 12.1.3.4. SWOT Analysis
- 12.1.4 DIYTrade com
- 12.1.4.1. Company Overview
- 12.1.4.2. Products
- 12.1.4.3. Company Financials
- 12.1.4.4. SWOT Analysis
- 12.1.5 Shoppee
- 12.1.5.1. Company Overview
- 12.1.5.2. Products
- 12.1.5.3. Company Financials
- 12.1.5.4. SWOT Analysis
- 12.1.6 Lazada
- 12.1.6.1. Company Overview
- 12.1.6.2. Products
- 12.1.6.3. Company Financials
- 12.1.6.4. SWOT Analysis
- 12.1.7 ChinaAseanTrade com
- 12.1.7.1. Company Overview
- 12.1.7.2. Products
- 12.1.7.3. Company Financials
- 12.1.7.4. SWOT Analysis
- 12.1.8 Bukalapak
- 12.1.8.1. Company Overview
- 12.1.8.2. Products
- 12.1.8.3. Company Financials
- 12.1.8.4. SWOT Analysis
- 12.1.9 Amazon com Inc
- 12.1.9.1. Company Overview
- 12.1.9.2. Products
- 12.1.9.3. Company Financials
- 12.1.9.4. SWOT Analysis
- 12.1.10 Qoo
- 12.1.10.1. Company Overview
- 12.1.10.2. Products
- 12.1.10.3. Company Financials
- 12.1.10.4. SWOT Analysis
- 12.1.11 eBay Inc
- 12.1.11.1. Company Overview
- 12.1.11.2. Products
- 12.1.11.3. Company Financials
- 12.1.11.4. SWOT Analysis
- 12.1.12 Tokopedia
- 12.1.12.1. Company Overview
- 12.1.12.2. Products
- 12.1.12.3. Company Financials
- 12.1.12.4. SWOT Analysis
- 12.1.13 Alibaba Group Holding Limited **List Not Exhaustive
- 12.1.13.1. Company Overview
- 12.1.13.2. Products
- 12.1.13.3. Company Financials
- 12.1.13.4. SWOT Analysis
- 12.1.1 AliExpress
- 12.2. Market Entropy
- 12.2.1 Company's Key Areas Served
- 12.2.2 Recent Developments
- 12.3. Company Market Share Analysis 2025
- 12.3.1 Top 5 Companies Market Share Analysis
- 12.3.2 Top 3 Companies Market Share Analysis
- 12.4. List of Potential Customers
- 13. Research Methodology
List of Figures
- Figure 1: Global Southeast Asia Cross-border E-commerce Market Revenue Breakdown (billion, %) by Region 2025 & 2033
- Figure 2: North America Southeast Asia Cross-border E-commerce Market Revenue (billion), by Business 2025 & 2033
- Figure 3: North America Southeast Asia Cross-border E-commerce Market Revenue Share (%), by Business 2025 & 2033
- Figure 4: North America Southeast Asia Cross-border E-commerce Market Revenue (billion), by Product 2025 & 2033
- Figure 5: North America Southeast Asia Cross-border E-commerce Market Revenue Share (%), by Product 2025 & 2033
- Figure 6: North America Southeast Asia Cross-border E-commerce Market Revenue (billion), by Country 2025 & 2033
- Figure 7: North America Southeast Asia Cross-border E-commerce Market Revenue Share (%), by Country 2025 & 2033
- Figure 8: South America Southeast Asia Cross-border E-commerce Market Revenue (billion), by Business 2025 & 2033
- Figure 9: South America Southeast Asia Cross-border E-commerce Market Revenue Share (%), by Business 2025 & 2033
- Figure 10: South America Southeast Asia Cross-border E-commerce Market Revenue (billion), by Product 2025 & 2033
- Figure 11: South America Southeast Asia Cross-border E-commerce Market Revenue Share (%), by Product 2025 & 2033
- Figure 12: South America Southeast Asia Cross-border E-commerce Market Revenue (billion), by Country 2025 & 2033
- Figure 13: South America Southeast Asia Cross-border E-commerce Market Revenue Share (%), by Country 2025 & 2033
- Figure 14: Europe Southeast Asia Cross-border E-commerce Market Revenue (billion), by Business 2025 & 2033
- Figure 15: Europe Southeast Asia Cross-border E-commerce Market Revenue Share (%), by Business 2025 & 2033
- Figure 16: Europe Southeast Asia Cross-border E-commerce Market Revenue (billion), by Product 2025 & 2033
- Figure 17: Europe Southeast Asia Cross-border E-commerce Market Revenue Share (%), by Product 2025 & 2033
- Figure 18: Europe Southeast Asia Cross-border E-commerce Market Revenue (billion), by Country 2025 & 2033
- Figure 19: Europe Southeast Asia Cross-border E-commerce Market Revenue Share (%), by Country 2025 & 2033
- Figure 20: Middle East & Africa Southeast Asia Cross-border E-commerce Market Revenue (billion), by Business 2025 & 2033
- Figure 21: Middle East & Africa Southeast Asia Cross-border E-commerce Market Revenue Share (%), by Business 2025 & 2033
- Figure 22: Middle East & Africa Southeast Asia Cross-border E-commerce Market Revenue (billion), by Product 2025 & 2033
- Figure 23: Middle East & Africa Southeast Asia Cross-border E-commerce Market Revenue Share (%), by Product 2025 & 2033
- Figure 24: Middle East & Africa Southeast Asia Cross-border E-commerce Market Revenue (billion), by Country 2025 & 2033
- Figure 25: Middle East & Africa Southeast Asia Cross-border E-commerce Market Revenue Share (%), by Country 2025 & 2033
- Figure 26: Asia Pacific Southeast Asia Cross-border E-commerce Market Revenue (billion), by Business 2025 & 2033
- Figure 27: Asia Pacific Southeast Asia Cross-border E-commerce Market Revenue Share (%), by Business 2025 & 2033
- Figure 28: Asia Pacific Southeast Asia Cross-border E-commerce Market Revenue (billion), by Product 2025 & 2033
- Figure 29: Asia Pacific Southeast Asia Cross-border E-commerce Market Revenue Share (%), by Product 2025 & 2033
- Figure 30: Asia Pacific Southeast Asia Cross-border E-commerce Market Revenue (billion), by Country 2025 & 2033
- Figure 31: Asia Pacific Southeast Asia Cross-border E-commerce Market Revenue Share (%), by Country 2025 & 2033
List of Tables
- Table 1: Global Southeast Asia Cross-border E-commerce Market Revenue billion Forecast, by Business 2020 & 2033
- Table 2: Global Southeast Asia Cross-border E-commerce Market Revenue billion Forecast, by Product 2020 & 2033
- Table 3: Global Southeast Asia Cross-border E-commerce Market Revenue billion Forecast, by Region 2020 & 2033
- Table 4: Global Southeast Asia Cross-border E-commerce Market Revenue billion Forecast, by Business 2020 & 2033
- Table 5: Global Southeast Asia Cross-border E-commerce Market Revenue billion Forecast, by Product 2020 & 2033
- Table 6: Global Southeast Asia Cross-border E-commerce Market Revenue billion Forecast, by Country 2020 & 2033
- Table 7: United States Southeast Asia Cross-border E-commerce Market Revenue (billion) Forecast, by Application 2020 & 2033
- Table 8: Canada Southeast Asia Cross-border E-commerce Market Revenue (billion) Forecast, by Application 2020 & 2033
- Table 9: Mexico Southeast Asia Cross-border E-commerce Market Revenue (billion) Forecast, by Application 2020 & 2033
- Table 10: Global Southeast Asia Cross-border E-commerce Market Revenue billion Forecast, by Business 2020 & 2033
- Table 11: Global Southeast Asia Cross-border E-commerce Market Revenue billion Forecast, by Product 2020 & 2033
- Table 12: Global Southeast Asia Cross-border E-commerce Market Revenue billion Forecast, by Country 2020 & 2033
- Table 13: Brazil Southeast Asia Cross-border E-commerce Market Revenue (billion) Forecast, by Application 2020 & 2033
- Table 14: Argentina Southeast Asia Cross-border E-commerce Market Revenue (billion) Forecast, by Application 2020 & 2033
- Table 15: Rest of South America Southeast Asia Cross-border E-commerce Market Revenue (billion) Forecast, by Application 2020 & 2033
- Table 16: Global Southeast Asia Cross-border E-commerce Market Revenue billion Forecast, by Business 2020 & 2033
- Table 17: Global Southeast Asia Cross-border E-commerce Market Revenue billion Forecast, by Product 2020 & 2033
- Table 18: Global Southeast Asia Cross-border E-commerce Market Revenue billion Forecast, by Country 2020 & 2033
- Table 19: United Kingdom Southeast Asia Cross-border E-commerce Market Revenue (billion) Forecast, by Application 2020 & 2033
- Table 20: Germany Southeast Asia Cross-border E-commerce Market Revenue (billion) Forecast, by Application 2020 & 2033
- Table 21: France Southeast Asia Cross-border E-commerce Market Revenue (billion) Forecast, by Application 2020 & 2033
- Table 22: Italy Southeast Asia Cross-border E-commerce Market Revenue (billion) Forecast, by Application 2020 & 2033
- Table 23: Spain Southeast Asia Cross-border E-commerce Market Revenue (billion) Forecast, by Application 2020 & 2033
- Table 24: Russia Southeast Asia Cross-border E-commerce Market Revenue (billion) Forecast, by Application 2020 & 2033
- Table 25: Benelux Southeast Asia Cross-border E-commerce Market Revenue (billion) Forecast, by Application 2020 & 2033
- Table 26: Nordics Southeast Asia Cross-border E-commerce Market Revenue (billion) Forecast, by Application 2020 & 2033
- Table 27: Rest of Europe Southeast Asia Cross-border E-commerce Market Revenue (billion) Forecast, by Application 2020 & 2033
- Table 28: Global Southeast Asia Cross-border E-commerce Market Revenue billion Forecast, by Business 2020 & 2033
- Table 29: Global Southeast Asia Cross-border E-commerce Market Revenue billion Forecast, by Product 2020 & 2033
- Table 30: Global Southeast Asia Cross-border E-commerce Market Revenue billion Forecast, by Country 2020 & 2033
- Table 31: Turkey Southeast Asia Cross-border E-commerce Market Revenue (billion) Forecast, by Application 2020 & 2033
- Table 32: Israel Southeast Asia Cross-border E-commerce Market Revenue (billion) Forecast, by Application 2020 & 2033
- Table 33: GCC Southeast Asia Cross-border E-commerce Market Revenue (billion) Forecast, by Application 2020 & 2033
- Table 34: North Africa Southeast Asia Cross-border E-commerce Market Revenue (billion) Forecast, by Application 2020 & 2033
- Table 35: South Africa Southeast Asia Cross-border E-commerce Market Revenue (billion) Forecast, by Application 2020 & 2033
- Table 36: Rest of Middle East & Africa Southeast Asia Cross-border E-commerce Market Revenue (billion) Forecast, by Application 2020 & 2033
- Table 37: Global Southeast Asia Cross-border E-commerce Market Revenue billion Forecast, by Business 2020 & 2033
- Table 38: Global Southeast Asia Cross-border E-commerce Market Revenue billion Forecast, by Product 2020 & 2033
- Table 39: Global Southeast Asia Cross-border E-commerce Market Revenue billion Forecast, by Country 2020 & 2033
- Table 40: China Southeast Asia Cross-border E-commerce Market Revenue (billion) Forecast, by Application 2020 & 2033
- Table 41: India Southeast Asia Cross-border E-commerce Market Revenue (billion) Forecast, by Application 2020 & 2033
- Table 42: Japan Southeast Asia Cross-border E-commerce Market Revenue (billion) Forecast, by Application 2020 & 2033
- Table 43: South Korea Southeast Asia Cross-border E-commerce Market Revenue (billion) Forecast, by Application 2020 & 2033
- Table 44: ASEAN Southeast Asia Cross-border E-commerce Market Revenue (billion) Forecast, by Application 2020 & 2033
- Table 45: Oceania Southeast Asia Cross-border E-commerce Market Revenue (billion) Forecast, by Application 2020 & 2033
- Table 46: Rest of Asia Pacific Southeast Asia Cross-border E-commerce Market Revenue (billion) Forecast, by Application 2020 & 2033
Frequently Asked Questions
1. What is the projected Compound Annual Growth Rate (CAGR) of the Southeast Asia Cross-border E-commerce Market?
The projected CAGR is approximately 21.13%.
2. Which companies are prominent players in the Southeast Asia Cross-border E-commerce Market?
Key companies in the market include AliExpress, Shopify Inc, JD com Inc, DIYTrade com, Shoppee, Lazada, ChinaAseanTrade com, Bukalapak, Amazon com Inc, Qoo, eBay Inc, Tokopedia, Alibaba Group Holding Limited **List Not Exhaustive.
3. What are the main segments of the Southeast Asia Cross-border E-commerce Market?
The market segments include Business, Product.
4. Can you provide details about the market size?
The market size is estimated to be USD 201.92 billion as of 2022.
5. What are some drivers contributing to market growth?
4.; Increasing International Trade Driving the Market4.; Increasing online users driving the market.
6. What are the notable trends driving market growth?
Growth in E-commerce sector in the region driving the market.
7. Are there any restraints impacting market growth?
4.; Regulatory Compliance Affecting the Market4.; High Competition in the Market.
8. Can you provide examples of recent developments in the market?
September 2022: Akulaku, a leading Southeast Asian banking and digital finance platform announced a partnership with Alipay+ that will allow Indonesian consumers to use its BNPL solution Akulaku PayLater at Alipay+'s global merchants. Alipay+, a suite of global cross-border digital payments and marketing solutions, will now support Akulaku PayLater, and merchants will be able to accept Akulaku PayLater as a payment method.
9. What pricing options are available for accessing the report?
Pricing options include single-user, multi-user, and enterprise licenses priced at USD 4750, USD 4950, and USD 6800 respectively.
10. Is the market size provided in terms of value or volume?
The market size is provided in terms of value, measured in billion.
11. Are there any specific market keywords associated with the report?
Yes, the market keyword associated with the report is "Southeast Asia Cross-border E-commerce Market," which aids in identifying and referencing the specific market segment covered.
12. How do I determine which pricing option suits my needs best?
The pricing options vary based on user requirements and access needs. Individual users may opt for single-user licenses, while businesses requiring broader access may choose multi-user or enterprise licenses for cost-effective access to the report.
13. Are there any additional resources or data provided in the Southeast Asia Cross-border E-commerce Market report?
While the report offers comprehensive insights, it's advisable to review the specific contents or supplementary materials provided to ascertain if additional resources or data are available.
14. How can I stay updated on further developments or reports in the Southeast Asia Cross-border E-commerce Market?
To stay informed about further developments, trends, and reports in the Southeast Asia Cross-border E-commerce Market, consider subscribing to industry newsletters, following relevant companies and organizations, or regularly checking reputable industry news sources and publications.
Methodology
Step 1 - Identification of Relevant Samples Size from Population Database


Step 2 - Approaches for Defining Global Market Size (Value, Volume* & Price*)

Note*: In applicable scenarios
Step 3 - Data Sources
Primary Research
- Web Analytics
- Survey Reports
- Research Institute
- Latest Research Reports
- Opinion Leaders
Secondary Research
- Annual Reports
- White Paper
- Latest Press Release
- Industry Association
- Paid Database
- Investor Presentations

Step 4 - Data Triangulation
Involves using different sources of information in order to increase the validity of a study
These sources are likely to be stakeholders in a program - participants, other researchers, program staff, other community members, and so on.
Then we put all data in single framework & apply various statistical tools to find out the dynamic on the market.
During the analysis stage, feedback from the stakeholder groups would be compared to determine areas of agreement as well as areas of divergence