

Key Insights
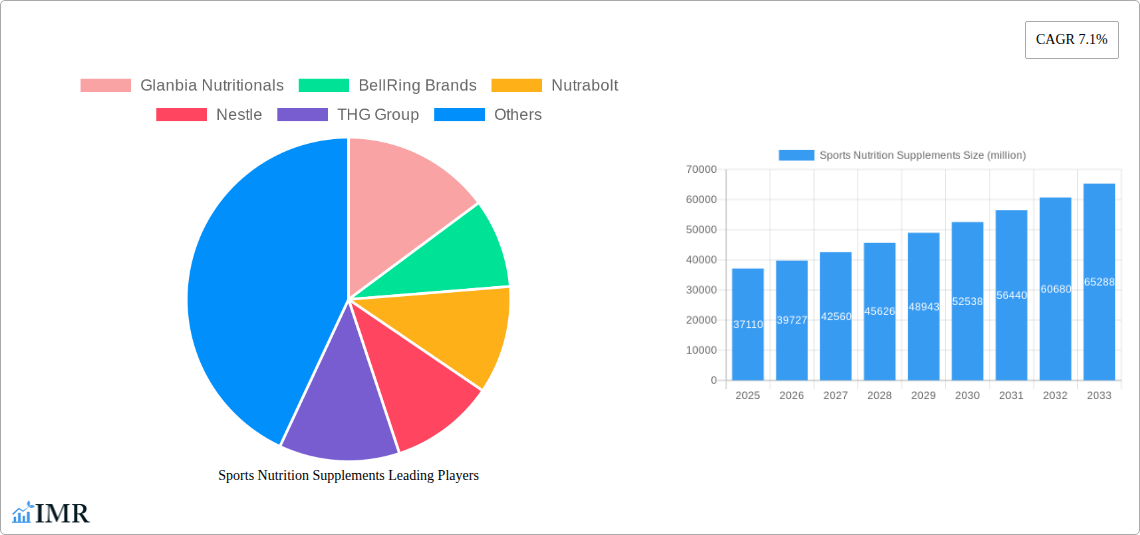
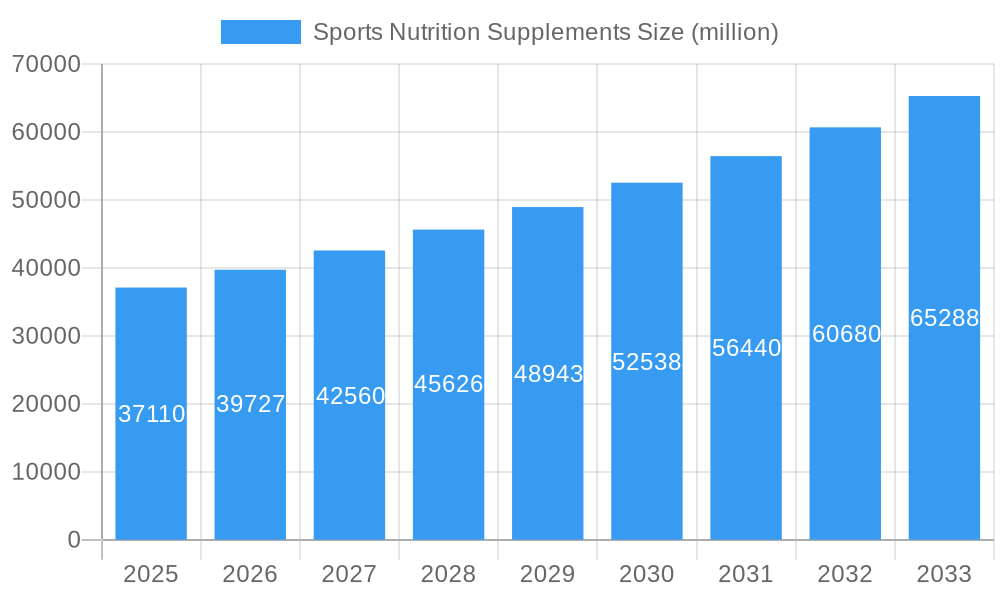
The global sports nutrition supplements market, valued at $37.11 billion in 2025, is projected to experience robust growth, driven by several key factors. The rising global prevalence of fitness and wellness trends, coupled with increasing participation in athletic activities across diverse demographics, fuels significant demand for performance-enhancing supplements. Consumers are increasingly seeking natural and functional ingredients, contributing to the popularity of plant-based protein powders, functional beverages, and specialized supplements targeting specific fitness goals. This demand is further amplified by the growing awareness of the benefits of protein and essential nutrients for muscle recovery, strength building, and overall health and well-being. The market is witnessing innovation in product formats, delivery systems, and ingredient formulations, with a growing emphasis on personalized nutrition strategies catering to individual athletic needs. This trend is supported by expanding research demonstrating the efficacy of specific nutrient combinations for optimizing athletic performance.
Sports Nutrition Supplements Market Size (In Billion)
However, challenges remain. Concerns surrounding the safety and efficacy of certain supplements, coupled with stringent regulatory frameworks, pose hurdles to market expansion. Moreover, fluctuating raw material prices and ingredient sourcing complexities can impact profitability. The competitive landscape is intense, with established multinational corporations and emerging specialized brands vying for market share. Successful players are prioritizing product innovation, building strong brand recognition, and focusing on effective marketing strategies to resonate with target consumer segments. The continued rise of e-commerce provides significant opportunities for direct-to-consumer sales, boosting market accessibility and fostering customer engagement. The market is also segmenting further based on consumer needs, from specific sports like weightlifting or endurance training to individual dietary requirements and health goals. This trend is driving increased product diversification and specialization across the industry.
Sports Nutrition Supplements Company Market Share
Sports Nutrition Supplements Market Report: 2019-2033
This comprehensive report provides an in-depth analysis of the global sports nutrition supplements market, encompassing historical data (2019-2024), the base year (2025), and a detailed forecast (2025-2033). The report delves into market dynamics, growth trends, regional performance, product landscapes, and key players, offering invaluable insights for industry professionals, investors, and strategic decision-makers. The market is segmented by product type (Protein Powders, Energy Drinks, Creatine, etc.) and end-user (Athletes, Fitness Enthusiasts, etc.) The total market value is projected to reach xx million units by 2033.
Sports Nutrition Supplements Market Dynamics & Structure
The sports nutrition supplements market is characterized by moderate concentration, with key players like Glanbia Nutritionals, Nestle, and BellRing Brands holding significant market share. However, the market also features numerous smaller players and emerging brands, leading to intense competition. Technological innovation, particularly in ingredient formulation and delivery systems, is a crucial driver. Stringent regulatory frameworks concerning labeling, safety, and efficacy vary across regions, impacting market entry and growth. The market witnesses constant evolution with M&A activity playing a crucial role in shaping the competitive landscape. Substitute products, such as whole foods, also present competitive challenges.
- Market Concentration: Moderately concentrated, with top 5 players holding approximately xx% market share in 2025.
- Technological Innovation: Focus on personalized nutrition, advanced delivery systems (e.g., liposomal encapsulation), and natural ingredients.
- Regulatory Landscape: Varying regulations across regions create compliance challenges and impact product development.
- Competitive Substitutes: Whole foods, functional foods, and traditional dietary approaches present competitive pressure.
- End-User Demographics: Predominantly driven by health-conscious millennials and Gen Z, with increasing adoption among older demographics.
- M&A Activity: An average of xx M&A deals per year observed during the historical period (2019-2024).
Sports Nutrition Supplements Growth Trends & Insights
The global sports nutrition supplements market experienced robust growth during the historical period (2019-2024), driven by rising health consciousness, increasing participation in fitness activities, and the growing popularity of personalized nutrition. The market is projected to maintain a healthy Compound Annual Growth Rate (CAGR) of xx% during the forecast period (2025-2033). This growth is fueled by technological advancements leading to improved product efficacy and convenience, as well as evolving consumer preferences towards clean label and natural ingredients. Market penetration is increasing, particularly in emerging economies with rising disposable incomes and increased awareness of health and wellness. Disruptive technologies like personalized nutrition plans and direct-to-consumer brands are reshaping the market landscape.
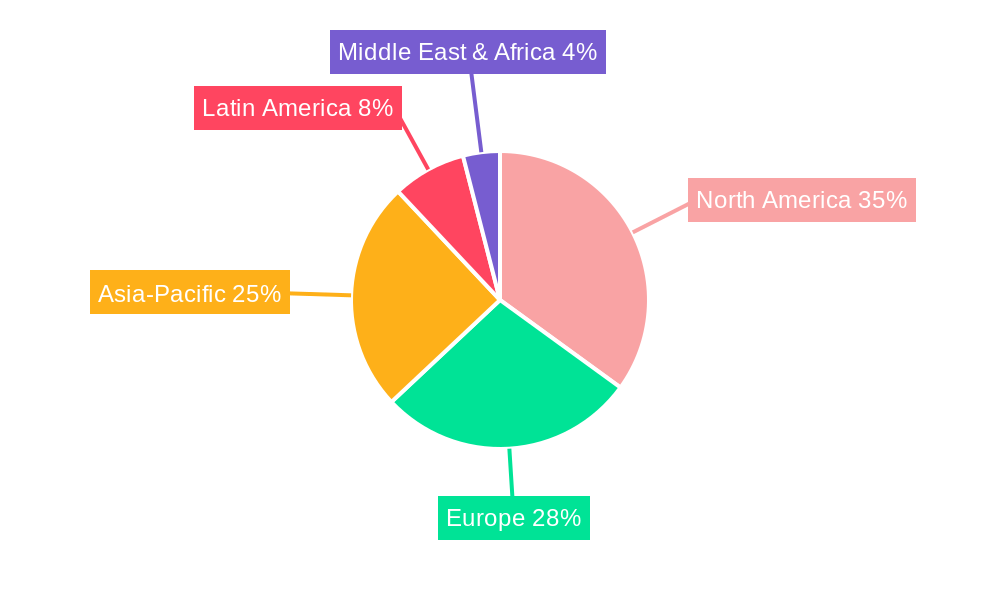
Dominant Regions, Countries, or Segments in Sports Nutrition Supplements
North America currently dominates the global sports nutrition supplements market, driven by high consumer spending on health and fitness, coupled with robust regulatory frameworks supporting innovation. Europe follows as a significant market, with strong growth prospects in Asia-Pacific due to rising disposable incomes and increasing health awareness. Within North America, the U.S. holds the largest share, followed by Canada. The protein powder segment maintains the largest market share due to its established market presence and versatile applications.
- Key Drivers in North America: High disposable incomes, established fitness culture, and strong regulatory support.
- Growth Potential in Asia-Pacific: Rising middle class, increasing health awareness, and growing adoption of western fitness trends.
- Market Share: North America holds approximately xx% market share, followed by Europe at xx% and Asia-Pacific at xx% (2025 estimates).
Sports Nutrition Supplements Product Landscape
The sports nutrition supplements market offers a diverse product landscape, ranging from protein powders and energy bars to creatine supplements and specialized blends catering to specific athletic needs. Continuous product innovation focuses on enhanced bioavailability, improved taste and texture, and the incorporation of functional ingredients. Key selling propositions include convenience, efficacy, and personalized formulations. Technological advancements encompass microencapsulation, liposomal delivery, and the utilization of novel ingredients with demonstrated health benefits.
Key Drivers, Barriers & Challenges in Sports Nutrition Supplements
Key Drivers:
- Rising health consciousness and increased participation in fitness activities.
- Technological advancements resulting in improved product efficacy and convenience.
- Growing adoption of personalized nutrition approaches.
- Increasing disposable incomes in emerging economies.
Key Challenges and Restraints:
- Stringent regulatory frameworks and varying labeling requirements across regions pose significant challenges.
- Concerns regarding product safety and efficacy lead to consumer skepticism.
- Intense competition among established players and emerging brands.
- Supply chain disruptions and raw material price fluctuations affect profitability.
Emerging Opportunities in Sports Nutrition Supplements
- Growing demand for plant-based and vegan supplements.
- Increasing focus on personalized nutrition and customized formulations.
- Expansion into untapped markets in developing countries.
- Development of innovative delivery systems, such as functional foods and beverages.
Growth Accelerators in the Sports Nutrition Supplements Industry
Long-term growth is anticipated to be fueled by continuous innovation in product formulations and delivery systems, strategic partnerships between supplement brands and fitness technology companies, and expansion into new geographical markets. The integration of digital technologies, including personalized fitness apps and online coaching platforms, will further enhance market growth.
Key Players Shaping the Sports Nutrition Supplements Market
- Glanbia Nutritionals
- BellRing Brands
- Nutrabolt
- Nestle
- THG Group
- Herbalife
- Clif Bar
- Abbott Nutrition
- Xiwang Foodstuffs
- CytoSport
- Orgain
- NOW Foods
- Quest Nutrition
- Amway (Nutrilite XS)
- MaxiNutrition(KRÜGER GROUP)
- BPI Sports
- By-Health
- Decathlon
- Science in Sports
- Competitor Sports
Notable Milestones in Sports Nutrition Supplements Sector
- 2020: Launch of several plant-based protein powder lines by major players.
- 2021: Increased M&A activity, consolidation within the market.
- 2022: Introduction of personalized nutrition plans integrated with fitness tracking apps.
- 2023: Focus on sustainability and eco-friendly packaging.
In-Depth Sports Nutrition Supplements Market Outlook
The sports nutrition supplements market presents significant opportunities for sustained growth, driven by continued innovation, evolving consumer preferences, and expansion into new markets. Strategic partnerships, focus on personalized nutrition, and development of innovative products will be key success factors in shaping future market dynamics. The market is expected to witness further consolidation, with larger players acquiring smaller brands to strengthen their market positions.
Sports Nutrition Supplements Segmentation
-
1. Application
- 1.1. Online
- 1.2. Offline
-
2. Type
- 2.1. Protein
- 2.2. Creatine
- 2.3. Amino Acid
- 2.4. Other
Sports Nutrition Supplements Segmentation By Geography
-
1. North America
- 1.1. United States
- 1.2. Canada
- 1.3. Mexico
-
2. South America
- 2.1. Brazil
- 2.2. Argentina
- 2.3. Rest of South America
-
3. Europe
- 3.1. United Kingdom
- 3.2. Germany
- 3.3. France
- 3.4. Italy
- 3.5. Spain
- 3.6. Russia
- 3.7. Benelux
- 3.8. Nordics
- 3.9. Rest of Europe
-
4. Middle East & Africa
- 4.1. Turkey
- 4.2. Israel
- 4.3. GCC
- 4.4. North Africa
- 4.5. South Africa
- 4.6. Rest of Middle East & Africa
-
5. Asia Pacific
- 5.1. China
- 5.2. India
- 5.3. Japan
- 5.4. South Korea
- 5.5. ASEAN
- 5.6. Oceania
- 5.7. Rest of Asia Pacific
Sports Nutrition Supplements Regional Market Share
Geographic Coverage of Sports Nutrition Supplements
Sports Nutrition Supplements REPORT HIGHLIGHTS
| Aspects | Details |
|---|---|
| Study Period | 2020-2034 |
| Base Year | 2025 |
| Estimated Year | 2026 |
| Forecast Period | 2026-2034 |
| Historical Period | 2020-2025 |
| Growth Rate | CAGR of 7.1% from 2020-2034 |
| Segmentation |
|
Table of Contents
- 1. Introduction
- 1.1. Research Scope
- 1.2. Market Segmentation
- 1.3. Research Methodology
- 1.4. Definitions and Assumptions
- 2. Executive Summary
- 2.1. Introduction
- 3. Market Dynamics
- 3.1. Introduction
- 3.2. Market Drivers
- 3.3. Market Restrains
- 3.4. Market Trends
- 4. Market Factor Analysis
- 4.1. Porters Five Forces
- 4.2. Supply/Value Chain
- 4.3. PESTEL analysis
- 4.4. Market Entropy
- 4.5. Patent/Trademark Analysis
- 5. Global Sports Nutrition Supplements Analysis, Insights and Forecast, 2020-2032
- 5.1. Market Analysis, Insights and Forecast - by Application
- 5.1.1. Online
- 5.1.2. Offline
- 5.2. Market Analysis, Insights and Forecast - by Type
- 5.2.1. Protein
- 5.2.2. Creatine
- 5.2.3. Amino Acid
- 5.2.4. Other
- 5.3. Market Analysis, Insights and Forecast - by Region
- 5.3.1. North America
- 5.3.2. South America
- 5.3.3. Europe
- 5.3.4. Middle East & Africa
- 5.3.5. Asia Pacific
- 5.1. Market Analysis, Insights and Forecast - by Application
- 6. North America Sports Nutrition Supplements Analysis, Insights and Forecast, 2020-2032
- 6.1. Market Analysis, Insights and Forecast - by Application
- 6.1.1. Online
- 6.1.2. Offline
- 6.2. Market Analysis, Insights and Forecast - by Type
- 6.2.1. Protein
- 6.2.2. Creatine
- 6.2.3. Amino Acid
- 6.2.4. Other
- 6.1. Market Analysis, Insights and Forecast - by Application
- 7. South America Sports Nutrition Supplements Analysis, Insights and Forecast, 2020-2032
- 7.1. Market Analysis, Insights and Forecast - by Application
- 7.1.1. Online
- 7.1.2. Offline
- 7.2. Market Analysis, Insights and Forecast - by Type
- 7.2.1. Protein
- 7.2.2. Creatine
- 7.2.3. Amino Acid
- 7.2.4. Other
- 7.1. Market Analysis, Insights and Forecast - by Application
- 8. Europe Sports Nutrition Supplements Analysis, Insights and Forecast, 2020-2032
- 8.1. Market Analysis, Insights and Forecast - by Application
- 8.1.1. Online
- 8.1.2. Offline
- 8.2. Market Analysis, Insights and Forecast - by Type
- 8.2.1. Protein
- 8.2.2. Creatine
- 8.2.3. Amino Acid
- 8.2.4. Other
- 8.1. Market Analysis, Insights and Forecast - by Application
- 9. Middle East & Africa Sports Nutrition Supplements Analysis, Insights and Forecast, 2020-2032
- 9.1. Market Analysis, Insights and Forecast - by Application
- 9.1.1. Online
- 9.1.2. Offline
- 9.2. Market Analysis, Insights and Forecast - by Type
- 9.2.1. Protein
- 9.2.2. Creatine
- 9.2.3. Amino Acid
- 9.2.4. Other
- 9.1. Market Analysis, Insights and Forecast - by Application
- 10. Asia Pacific Sports Nutrition Supplements Analysis, Insights and Forecast, 2020-2032
- 10.1. Market Analysis, Insights and Forecast - by Application
- 10.1.1. Online
- 10.1.2. Offline
- 10.2. Market Analysis, Insights and Forecast - by Type
- 10.2.1. Protein
- 10.2.2. Creatine
- 10.2.3. Amino Acid
- 10.2.4. Other
- 10.1. Market Analysis, Insights and Forecast - by Application
- 11. Competitive Analysis
- 11.1. Global Market Share Analysis 2025
- 11.2. Company Profiles
- 11.2.1 Glanbia Nutritionals
- 11.2.1.1. Overview
- 11.2.1.2. Products
- 11.2.1.3. SWOT Analysis
- 11.2.1.4. Recent Developments
- 11.2.1.5. Financials (Based on Availability)
- 11.2.2 BellRing Brands
- 11.2.2.1. Overview
- 11.2.2.2. Products
- 11.2.2.3. SWOT Analysis
- 11.2.2.4. Recent Developments
- 11.2.2.5. Financials (Based on Availability)
- 11.2.3 Nutrabolt
- 11.2.3.1. Overview
- 11.2.3.2. Products
- 11.2.3.3. SWOT Analysis
- 11.2.3.4. Recent Developments
- 11.2.3.5. Financials (Based on Availability)
- 11.2.4 Nestle
- 11.2.4.1. Overview
- 11.2.4.2. Products
- 11.2.4.3. SWOT Analysis
- 11.2.4.4. Recent Developments
- 11.2.4.5. Financials (Based on Availability)
- 11.2.5 THG Group
- 11.2.5.1. Overview
- 11.2.5.2. Products
- 11.2.5.3. SWOT Analysis
- 11.2.5.4. Recent Developments
- 11.2.5.5. Financials (Based on Availability)
- 11.2.6 Herbalife
- 11.2.6.1. Overview
- 11.2.6.2. Products
- 11.2.6.3. SWOT Analysis
- 11.2.6.4. Recent Developments
- 11.2.6.5. Financials (Based on Availability)
- 11.2.7 Clif Bar
- 11.2.7.1. Overview
- 11.2.7.2. Products
- 11.2.7.3. SWOT Analysis
- 11.2.7.4. Recent Developments
- 11.2.7.5. Financials (Based on Availability)
- 11.2.8 Abbott Nutrition
- 11.2.8.1. Overview
- 11.2.8.2. Products
- 11.2.8.3. SWOT Analysis
- 11.2.8.4. Recent Developments
- 11.2.8.5. Financials (Based on Availability)
- 11.2.9 Xiwang Foodstuffs
- 11.2.9.1. Overview
- 11.2.9.2. Products
- 11.2.9.3. SWOT Analysis
- 11.2.9.4. Recent Developments
- 11.2.9.5. Financials (Based on Availability)
- 11.2.10 CytoSport
- 11.2.10.1. Overview
- 11.2.10.2. Products
- 11.2.10.3. SWOT Analysis
- 11.2.10.4. Recent Developments
- 11.2.10.5. Financials (Based on Availability)
- 11.2.11 Orgain
- 11.2.11.1. Overview
- 11.2.11.2. Products
- 11.2.11.3. SWOT Analysis
- 11.2.11.4. Recent Developments
- 11.2.11.5. Financials (Based on Availability)
- 11.2.12 NOW Foods
- 11.2.12.1. Overview
- 11.2.12.2. Products
- 11.2.12.3. SWOT Analysis
- 11.2.12.4. Recent Developments
- 11.2.12.5. Financials (Based on Availability)
- 11.2.13 Quest Nutrition
- 11.2.13.1. Overview
- 11.2.13.2. Products
- 11.2.13.3. SWOT Analysis
- 11.2.13.4. Recent Developments
- 11.2.13.5. Financials (Based on Availability)
- 11.2.14 Amway(Nutrilite XS )
- 11.2.14.1. Overview
- 11.2.14.2. Products
- 11.2.14.3. SWOT Analysis
- 11.2.14.4. Recent Developments
- 11.2.14.5. Financials (Based on Availability)
- 11.2.15 MaxiNutrition(KRÜGER GROUP)
- 11.2.15.1. Overview
- 11.2.15.2. Products
- 11.2.15.3. SWOT Analysis
- 11.2.15.4. Recent Developments
- 11.2.15.5. Financials (Based on Availability)
- 11.2.16 BPI Sports
- 11.2.16.1. Overview
- 11.2.16.2. Products
- 11.2.16.3. SWOT Analysis
- 11.2.16.4. Recent Developments
- 11.2.16.5. Financials (Based on Availability)
- 11.2.17 By-Health
- 11.2.17.1. Overview
- 11.2.17.2. Products
- 11.2.17.3. SWOT Analysis
- 11.2.17.4. Recent Developments
- 11.2.17.5. Financials (Based on Availability)
- 11.2.18 Decathlon
- 11.2.18.1. Overview
- 11.2.18.2. Products
- 11.2.18.3. SWOT Analysis
- 11.2.18.4. Recent Developments
- 11.2.18.5. Financials (Based on Availability)
- 11.2.19 Science in Sports
- 11.2.19.1. Overview
- 11.2.19.2. Products
- 11.2.19.3. SWOT Analysis
- 11.2.19.4. Recent Developments
- 11.2.19.5. Financials (Based on Availability)
- 11.2.20 Competitor Sports
- 11.2.20.1. Overview
- 11.2.20.2. Products
- 11.2.20.3. SWOT Analysis
- 11.2.20.4. Recent Developments
- 11.2.20.5. Financials (Based on Availability)
- 11.2.1 Glanbia Nutritionals
List of Figures
- Figure 1: Global Sports Nutrition Supplements Revenue Breakdown (million, %) by Region 2025 & 2033
- Figure 2: North America Sports Nutrition Supplements Revenue (million), by Application 2025 & 2033
- Figure 3: North America Sports Nutrition Supplements Revenue Share (%), by Application 2025 & 2033
- Figure 4: North America Sports Nutrition Supplements Revenue (million), by Type 2025 & 2033
- Figure 5: North America Sports Nutrition Supplements Revenue Share (%), by Type 2025 & 2033
- Figure 6: North America Sports Nutrition Supplements Revenue (million), by Country 2025 & 2033
- Figure 7: North America Sports Nutrition Supplements Revenue Share (%), by Country 2025 & 2033
- Figure 8: South America Sports Nutrition Supplements Revenue (million), by Application 2025 & 2033
- Figure 9: South America Sports Nutrition Supplements Revenue Share (%), by Application 2025 & 2033
- Figure 10: South America Sports Nutrition Supplements Revenue (million), by Type 2025 & 2033
- Figure 11: South America Sports Nutrition Supplements Revenue Share (%), by Type 2025 & 2033
- Figure 12: South America Sports Nutrition Supplements Revenue (million), by Country 2025 & 2033
- Figure 13: South America Sports Nutrition Supplements Revenue Share (%), by Country 2025 & 2033
- Figure 14: Europe Sports Nutrition Supplements Revenue (million), by Application 2025 & 2033
- Figure 15: Europe Sports Nutrition Supplements Revenue Share (%), by Application 2025 & 2033
- Figure 16: Europe Sports Nutrition Supplements Revenue (million), by Type 2025 & 2033
- Figure 17: Europe Sports Nutrition Supplements Revenue Share (%), by Type 2025 & 2033
- Figure 18: Europe Sports Nutrition Supplements Revenue (million), by Country 2025 & 2033
- Figure 19: Europe Sports Nutrition Supplements Revenue Share (%), by Country 2025 & 2033
- Figure 20: Middle East & Africa Sports Nutrition Supplements Revenue (million), by Application 2025 & 2033
- Figure 21: Middle East & Africa Sports Nutrition Supplements Revenue Share (%), by Application 2025 & 2033
- Figure 22: Middle East & Africa Sports Nutrition Supplements Revenue (million), by Type 2025 & 2033
- Figure 23: Middle East & Africa Sports Nutrition Supplements Revenue Share (%), by Type 2025 & 2033
- Figure 24: Middle East & Africa Sports Nutrition Supplements Revenue (million), by Country 2025 & 2033
- Figure 25: Middle East & Africa Sports Nutrition Supplements Revenue Share (%), by Country 2025 & 2033
- Figure 26: Asia Pacific Sports Nutrition Supplements Revenue (million), by Application 2025 & 2033
- Figure 27: Asia Pacific Sports Nutrition Supplements Revenue Share (%), by Application 2025 & 2033
- Figure 28: Asia Pacific Sports Nutrition Supplements Revenue (million), by Type 2025 & 2033
- Figure 29: Asia Pacific Sports Nutrition Supplements Revenue Share (%), by Type 2025 & 2033
- Figure 30: Asia Pacific Sports Nutrition Supplements Revenue (million), by Country 2025 & 2033
- Figure 31: Asia Pacific Sports Nutrition Supplements Revenue Share (%), by Country 2025 & 2033
List of Tables
- Table 1: Global Sports Nutrition Supplements Revenue million Forecast, by Application 2020 & 2033
- Table 2: Global Sports Nutrition Supplements Revenue million Forecast, by Type 2020 & 2033
- Table 3: Global Sports Nutrition Supplements Revenue million Forecast, by Region 2020 & 2033
- Table 4: Global Sports Nutrition Supplements Revenue million Forecast, by Application 2020 & 2033
- Table 5: Global Sports Nutrition Supplements Revenue million Forecast, by Type 2020 & 2033
- Table 6: Global Sports Nutrition Supplements Revenue million Forecast, by Country 2020 & 2033
- Table 7: United States Sports Nutrition Supplements Revenue (million) Forecast, by Application 2020 & 2033
- Table 8: Canada Sports Nutrition Supplements Revenue (million) Forecast, by Application 2020 & 2033
- Table 9: Mexico Sports Nutrition Supplements Revenue (million) Forecast, by Application 2020 & 2033
- Table 10: Global Sports Nutrition Supplements Revenue million Forecast, by Application 2020 & 2033
- Table 11: Global Sports Nutrition Supplements Revenue million Forecast, by Type 2020 & 2033
- Table 12: Global Sports Nutrition Supplements Revenue million Forecast, by Country 2020 & 2033
- Table 13: Brazil Sports Nutrition Supplements Revenue (million) Forecast, by Application 2020 & 2033
- Table 14: Argentina Sports Nutrition Supplements Revenue (million) Forecast, by Application 2020 & 2033
- Table 15: Rest of South America Sports Nutrition Supplements Revenue (million) Forecast, by Application 2020 & 2033
- Table 16: Global Sports Nutrition Supplements Revenue million Forecast, by Application 2020 & 2033
- Table 17: Global Sports Nutrition Supplements Revenue million Forecast, by Type 2020 & 2033
- Table 18: Global Sports Nutrition Supplements Revenue million Forecast, by Country 2020 & 2033
- Table 19: United Kingdom Sports Nutrition Supplements Revenue (million) Forecast, by Application 2020 & 2033
- Table 20: Germany Sports Nutrition Supplements Revenue (million) Forecast, by Application 2020 & 2033
- Table 21: France Sports Nutrition Supplements Revenue (million) Forecast, by Application 2020 & 2033
- Table 22: Italy Sports Nutrition Supplements Revenue (million) Forecast, by Application 2020 & 2033
- Table 23: Spain Sports Nutrition Supplements Revenue (million) Forecast, by Application 2020 & 2033
- Table 24: Russia Sports Nutrition Supplements Revenue (million) Forecast, by Application 2020 & 2033
- Table 25: Benelux Sports Nutrition Supplements Revenue (million) Forecast, by Application 2020 & 2033
- Table 26: Nordics Sports Nutrition Supplements Revenue (million) Forecast, by Application 2020 & 2033
- Table 27: Rest of Europe Sports Nutrition Supplements Revenue (million) Forecast, by Application 2020 & 2033
- Table 28: Global Sports Nutrition Supplements Revenue million Forecast, by Application 2020 & 2033
- Table 29: Global Sports Nutrition Supplements Revenue million Forecast, by Type 2020 & 2033
- Table 30: Global Sports Nutrition Supplements Revenue million Forecast, by Country 2020 & 2033
- Table 31: Turkey Sports Nutrition Supplements Revenue (million) Forecast, by Application 2020 & 2033
- Table 32: Israel Sports Nutrition Supplements Revenue (million) Forecast, by Application 2020 & 2033
- Table 33: GCC Sports Nutrition Supplements Revenue (million) Forecast, by Application 2020 & 2033
- Table 34: North Africa Sports Nutrition Supplements Revenue (million) Forecast, by Application 2020 & 2033
- Table 35: South Africa Sports Nutrition Supplements Revenue (million) Forecast, by Application 2020 & 2033
- Table 36: Rest of Middle East & Africa Sports Nutrition Supplements Revenue (million) Forecast, by Application 2020 & 2033
- Table 37: Global Sports Nutrition Supplements Revenue million Forecast, by Application 2020 & 2033
- Table 38: Global Sports Nutrition Supplements Revenue million Forecast, by Type 2020 & 2033
- Table 39: Global Sports Nutrition Supplements Revenue million Forecast, by Country 2020 & 2033
- Table 40: China Sports Nutrition Supplements Revenue (million) Forecast, by Application 2020 & 2033
- Table 41: India Sports Nutrition Supplements Revenue (million) Forecast, by Application 2020 & 2033
- Table 42: Japan Sports Nutrition Supplements Revenue (million) Forecast, by Application 2020 & 2033
- Table 43: South Korea Sports Nutrition Supplements Revenue (million) Forecast, by Application 2020 & 2033
- Table 44: ASEAN Sports Nutrition Supplements Revenue (million) Forecast, by Application 2020 & 2033
- Table 45: Oceania Sports Nutrition Supplements Revenue (million) Forecast, by Application 2020 & 2033
- Table 46: Rest of Asia Pacific Sports Nutrition Supplements Revenue (million) Forecast, by Application 2020 & 2033
Frequently Asked Questions
1. What is the projected Compound Annual Growth Rate (CAGR) of the Sports Nutrition Supplements?
The projected CAGR is approximately 7.1%.
2. Which companies are prominent players in the Sports Nutrition Supplements?
Key companies in the market include Glanbia Nutritionals, BellRing Brands, Nutrabolt, Nestle, THG Group, Herbalife, Clif Bar, Abbott Nutrition, Xiwang Foodstuffs, CytoSport, Orgain, NOW Foods, Quest Nutrition, Amway(Nutrilite XS ), MaxiNutrition(KRÜGER GROUP), BPI Sports, By-Health, Decathlon, Science in Sports, Competitor Sports.
3. What are the main segments of the Sports Nutrition Supplements?
The market segments include Application, Type.
4. Can you provide details about the market size?
The market size is estimated to be USD 37110 million as of 2022.
5. What are some drivers contributing to market growth?
N/A
6. What are the notable trends driving market growth?
N/A
7. Are there any restraints impacting market growth?
N/A
8. Can you provide examples of recent developments in the market?
N/A
9. What pricing options are available for accessing the report?
Pricing options include single-user, multi-user, and enterprise licenses priced at USD 4250.00, USD 6375.00, and USD 8500.00 respectively.
10. Is the market size provided in terms of value or volume?
The market size is provided in terms of value, measured in million.
11. Are there any specific market keywords associated with the report?
Yes, the market keyword associated with the report is "Sports Nutrition Supplements," which aids in identifying and referencing the specific market segment covered.
12. How do I determine which pricing option suits my needs best?
The pricing options vary based on user requirements and access needs. Individual users may opt for single-user licenses, while businesses requiring broader access may choose multi-user or enterprise licenses for cost-effective access to the report.
13. Are there any additional resources or data provided in the Sports Nutrition Supplements report?
While the report offers comprehensive insights, it's advisable to review the specific contents or supplementary materials provided to ascertain if additional resources or data are available.
14. How can I stay updated on further developments or reports in the Sports Nutrition Supplements?
To stay informed about further developments, trends, and reports in the Sports Nutrition Supplements, consider subscribing to industry newsletters, following relevant companies and organizations, or regularly checking reputable industry news sources and publications.
Methodology
Step 1 - Identification of Relevant Samples Size from Population Database


Step 2 - Approaches for Defining Global Market Size (Value, Volume* & Price*)

Note*: In applicable scenarios
Step 3 - Data Sources
Primary Research
- Web Analytics
- Survey Reports
- Research Institute
- Latest Research Reports
- Opinion Leaders
Secondary Research
- Annual Reports
- White Paper
- Latest Press Release
- Industry Association
- Paid Database
- Investor Presentations

Step 4 - Data Triangulation
Involves using different sources of information in order to increase the validity of a study
These sources are likely to be stakeholders in a program - participants, other researchers, program staff, other community members, and so on.
Then we put all data in single framework & apply various statistical tools to find out the dynamic on the market.
During the analysis stage, feedback from the stakeholder groups would be compared to determine areas of agreement as well as areas of divergence