

Key Insights
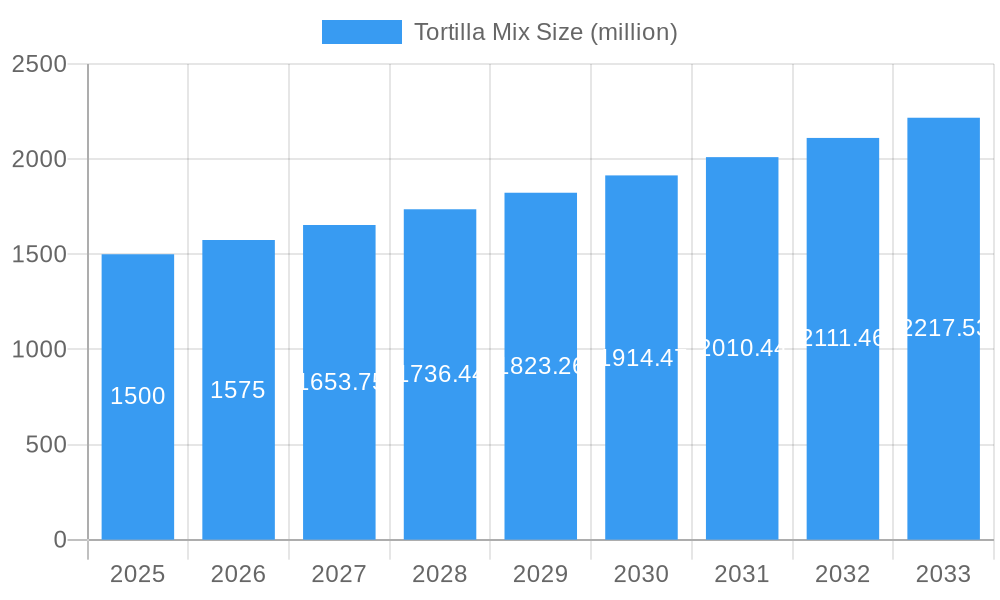
The global tortilla mix market presents a significant investment opportunity, projected to reach $2.5 billion by 2025. This market is poised for substantial expansion, with an estimated Compound Annual Growth Rate (CAGR) of 7% between 2025 and 2033. Key growth drivers include the escalating popularity of Mexican cuisine worldwide, the inherent convenience of pre-packaged mixes, and a growing consumer preference for healthier and authentic flavor profiles. As consumers increasingly prioritize time-saving meal preparation solutions, tortilla mixes offer a versatile and convenient option for a wide array of dishes, from tacos and quesadillas to enchiladas and burritos. The proliferation of Mexican restaurants and food trucks further stimulates demand for these products. Leading industry players are actively innovating and expanding distribution to capitalize on these trends. However, the market contends with challenges such as volatile commodity prices, particularly for corn, and increasing competition from specialized regional brands focusing on niche segments like organic or gluten-free offerings.
Tortilla Mix Market Size (In Billion)
Despite these hurdles, the long-term market outlook remains robust. Continued growth in the global food industry, coupled with the widespread adoption of convenient meal solutions, indicates a sustained upward trajectory for the tortilla mix market. Future growth will likely be propelled by geographic expansion into emerging markets and enhanced product diversification to meet evolving consumer demands. This includes the introduction of novel flavors, organic variants, and mixes catering to specific dietary needs and restrictions. Success in this competitive landscape will hinge on strong brand building, optimized supply chain management, and adaptability to consumer preferences for convenience, health, and authenticity. The industry anticipates further consolidation through strategic mergers and acquisitions, enabling larger entities to broaden market share and leverage emerging growth avenues.
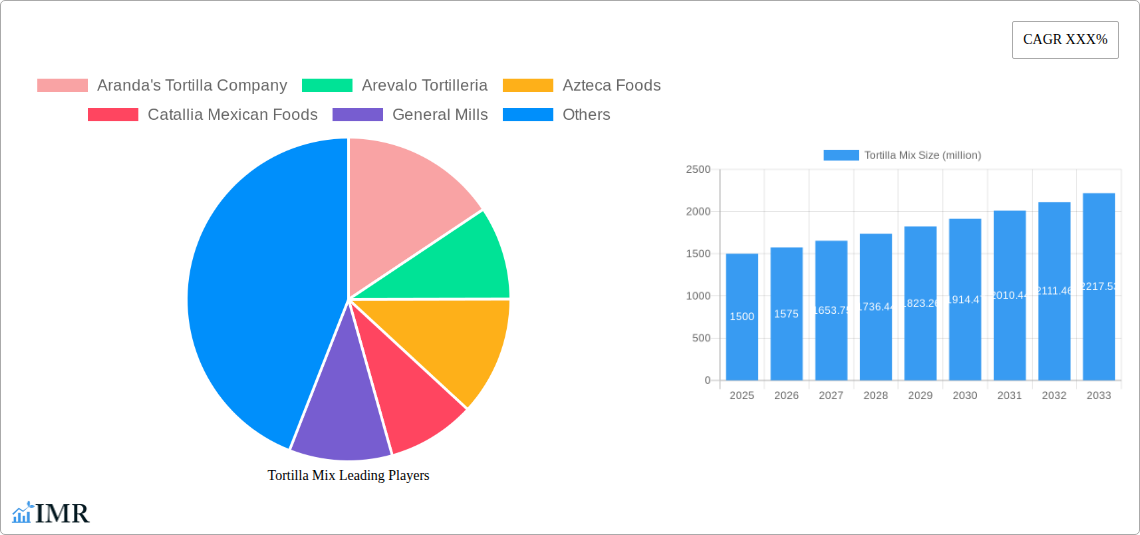
Tortilla Mix Company Market Share
This comprehensive report offers an in-depth analysis of the Tortilla Mix market, covering market dynamics, growth trajectories, regional performance, product offerings, key stakeholders, and future projections. The analysis spans from 2019 to 2033, with 2025 designated as the base and estimated year. Leveraging data from diverse sources and expert insights, this report provides actionable intelligence for businesses operating within or considering entry into this dynamic sector. It is an essential resource for manufacturers, distributors, retailers, and investors seeking to understand the current market landscape and future opportunities within the broader packaged food sector and the specific niche of Mexican-style food products.
Tortilla Mix Market Dynamics & Structure
The Tortilla Mix market is characterized by a moderately consolidated structure, with key players such as Gruma, Grupo Bimbo, and General Mills holding significant market share. The market size in 2025 is estimated at $xx million. Technological innovation, particularly in automated production and ingredient sourcing, is a key driver, while regulatory changes impacting food safety and labeling create ongoing challenges. Competitive pressures arise from both established players and smaller, niche brands focusing on organic or specialty mixes. Consumer demographics significantly influence market trends, with growing demand from health-conscious consumers driving innovation in healthier options. M&A activity in the sector remains steady; we estimate xx deals occurred between 2019 and 2024, with an average deal size of $xx million.
- Market Concentration: Gruma and Grupo Bimbo together hold an estimated 40% market share in 2025.
- Technological Innovation: Focus on automation to enhance efficiency and reduce labor costs.
- Regulatory Framework: Stringent food safety regulations influence product formulations and packaging.
- Competitive Substitutes: Other baking mixes and homemade tortillas pose competitive threats.
- End-User Demographics: Growing Hispanic population fuels market growth in North America.
- M&A Trends: Consolidation among larger players to gain market share and expand product portfolios.
Tortilla Mix Growth Trends & Insights
The Tortilla Mix market experienced a CAGR of xx% during the historical period (2019-2024), reaching an estimated market size of $xx million in 2025. This growth is primarily driven by increasing consumer demand for convenient and flavorful meal options, coupled with the rising popularity of Mexican cuisine globally. Technological disruptions, such as the introduction of improved mixing technologies and ready-to-use mixes, have further accelerated market penetration. Shifting consumer behavior towards healthier and more natural food products has also influenced market trends, with an increasing demand for organic and gluten-free tortilla mixes. We project a CAGR of xx% from 2025 to 2033. Market penetration is projected to reach xx% by 2033.
Dominant Regions, Countries, or Segments in Tortilla Mix
The North American market, particularly the United States, dominates the global Tortilla Mix market, accounting for approximately xx% of the total market share in 2025. This dominance stems from a large and growing Hispanic population, high consumption rates of Mexican food, and well-established distribution networks. Key growth drivers include increased disposable incomes, changing dietary habits favoring convenience foods, and the expanding restaurant sector. Mexico also holds a significant position due to domestic consumption and export opportunities.
- Key Drivers in North America: High Hispanic population, strong demand for convenience foods, and established retail infrastructure.
- Dominance Factors: Large consumer base, robust distribution channels, and high consumption rates of Mexican cuisine.
- Growth Potential: Expansion into untapped markets within North America and increased penetration into international markets.
Tortilla Mix Product Landscape
Tortilla mix products are continuously evolving, with innovations focusing on convenience, flavor variety, and health benefits. Ready-to-use mixes, organic options, and gluten-free formulations are gaining popularity. Unique selling propositions include ease of preparation, authentic flavor profiles, and reduced preparation time. Technological advancements in ingredient processing and packaging further enhance product quality and shelf life.
Key Drivers, Barriers & Challenges in Tortilla Mix
Key Drivers: Growing demand for convenient foods, increasing popularity of Mexican cuisine, and rising disposable incomes are key drivers. Technological advancements in processing and packaging also contribute to market growth.
Key Challenges: Fluctuations in raw material prices (e.g., corn), intense competition among established brands, and evolving consumer preferences represent significant challenges. Supply chain disruptions can significantly impact production and distribution. Regulatory changes related to food safety and labeling add to the complexity of operations.
Emerging Opportunities in Tortilla Mix
Emerging opportunities lie in expanding into untapped international markets, developing innovative product variations (e.g., flavored mixes, specialty flours), and catering to specific dietary needs (e.g., vegan, keto-friendly). Focus on sustainability and ethical sourcing of ingredients offers a competitive advantage. Online sales channels present a significant growth opportunity.
Growth Accelerators in the Tortilla Mix Industry
Strategic partnerships with foodservice providers, investment in research and development for new product formulations, and aggressive marketing campaigns targeting specific consumer segments are crucial growth accelerators. Expanding product lines to encompass complementary products like salsas and dips can also increase market share. Leveraging e-commerce platforms for wider reach is vital.
Key Players Shaping the Tortilla Mix Market
- Gruma
- Grupo Bimbo
- General Mills
- Azteca Foods
- Catallia Mexican Foods
- Aranda's Tortilla Company
- Arevalo Tortilleria
- Liven
- Ole Mexican Foods
- Tyson Foods
Notable Milestones in Tortilla Mix Sector
- 2020: Launch of several organic and gluten-free tortilla mix products by major players.
- 2022: Increased M&A activity within the sector, resulting in market consolidation.
- 2023: Significant investment in automation technologies by leading manufacturers.
In-Depth Tortilla Mix Market Outlook
The Tortilla Mix market is poised for continued growth, driven by sustained demand for convenient and flavorful food options. Strategic partnerships, product innovation, and effective marketing strategies will be crucial for players to maintain competitiveness. The expanding global demand for Mexican cuisine, coupled with continuous product development, will shape the future of the market, presenting significant opportunities for market expansion and growth. We predict a market size exceeding $xx million by 2033.
Tortilla Mix Segmentation
-
1. Application
- 1.1. Online
- 1.2. Offline
-
2. Type
- 2.1. Fresh Tortilla Mix
- 2.2. Frozen Tortilla Mix
Tortilla Mix Segmentation By Geography
-
1. North America
- 1.1. United States
- 1.2. Canada
- 1.3. Mexico
-
2. South America
- 2.1. Brazil
- 2.2. Argentina
- 2.3. Rest of South America
-
3. Europe
- 3.1. United Kingdom
- 3.2. Germany
- 3.3. France
- 3.4. Italy
- 3.5. Spain
- 3.6. Russia
- 3.7. Benelux
- 3.8. Nordics
- 3.9. Rest of Europe
-
4. Middle East & Africa
- 4.1. Turkey
- 4.2. Israel
- 4.3. GCC
- 4.4. North Africa
- 4.5. South Africa
- 4.6. Rest of Middle East & Africa
-
5. Asia Pacific
- 5.1. China
- 5.2. India
- 5.3. Japan
- 5.4. South Korea
- 5.5. ASEAN
- 5.6. Oceania
- 5.7. Rest of Asia Pacific

Tortilla Mix Regional Market Share
Geographic Coverage of Tortilla Mix
Tortilla Mix REPORT HIGHLIGHTS
| Aspects | Details |
|---|---|
| Study Period | 2020-2034 |
| Base Year | 2025 |
| Estimated Year | 2026 |
| Forecast Period | 2026-2034 |
| Historical Period | 2020-2025 |
| Growth Rate | CAGR of 7% from 2020-2034 |
| Segmentation |
|
Table of Contents
- 1. Introduction
- 1.1. Research Scope
- 1.2. Market Segmentation
- 1.3. Research Methodology
- 1.4. Definitions and Assumptions
- 2. Executive Summary
- 2.1. Introduction
- 3. Market Dynamics
- 3.1. Introduction
- 3.2. Market Drivers
- 3.3. Market Restrains
- 3.4. Market Trends
- 4. Market Factor Analysis
- 4.1. Porters Five Forces
- 4.2. Supply/Value Chain
- 4.3. PESTEL analysis
- 4.4. Market Entropy
- 4.5. Patent/Trademark Analysis
- 5. Global Tortilla Mix Analysis, Insights and Forecast, 2020-2032
- 5.1. Market Analysis, Insights and Forecast - by Application
- 5.1.1. Online
- 5.1.2. Offline
- 5.2. Market Analysis, Insights and Forecast - by Type
- 5.2.1. Fresh Tortilla Mix
- 5.2.2. Frozen Tortilla Mix
- 5.3. Market Analysis, Insights and Forecast - by Region
- 5.3.1. North America
- 5.3.2. South America
- 5.3.3. Europe
- 5.3.4. Middle East & Africa
- 5.3.5. Asia Pacific
- 5.1. Market Analysis, Insights and Forecast - by Application
- 6. North America Tortilla Mix Analysis, Insights and Forecast, 2020-2032
- 6.1. Market Analysis, Insights and Forecast - by Application
- 6.1.1. Online
- 6.1.2. Offline
- 6.2. Market Analysis, Insights and Forecast - by Type
- 6.2.1. Fresh Tortilla Mix
- 6.2.2. Frozen Tortilla Mix
- 6.1. Market Analysis, Insights and Forecast - by Application
- 7. South America Tortilla Mix Analysis, Insights and Forecast, 2020-2032
- 7.1. Market Analysis, Insights and Forecast - by Application
- 7.1.1. Online
- 7.1.2. Offline
- 7.2. Market Analysis, Insights and Forecast - by Type
- 7.2.1. Fresh Tortilla Mix
- 7.2.2. Frozen Tortilla Mix
- 7.1. Market Analysis, Insights and Forecast - by Application
- 8. Europe Tortilla Mix Analysis, Insights and Forecast, 2020-2032
- 8.1. Market Analysis, Insights and Forecast - by Application
- 8.1.1. Online
- 8.1.2. Offline
- 8.2. Market Analysis, Insights and Forecast - by Type
- 8.2.1. Fresh Tortilla Mix
- 8.2.2. Frozen Tortilla Mix
- 8.1. Market Analysis, Insights and Forecast - by Application
- 9. Middle East & Africa Tortilla Mix Analysis, Insights and Forecast, 2020-2032
- 9.1. Market Analysis, Insights and Forecast - by Application
- 9.1.1. Online
- 9.1.2. Offline
- 9.2. Market Analysis, Insights and Forecast - by Type
- 9.2.1. Fresh Tortilla Mix
- 9.2.2. Frozen Tortilla Mix
- 9.1. Market Analysis, Insights and Forecast - by Application
- 10. Asia Pacific Tortilla Mix Analysis, Insights and Forecast, 2020-2032
- 10.1. Market Analysis, Insights and Forecast - by Application
- 10.1.1. Online
- 10.1.2. Offline
- 10.2. Market Analysis, Insights and Forecast - by Type
- 10.2.1. Fresh Tortilla Mix
- 10.2.2. Frozen Tortilla Mix
- 10.1. Market Analysis, Insights and Forecast - by Application
- 11. Competitive Analysis
- 11.1. Global Market Share Analysis 2025
- 11.2. Company Profiles
- 11.2.1 Aranda's Tortilla Company
- 11.2.1.1. Overview
- 11.2.1.2. Products
- 11.2.1.3. SWOT Analysis
- 11.2.1.4. Recent Developments
- 11.2.1.5. Financials (Based on Availability)
- 11.2.2 Arevalo Tortilleria
- 11.2.2.1. Overview
- 11.2.2.2. Products
- 11.2.2.3. SWOT Analysis
- 11.2.2.4. Recent Developments
- 11.2.2.5. Financials (Based on Availability)
- 11.2.3 Azteca Foods
- 11.2.3.1. Overview
- 11.2.3.2. Products
- 11.2.3.3. SWOT Analysis
- 11.2.3.4. Recent Developments
- 11.2.3.5. Financials (Based on Availability)
- 11.2.4 Catallia Mexican Foods
- 11.2.4.1. Overview
- 11.2.4.2. Products
- 11.2.4.3. SWOT Analysis
- 11.2.4.4. Recent Developments
- 11.2.4.5. Financials (Based on Availability)
- 11.2.5 General Mills
- 11.2.5.1. Overview
- 11.2.5.2. Products
- 11.2.5.3. SWOT Analysis
- 11.2.5.4. Recent Developments
- 11.2.5.5. Financials (Based on Availability)
- 11.2.6 Gruma
- 11.2.6.1. Overview
- 11.2.6.2. Products
- 11.2.6.3. SWOT Analysis
- 11.2.6.4. Recent Developments
- 11.2.6.5. Financials (Based on Availability)
- 11.2.7 Grupo Bimbo
- 11.2.7.1. Overview
- 11.2.7.2. Products
- 11.2.7.3. SWOT Analysis
- 11.2.7.4. Recent Developments
- 11.2.7.5. Financials (Based on Availability)
- 11.2.8 Liven
- 11.2.8.1. Overview
- 11.2.8.2. Products
- 11.2.8.3. SWOT Analysis
- 11.2.8.4. Recent Developments
- 11.2.8.5. Financials (Based on Availability)
- 11.2.9 Ole Mexican Foods
- 11.2.9.1. Overview
- 11.2.9.2. Products
- 11.2.9.3. SWOT Analysis
- 11.2.9.4. Recent Developments
- 11.2.9.5. Financials (Based on Availability)
- 11.2.10 Tyson Foods
- 11.2.10.1. Overview
- 11.2.10.2. Products
- 11.2.10.3. SWOT Analysis
- 11.2.10.4. Recent Developments
- 11.2.10.5. Financials (Based on Availability)
- 11.2.1 Aranda's Tortilla Company
List of Figures
- Figure 1: Global Tortilla Mix Revenue Breakdown (billion, %) by Region 2025 & 2033
- Figure 2: North America Tortilla Mix Revenue (billion), by Application 2025 & 2033
- Figure 3: North America Tortilla Mix Revenue Share (%), by Application 2025 & 2033
- Figure 4: North America Tortilla Mix Revenue (billion), by Type 2025 & 2033
- Figure 5: North America Tortilla Mix Revenue Share (%), by Type 2025 & 2033
- Figure 6: North America Tortilla Mix Revenue (billion), by Country 2025 & 2033
- Figure 7: North America Tortilla Mix Revenue Share (%), by Country 2025 & 2033
- Figure 8: South America Tortilla Mix Revenue (billion), by Application 2025 & 2033
- Figure 9: South America Tortilla Mix Revenue Share (%), by Application 2025 & 2033
- Figure 10: South America Tortilla Mix Revenue (billion), by Type 2025 & 2033
- Figure 11: South America Tortilla Mix Revenue Share (%), by Type 2025 & 2033
- Figure 12: South America Tortilla Mix Revenue (billion), by Country 2025 & 2033
- Figure 13: South America Tortilla Mix Revenue Share (%), by Country 2025 & 2033
- Figure 14: Europe Tortilla Mix Revenue (billion), by Application 2025 & 2033
- Figure 15: Europe Tortilla Mix Revenue Share (%), by Application 2025 & 2033
- Figure 16: Europe Tortilla Mix Revenue (billion), by Type 2025 & 2033
- Figure 17: Europe Tortilla Mix Revenue Share (%), by Type 2025 & 2033
- Figure 18: Europe Tortilla Mix Revenue (billion), by Country 2025 & 2033
- Figure 19: Europe Tortilla Mix Revenue Share (%), by Country 2025 & 2033
- Figure 20: Middle East & Africa Tortilla Mix Revenue (billion), by Application 2025 & 2033
- Figure 21: Middle East & Africa Tortilla Mix Revenue Share (%), by Application 2025 & 2033
- Figure 22: Middle East & Africa Tortilla Mix Revenue (billion), by Type 2025 & 2033
- Figure 23: Middle East & Africa Tortilla Mix Revenue Share (%), by Type 2025 & 2033
- Figure 24: Middle East & Africa Tortilla Mix Revenue (billion), by Country 2025 & 2033
- Figure 25: Middle East & Africa Tortilla Mix Revenue Share (%), by Country 2025 & 2033
- Figure 26: Asia Pacific Tortilla Mix Revenue (billion), by Application 2025 & 2033
- Figure 27: Asia Pacific Tortilla Mix Revenue Share (%), by Application 2025 & 2033
- Figure 28: Asia Pacific Tortilla Mix Revenue (billion), by Type 2025 & 2033
- Figure 29: Asia Pacific Tortilla Mix Revenue Share (%), by Type 2025 & 2033
- Figure 30: Asia Pacific Tortilla Mix Revenue (billion), by Country 2025 & 2033
- Figure 31: Asia Pacific Tortilla Mix Revenue Share (%), by Country 2025 & 2033
List of Tables
- Table 1: Global Tortilla Mix Revenue billion Forecast, by Application 2020 & 2033
- Table 2: Global Tortilla Mix Revenue billion Forecast, by Type 2020 & 2033
- Table 3: Global Tortilla Mix Revenue billion Forecast, by Region 2020 & 2033
- Table 4: Global Tortilla Mix Revenue billion Forecast, by Application 2020 & 2033
- Table 5: Global Tortilla Mix Revenue billion Forecast, by Type 2020 & 2033
- Table 6: Global Tortilla Mix Revenue billion Forecast, by Country 2020 & 2033
- Table 7: United States Tortilla Mix Revenue (billion) Forecast, by Application 2020 & 2033
- Table 8: Canada Tortilla Mix Revenue (billion) Forecast, by Application 2020 & 2033
- Table 9: Mexico Tortilla Mix Revenue (billion) Forecast, by Application 2020 & 2033
- Table 10: Global Tortilla Mix Revenue billion Forecast, by Application 2020 & 2033
- Table 11: Global Tortilla Mix Revenue billion Forecast, by Type 2020 & 2033
- Table 12: Global Tortilla Mix Revenue billion Forecast, by Country 2020 & 2033
- Table 13: Brazil Tortilla Mix Revenue (billion) Forecast, by Application 2020 & 2033
- Table 14: Argentina Tortilla Mix Revenue (billion) Forecast, by Application 2020 & 2033
- Table 15: Rest of South America Tortilla Mix Revenue (billion) Forecast, by Application 2020 & 2033
- Table 16: Global Tortilla Mix Revenue billion Forecast, by Application 2020 & 2033
- Table 17: Global Tortilla Mix Revenue billion Forecast, by Type 2020 & 2033
- Table 18: Global Tortilla Mix Revenue billion Forecast, by Country 2020 & 2033
- Table 19: United Kingdom Tortilla Mix Revenue (billion) Forecast, by Application 2020 & 2033
- Table 20: Germany Tortilla Mix Revenue (billion) Forecast, by Application 2020 & 2033
- Table 21: France Tortilla Mix Revenue (billion) Forecast, by Application 2020 & 2033
- Table 22: Italy Tortilla Mix Revenue (billion) Forecast, by Application 2020 & 2033
- Table 23: Spain Tortilla Mix Revenue (billion) Forecast, by Application 2020 & 2033
- Table 24: Russia Tortilla Mix Revenue (billion) Forecast, by Application 2020 & 2033
- Table 25: Benelux Tortilla Mix Revenue (billion) Forecast, by Application 2020 & 2033
- Table 26: Nordics Tortilla Mix Revenue (billion) Forecast, by Application 2020 & 2033
- Table 27: Rest of Europe Tortilla Mix Revenue (billion) Forecast, by Application 2020 & 2033
- Table 28: Global Tortilla Mix Revenue billion Forecast, by Application 2020 & 2033
- Table 29: Global Tortilla Mix Revenue billion Forecast, by Type 2020 & 2033
- Table 30: Global Tortilla Mix Revenue billion Forecast, by Country 2020 & 2033
- Table 31: Turkey Tortilla Mix Revenue (billion) Forecast, by Application 2020 & 2033
- Table 32: Israel Tortilla Mix Revenue (billion) Forecast, by Application 2020 & 2033
- Table 33: GCC Tortilla Mix Revenue (billion) Forecast, by Application 2020 & 2033
- Table 34: North Africa Tortilla Mix Revenue (billion) Forecast, by Application 2020 & 2033
- Table 35: South Africa Tortilla Mix Revenue (billion) Forecast, by Application 2020 & 2033
- Table 36: Rest of Middle East & Africa Tortilla Mix Revenue (billion) Forecast, by Application 2020 & 2033
- Table 37: Global Tortilla Mix Revenue billion Forecast, by Application 2020 & 2033
- Table 38: Global Tortilla Mix Revenue billion Forecast, by Type 2020 & 2033
- Table 39: Global Tortilla Mix Revenue billion Forecast, by Country 2020 & 2033
- Table 40: China Tortilla Mix Revenue (billion) Forecast, by Application 2020 & 2033
- Table 41: India Tortilla Mix Revenue (billion) Forecast, by Application 2020 & 2033
- Table 42: Japan Tortilla Mix Revenue (billion) Forecast, by Application 2020 & 2033
- Table 43: South Korea Tortilla Mix Revenue (billion) Forecast, by Application 2020 & 2033
- Table 44: ASEAN Tortilla Mix Revenue (billion) Forecast, by Application 2020 & 2033
- Table 45: Oceania Tortilla Mix Revenue (billion) Forecast, by Application 2020 & 2033
- Table 46: Rest of Asia Pacific Tortilla Mix Revenue (billion) Forecast, by Application 2020 & 2033
Frequently Asked Questions
1. What is the projected Compound Annual Growth Rate (CAGR) of the Tortilla Mix?
The projected CAGR is approximately 7%.
2. Which companies are prominent players in the Tortilla Mix?
Key companies in the market include Aranda's Tortilla Company, Arevalo Tortilleria, Azteca Foods, Catallia Mexican Foods, General Mills, Gruma, Grupo Bimbo, Liven, Ole Mexican Foods, Tyson Foods.
3. What are the main segments of the Tortilla Mix?
The market segments include Application, Type.
4. Can you provide details about the market size?
The market size is estimated to be USD 2.5 billion as of 2022.
5. What are some drivers contributing to market growth?
N/A
6. What are the notable trends driving market growth?
N/A
7. Are there any restraints impacting market growth?
N/A
8. Can you provide examples of recent developments in the market?
N/A
9. What pricing options are available for accessing the report?
Pricing options include single-user, multi-user, and enterprise licenses priced at USD 2900.00, USD 4350.00, and USD 5800.00 respectively.
10. Is the market size provided in terms of value or volume?
The market size is provided in terms of value, measured in billion.
11. Are there any specific market keywords associated with the report?
Yes, the market keyword associated with the report is "Tortilla Mix," which aids in identifying and referencing the specific market segment covered.
12. How do I determine which pricing option suits my needs best?
The pricing options vary based on user requirements and access needs. Individual users may opt for single-user licenses, while businesses requiring broader access may choose multi-user or enterprise licenses for cost-effective access to the report.
13. Are there any additional resources or data provided in the Tortilla Mix report?
While the report offers comprehensive insights, it's advisable to review the specific contents or supplementary materials provided to ascertain if additional resources or data are available.
14. How can I stay updated on further developments or reports in the Tortilla Mix?
To stay informed about further developments, trends, and reports in the Tortilla Mix, consider subscribing to industry newsletters, following relevant companies and organizations, or regularly checking reputable industry news sources and publications.
Methodology
Step 1 - Identification of Relevant Samples Size from Population Database


Step 2 - Approaches for Defining Global Market Size (Value, Volume* & Price*)

Note*: In applicable scenarios
Step 3 - Data Sources
Primary Research
- Web Analytics
- Survey Reports
- Research Institute
- Latest Research Reports
- Opinion Leaders
Secondary Research
- Annual Reports
- White Paper
- Latest Press Release
- Industry Association
- Paid Database
- Investor Presentations

Step 4 - Data Triangulation
Involves using different sources of information in order to increase the validity of a study
These sources are likely to be stakeholders in a program - participants, other researchers, program staff, other community members, and so on.
Then we put all data in single framework & apply various statistical tools to find out the dynamic on the market.
During the analysis stage, feedback from the stakeholder groups would be compared to determine areas of agreement as well as areas of divergence