

Key Insights
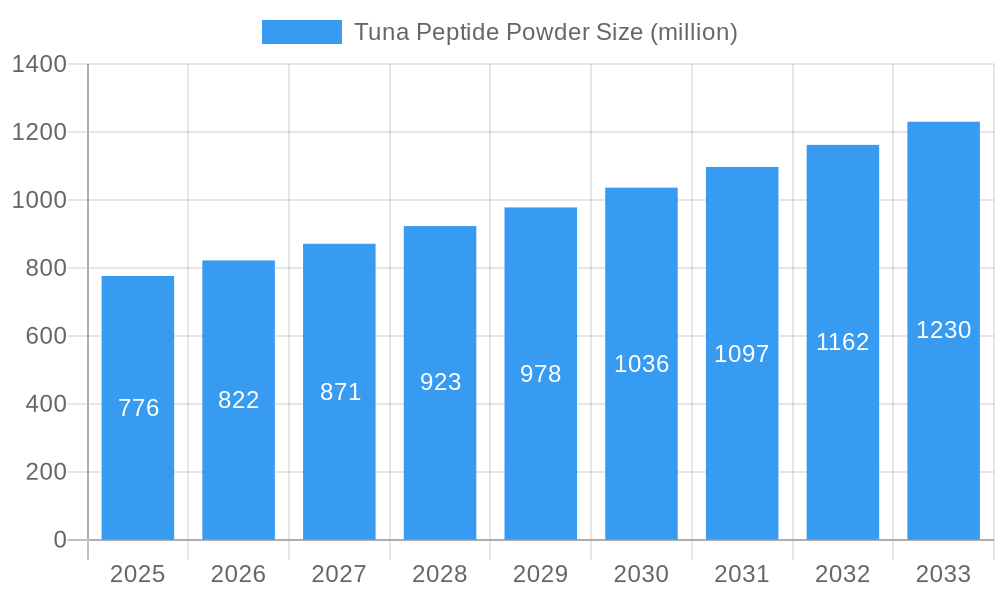
The global tuna peptide powder market, valued at $776 million in 2025, is projected to experience robust growth, driven by increasing consumer demand for functional foods and dietary supplements. The market's Compound Annual Growth Rate (CAGR) of 5.6% from 2019 to 2033 indicates a steady expansion, fueled by several key factors. Growing awareness of the health benefits associated with peptide consumption, including improved muscle recovery, enhanced immune function, and potential anti-aging properties, is significantly boosting market demand. The rising popularity of protein-rich diets and the incorporation of tuna peptides into various food and beverage products are further contributing to this growth. Furthermore, the development of innovative extraction and purification technologies is improving the quality and availability of tuna peptide powder, making it more accessible to consumers and manufacturers alike. Key players like Creative Enzymes, Biomega Group, and Lonza Group are actively involved in research and development, leading to product innovation and market expansion.
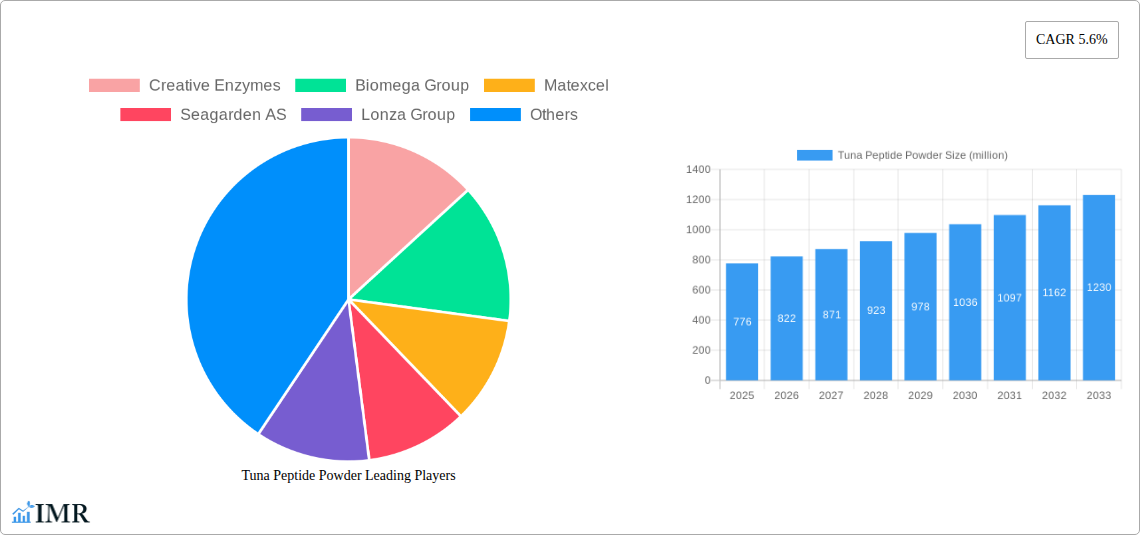
Tuna Peptide Powder Market Size (In Million)
Despite the positive outlook, the market faces some challenges. Supply chain limitations related to sustainable tuna sourcing and the potential for price fluctuations based on global tuna harvests could restrain market growth. Consumer concerns regarding potential allergens and the need for clear labeling regarding purity and sourcing also necessitate attention. However, the overall growth trajectory remains positive, driven by strong market fundamentals and the ongoing innovation within the industry. The segmentation of the market by product type (e.g., hydrolysates, isolates), application (e.g., dietary supplements, food and beverage), and geography will continue to evolve as the market matures, presenting opportunities for both established players and emerging entrants. The market is expected to witness significant regional variations in growth, with North America and Europe likely leading the way due to established consumer preference for functional foods and a strong regulatory framework.
Tuna Peptide Powder Company Market Share
Tuna Peptide Powder Market Report: 2019-2033
This comprehensive report provides an in-depth analysis of the global Tuna Peptide Powder market, offering invaluable insights for industry professionals, investors, and strategic decision-makers. Covering the period from 2019 to 2033, with a focus on 2025, this report unveils the market's dynamics, growth trajectories, key players, and future potential. The report meticulously examines the parent market of marine-derived protein ingredients and the child market of functional food ingredients, providing a granular understanding of market segmentation and growth drivers.
Tuna Peptide Powder Market Dynamics & Structure
The global Tuna Peptide Powder market is characterized by a moderately consolidated structure, with several key players holding significant market share. Market concentration is expected to remain relatively stable throughout the forecast period (2025-2033), although strategic mergers and acquisitions (M&A) are anticipated to reshape the competitive landscape. Technological innovation, particularly in extraction and purification techniques, is a key driver, enabling the production of higher-quality peptides with enhanced functionalities. Stringent regulatory frameworks concerning food safety and labeling influence market growth, while the presence of alternative protein sources creates competitive pressure. End-user demographics, with a growing preference for functional foods and health-conscious consumers, significantly impact market demand.
- Market Concentration: Moderately consolidated, with the top 5 players holding approximately xx% of the market share in 2025.
- Technological Innovation: Focus on improving extraction yields, peptide purity, and bioactivity.
- Regulatory Framework: Compliance with food safety and labeling regulations is crucial.
- Competitive Substitutes: Plant-based protein peptides and other marine-derived protein hydrolysates.
- M&A Activity: An estimated xx M&A deals in the marine protein ingredients sector occurred between 2019 and 2024, with xx million USD invested. A further xx deals are projected between 2025 and 2033.
- Innovation Barriers: High R&D costs, complex extraction processes, and securing consistent raw material supply.
Tuna Peptide Powder Growth Trends & Insights
The Tuna Peptide Powder market experienced substantial growth during the historical period (2019-2024), driven by increasing consumer demand for functional foods and dietary supplements. The market size reached an estimated xx million units in 2024 and is projected to witness a Compound Annual Growth Rate (CAGR) of xx% during the forecast period (2025-2033), reaching xx million units by 2033. This growth is fueled by rising awareness of the health benefits associated with tuna peptides, including improved muscle recovery, enhanced immunity, and anti-aging effects. Technological advancements in peptide extraction and purification methods are also boosting market growth by improving product quality and yield. Consumer preferences for natural and clean-label ingredients further support market expansion.
Dominant Regions, Countries, or Segments in Tuna Peptide Powder
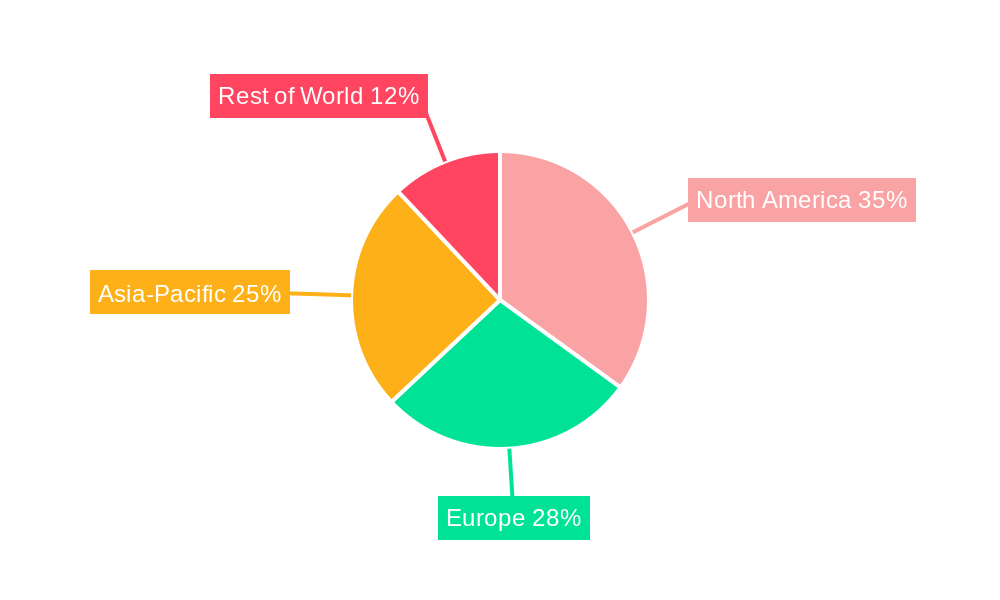
The North American region dominated the Tuna Peptide Powder market in 2025, holding a market share of approximately xx%, driven by high consumer spending on health and wellness products, coupled with the strong presence of key players. Asia-Pacific is anticipated to exhibit the fastest growth rate during the forecast period, fueled by rising disposable incomes, increasing health awareness, and the expanding functional food and beverage market. Europe follows with significant market growth due to a focus on sustainable sourcing and a keen interest in functional foods.
- North America: Strong consumer demand for health supplements, established distribution channels, and significant presence of key players.
- Asia-Pacific: Rapid growth due to rising disposable incomes, increased health awareness, and expanding functional food market.
- Europe: Focus on sustainability and functional foods drives significant market growth.
- Market Share: North America (xx%), Asia-Pacific (xx%), Europe (xx%), Rest of World (xx%) in 2025.
Tuna Peptide Powder Product Landscape
Tuna Peptide Powder products are available in various forms, including powders, liquids, and encapsulated formats, tailored to diverse applications across the food, beverage, and dietary supplement industries. Product innovation focuses on improving peptide bioavailability, enhancing flavor profiles, and developing specialized peptides with targeted health benefits. Key selling propositions include high protein content, excellent digestibility, and functional properties like antioxidant and anti-inflammatory effects. Technological advancements are improving peptide production efficiency and ensuring consistent product quality.
Key Drivers, Barriers & Challenges in Tuna Peptide Powder
Key Drivers:
- Growing demand for functional foods and dietary supplements.
- Increasing awareness of the health benefits of tuna peptides.
- Technological advancements in peptide extraction and purification.
- Favorable regulatory environment in certain regions.
Key Challenges:
- Fluctuations in raw material prices and availability.
- Stringent regulatory requirements for food safety and labeling.
- Competition from alternative protein sources.
- Maintaining consistent product quality and purity.
- The impact of sustainability concerns on sourcing and processing. This factor could result in xx million units lost to market constraints by 2033.
Emerging Opportunities in Tuna Peptide Powder
Emerging opportunities include expanding into untapped markets, developing novel applications in cosmetics and pharmaceuticals, and catering to specific consumer segments with personalized peptide blends tailored to individual health needs. The potential for customized peptide formulations with enhanced bioactivity and targeted health benefits presents significant growth prospects.
Growth Accelerators in the Tuna Peptide Powder Industry
Strategic partnerships and collaborations between peptide manufacturers, ingredient suppliers, and food and beverage companies are driving market growth. Technological innovations in peptide extraction and purification technologies are enhancing product quality and yield, thereby increasing cost-effectiveness and accessibility. Market expansion into new geographical regions with growing health-conscious populations further contributes to accelerating market growth.
Key Players Shaping the Tuna Peptide Powder Market
- Creative Enzymes
- Biomega Group
- Matexcel
- Seagarden AS
- Lonza Group
- Sopropeche
- Symrise AG
- Bolognani Srl
- Vital Proteins LLC
- Waitaki Biosciences
- Yantai Jiahui Marine Biotechnology
Notable Milestones in Tuna Peptide Powder Sector
- 2020: Launch of a new line of Tuna Peptide Powder with enhanced bioavailability by Creative Enzymes.
- 2022: Acquisition of a leading Tuna Peptide Powder manufacturer by Symrise AG.
- 2023: Introduction of sustainably sourced Tuna Peptide Powder by Seagarden AS.
- 2024: Approval of a new health claim for Tuna Peptide Powder by regulatory authorities.
In-Depth Tuna Peptide Powder Market Outlook
The Tuna Peptide Powder market is poised for significant growth driven by sustained consumer demand for functional foods, technological advancements, and strategic partnerships across the value chain. Opportunities exist to capture new market segments and expand into innovative applications, creating further potential for growth and market expansion. Strategic investments in research and development, coupled with sustainable sourcing practices, will be crucial for long-term success in this dynamic market.
Tuna Peptide Powder Segmentation
-
1. Application
- 1.1. Dietary Supplements
- 1.2. Foods and Beverages
- 1.3. Personal Care
- 1.4. Pharmaceutical
- 1.5. Others
-
2. Type
- 2.1. Sea Water Tuna
- 2.2. Farmed Tuna
Tuna Peptide Powder Segmentation By Geography
-
1. North America
- 1.1. United States
- 1.2. Canada
- 1.3. Mexico
-
2. South America
- 2.1. Brazil
- 2.2. Argentina
- 2.3. Rest of South America
-
3. Europe
- 3.1. United Kingdom
- 3.2. Germany
- 3.3. France
- 3.4. Italy
- 3.5. Spain
- 3.6. Russia
- 3.7. Benelux
- 3.8. Nordics
- 3.9. Rest of Europe
-
4. Middle East & Africa
- 4.1. Turkey
- 4.2. Israel
- 4.3. GCC
- 4.4. North Africa
- 4.5. South Africa
- 4.6. Rest of Middle East & Africa
-
5. Asia Pacific
- 5.1. China
- 5.2. India
- 5.3. Japan
- 5.4. South Korea
- 5.5. ASEAN
- 5.6. Oceania
- 5.7. Rest of Asia Pacific
Tuna Peptide Powder Regional Market Share
Geographic Coverage of Tuna Peptide Powder
Tuna Peptide Powder REPORT HIGHLIGHTS
| Aspects | Details |
|---|---|
| Study Period | 2020-2034 |
| Base Year | 2025 |
| Estimated Year | 2026 |
| Forecast Period | 2026-2034 |
| Historical Period | 2020-2025 |
| Growth Rate | CAGR of 5.6% from 2020-2034 |
| Segmentation |
|
Table of Contents
- 1. Introduction
- 1.1. Research Scope
- 1.2. Market Segmentation
- 1.3. Research Methodology
- 1.4. Definitions and Assumptions
- 2. Executive Summary
- 2.1. Introduction
- 3. Market Dynamics
- 3.1. Introduction
- 3.2. Market Drivers
- 3.3. Market Restrains
- 3.4. Market Trends
- 4. Market Factor Analysis
- 4.1. Porters Five Forces
- 4.2. Supply/Value Chain
- 4.3. PESTEL analysis
- 4.4. Market Entropy
- 4.5. Patent/Trademark Analysis
- 5. Global Tuna Peptide Powder Analysis, Insights and Forecast, 2020-2032
- 5.1. Market Analysis, Insights and Forecast - by Application
- 5.1.1. Dietary Supplements
- 5.1.2. Foods and Beverages
- 5.1.3. Personal Care
- 5.1.4. Pharmaceutical
- 5.1.5. Others
- 5.2. Market Analysis, Insights and Forecast - by Type
- 5.2.1. Sea Water Tuna
- 5.2.2. Farmed Tuna
- 5.3. Market Analysis, Insights and Forecast - by Region
- 5.3.1. North America
- 5.3.2. South America
- 5.3.3. Europe
- 5.3.4. Middle East & Africa
- 5.3.5. Asia Pacific
- 5.1. Market Analysis, Insights and Forecast - by Application
- 6. North America Tuna Peptide Powder Analysis, Insights and Forecast, 2020-2032
- 6.1. Market Analysis, Insights and Forecast - by Application
- 6.1.1. Dietary Supplements
- 6.1.2. Foods and Beverages
- 6.1.3. Personal Care
- 6.1.4. Pharmaceutical
- 6.1.5. Others
- 6.2. Market Analysis, Insights and Forecast - by Type
- 6.2.1. Sea Water Tuna
- 6.2.2. Farmed Tuna
- 6.1. Market Analysis, Insights and Forecast - by Application
- 7. South America Tuna Peptide Powder Analysis, Insights and Forecast, 2020-2032
- 7.1. Market Analysis, Insights and Forecast - by Application
- 7.1.1. Dietary Supplements
- 7.1.2. Foods and Beverages
- 7.1.3. Personal Care
- 7.1.4. Pharmaceutical
- 7.1.5. Others
- 7.2. Market Analysis, Insights and Forecast - by Type
- 7.2.1. Sea Water Tuna
- 7.2.2. Farmed Tuna
- 7.1. Market Analysis, Insights and Forecast - by Application
- 8. Europe Tuna Peptide Powder Analysis, Insights and Forecast, 2020-2032
- 8.1. Market Analysis, Insights and Forecast - by Application
- 8.1.1. Dietary Supplements
- 8.1.2. Foods and Beverages
- 8.1.3. Personal Care
- 8.1.4. Pharmaceutical
- 8.1.5. Others
- 8.2. Market Analysis, Insights and Forecast - by Type
- 8.2.1. Sea Water Tuna
- 8.2.2. Farmed Tuna
- 8.1. Market Analysis, Insights and Forecast - by Application
- 9. Middle East & Africa Tuna Peptide Powder Analysis, Insights and Forecast, 2020-2032
- 9.1. Market Analysis, Insights and Forecast - by Application
- 9.1.1. Dietary Supplements
- 9.1.2. Foods and Beverages
- 9.1.3. Personal Care
- 9.1.4. Pharmaceutical
- 9.1.5. Others
- 9.2. Market Analysis, Insights and Forecast - by Type
- 9.2.1. Sea Water Tuna
- 9.2.2. Farmed Tuna
- 9.1. Market Analysis, Insights and Forecast - by Application
- 10. Asia Pacific Tuna Peptide Powder Analysis, Insights and Forecast, 2020-2032
- 10.1. Market Analysis, Insights and Forecast - by Application
- 10.1.1. Dietary Supplements
- 10.1.2. Foods and Beverages
- 10.1.3. Personal Care
- 10.1.4. Pharmaceutical
- 10.1.5. Others
- 10.2. Market Analysis, Insights and Forecast - by Type
- 10.2.1. Sea Water Tuna
- 10.2.2. Farmed Tuna
- 10.1. Market Analysis, Insights and Forecast - by Application
- 11. Competitive Analysis
- 11.1. Global Market Share Analysis 2025
- 11.2. Company Profiles
- 11.2.1 Creative Enzymes
- 11.2.1.1. Overview
- 11.2.1.2. Products
- 11.2.1.3. SWOT Analysis
- 11.2.1.4. Recent Developments
- 11.2.1.5. Financials (Based on Availability)
- 11.2.2 Biomega Group
- 11.2.2.1. Overview
- 11.2.2.2. Products
- 11.2.2.3. SWOT Analysis
- 11.2.2.4. Recent Developments
- 11.2.2.5. Financials (Based on Availability)
- 11.2.3 Matexcel
- 11.2.3.1. Overview
- 11.2.3.2. Products
- 11.2.3.3. SWOT Analysis
- 11.2.3.4. Recent Developments
- 11.2.3.5. Financials (Based on Availability)
- 11.2.4 Seagarden AS
- 11.2.4.1. Overview
- 11.2.4.2. Products
- 11.2.4.3. SWOT Analysis
- 11.2.4.4. Recent Developments
- 11.2.4.5. Financials (Based on Availability)
- 11.2.5 Lonza Group
- 11.2.5.1. Overview
- 11.2.5.2. Products
- 11.2.5.3. SWOT Analysis
- 11.2.5.4. Recent Developments
- 11.2.5.5. Financials (Based on Availability)
- 11.2.6 Sopropeche
- 11.2.6.1. Overview
- 11.2.6.2. Products
- 11.2.6.3. SWOT Analysis
- 11.2.6.4. Recent Developments
- 11.2.6.5. Financials (Based on Availability)
- 11.2.7 Symrise AG
- 11.2.7.1. Overview
- 11.2.7.2. Products
- 11.2.7.3. SWOT Analysis
- 11.2.7.4. Recent Developments
- 11.2.7.5. Financials (Based on Availability)
- 11.2.8 Bolognani Srl
- 11.2.8.1. Overview
- 11.2.8.2. Products
- 11.2.8.3. SWOT Analysis
- 11.2.8.4. Recent Developments
- 11.2.8.5. Financials (Based on Availability)
- 11.2.9 Vital Proteins LLC
- 11.2.9.1. Overview
- 11.2.9.2. Products
- 11.2.9.3. SWOT Analysis
- 11.2.9.4. Recent Developments
- 11.2.9.5. Financials (Based on Availability)
- 11.2.10 Waitaki Biosciences
- 11.2.10.1. Overview
- 11.2.10.2. Products
- 11.2.10.3. SWOT Analysis
- 11.2.10.4. Recent Developments
- 11.2.10.5. Financials (Based on Availability)
- 11.2.11 Yantai Jiahui Marine Biotechnology
- 11.2.11.1. Overview
- 11.2.11.2. Products
- 11.2.11.3. SWOT Analysis
- 11.2.11.4. Recent Developments
- 11.2.11.5. Financials (Based on Availability)
- 11.2.1 Creative Enzymes
List of Figures
- Figure 1: Global Tuna Peptide Powder Revenue Breakdown (million, %) by Region 2025 & 2033
- Figure 2: Global Tuna Peptide Powder Volume Breakdown (K, %) by Region 2025 & 2033
- Figure 3: North America Tuna Peptide Powder Revenue (million), by Application 2025 & 2033
- Figure 4: North America Tuna Peptide Powder Volume (K), by Application 2025 & 2033
- Figure 5: North America Tuna Peptide Powder Revenue Share (%), by Application 2025 & 2033
- Figure 6: North America Tuna Peptide Powder Volume Share (%), by Application 2025 & 2033
- Figure 7: North America Tuna Peptide Powder Revenue (million), by Type 2025 & 2033
- Figure 8: North America Tuna Peptide Powder Volume (K), by Type 2025 & 2033
- Figure 9: North America Tuna Peptide Powder Revenue Share (%), by Type 2025 & 2033
- Figure 10: North America Tuna Peptide Powder Volume Share (%), by Type 2025 & 2033
- Figure 11: North America Tuna Peptide Powder Revenue (million), by Country 2025 & 2033
- Figure 12: North America Tuna Peptide Powder Volume (K), by Country 2025 & 2033
- Figure 13: North America Tuna Peptide Powder Revenue Share (%), by Country 2025 & 2033
- Figure 14: North America Tuna Peptide Powder Volume Share (%), by Country 2025 & 2033
- Figure 15: South America Tuna Peptide Powder Revenue (million), by Application 2025 & 2033
- Figure 16: South America Tuna Peptide Powder Volume (K), by Application 2025 & 2033
- Figure 17: South America Tuna Peptide Powder Revenue Share (%), by Application 2025 & 2033
- Figure 18: South America Tuna Peptide Powder Volume Share (%), by Application 2025 & 2033
- Figure 19: South America Tuna Peptide Powder Revenue (million), by Type 2025 & 2033
- Figure 20: South America Tuna Peptide Powder Volume (K), by Type 2025 & 2033
- Figure 21: South America Tuna Peptide Powder Revenue Share (%), by Type 2025 & 2033
- Figure 22: South America Tuna Peptide Powder Volume Share (%), by Type 2025 & 2033
- Figure 23: South America Tuna Peptide Powder Revenue (million), by Country 2025 & 2033
- Figure 24: South America Tuna Peptide Powder Volume (K), by Country 2025 & 2033
- Figure 25: South America Tuna Peptide Powder Revenue Share (%), by Country 2025 & 2033
- Figure 26: South America Tuna Peptide Powder Volume Share (%), by Country 2025 & 2033
- Figure 27: Europe Tuna Peptide Powder Revenue (million), by Application 2025 & 2033
- Figure 28: Europe Tuna Peptide Powder Volume (K), by Application 2025 & 2033
- Figure 29: Europe Tuna Peptide Powder Revenue Share (%), by Application 2025 & 2033
- Figure 30: Europe Tuna Peptide Powder Volume Share (%), by Application 2025 & 2033
- Figure 31: Europe Tuna Peptide Powder Revenue (million), by Type 2025 & 2033
- Figure 32: Europe Tuna Peptide Powder Volume (K), by Type 2025 & 2033
- Figure 33: Europe Tuna Peptide Powder Revenue Share (%), by Type 2025 & 2033
- Figure 34: Europe Tuna Peptide Powder Volume Share (%), by Type 2025 & 2033
- Figure 35: Europe Tuna Peptide Powder Revenue (million), by Country 2025 & 2033
- Figure 36: Europe Tuna Peptide Powder Volume (K), by Country 2025 & 2033
- Figure 37: Europe Tuna Peptide Powder Revenue Share (%), by Country 2025 & 2033
- Figure 38: Europe Tuna Peptide Powder Volume Share (%), by Country 2025 & 2033
- Figure 39: Middle East & Africa Tuna Peptide Powder Revenue (million), by Application 2025 & 2033
- Figure 40: Middle East & Africa Tuna Peptide Powder Volume (K), by Application 2025 & 2033
- Figure 41: Middle East & Africa Tuna Peptide Powder Revenue Share (%), by Application 2025 & 2033
- Figure 42: Middle East & Africa Tuna Peptide Powder Volume Share (%), by Application 2025 & 2033
- Figure 43: Middle East & Africa Tuna Peptide Powder Revenue (million), by Type 2025 & 2033
- Figure 44: Middle East & Africa Tuna Peptide Powder Volume (K), by Type 2025 & 2033
- Figure 45: Middle East & Africa Tuna Peptide Powder Revenue Share (%), by Type 2025 & 2033
- Figure 46: Middle East & Africa Tuna Peptide Powder Volume Share (%), by Type 2025 & 2033
- Figure 47: Middle East & Africa Tuna Peptide Powder Revenue (million), by Country 2025 & 2033
- Figure 48: Middle East & Africa Tuna Peptide Powder Volume (K), by Country 2025 & 2033
- Figure 49: Middle East & Africa Tuna Peptide Powder Revenue Share (%), by Country 2025 & 2033
- Figure 50: Middle East & Africa Tuna Peptide Powder Volume Share (%), by Country 2025 & 2033
- Figure 51: Asia Pacific Tuna Peptide Powder Revenue (million), by Application 2025 & 2033
- Figure 52: Asia Pacific Tuna Peptide Powder Volume (K), by Application 2025 & 2033
- Figure 53: Asia Pacific Tuna Peptide Powder Revenue Share (%), by Application 2025 & 2033
- Figure 54: Asia Pacific Tuna Peptide Powder Volume Share (%), by Application 2025 & 2033
- Figure 55: Asia Pacific Tuna Peptide Powder Revenue (million), by Type 2025 & 2033
- Figure 56: Asia Pacific Tuna Peptide Powder Volume (K), by Type 2025 & 2033
- Figure 57: Asia Pacific Tuna Peptide Powder Revenue Share (%), by Type 2025 & 2033
- Figure 58: Asia Pacific Tuna Peptide Powder Volume Share (%), by Type 2025 & 2033
- Figure 59: Asia Pacific Tuna Peptide Powder Revenue (million), by Country 2025 & 2033
- Figure 60: Asia Pacific Tuna Peptide Powder Volume (K), by Country 2025 & 2033
- Figure 61: Asia Pacific Tuna Peptide Powder Revenue Share (%), by Country 2025 & 2033
- Figure 62: Asia Pacific Tuna Peptide Powder Volume Share (%), by Country 2025 & 2033
List of Tables
- Table 1: Global Tuna Peptide Powder Revenue million Forecast, by Application 2020 & 2033
- Table 2: Global Tuna Peptide Powder Volume K Forecast, by Application 2020 & 2033
- Table 3: Global Tuna Peptide Powder Revenue million Forecast, by Type 2020 & 2033
- Table 4: Global Tuna Peptide Powder Volume K Forecast, by Type 2020 & 2033
- Table 5: Global Tuna Peptide Powder Revenue million Forecast, by Region 2020 & 2033
- Table 6: Global Tuna Peptide Powder Volume K Forecast, by Region 2020 & 2033
- Table 7: Global Tuna Peptide Powder Revenue million Forecast, by Application 2020 & 2033
- Table 8: Global Tuna Peptide Powder Volume K Forecast, by Application 2020 & 2033
- Table 9: Global Tuna Peptide Powder Revenue million Forecast, by Type 2020 & 2033
- Table 10: Global Tuna Peptide Powder Volume K Forecast, by Type 2020 & 2033
- Table 11: Global Tuna Peptide Powder Revenue million Forecast, by Country 2020 & 2033
- Table 12: Global Tuna Peptide Powder Volume K Forecast, by Country 2020 & 2033
- Table 13: United States Tuna Peptide Powder Revenue (million) Forecast, by Application 2020 & 2033
- Table 14: United States Tuna Peptide Powder Volume (K) Forecast, by Application 2020 & 2033
- Table 15: Canada Tuna Peptide Powder Revenue (million) Forecast, by Application 2020 & 2033
- Table 16: Canada Tuna Peptide Powder Volume (K) Forecast, by Application 2020 & 2033
- Table 17: Mexico Tuna Peptide Powder Revenue (million) Forecast, by Application 2020 & 2033
- Table 18: Mexico Tuna Peptide Powder Volume (K) Forecast, by Application 2020 & 2033
- Table 19: Global Tuna Peptide Powder Revenue million Forecast, by Application 2020 & 2033
- Table 20: Global Tuna Peptide Powder Volume K Forecast, by Application 2020 & 2033
- Table 21: Global Tuna Peptide Powder Revenue million Forecast, by Type 2020 & 2033
- Table 22: Global Tuna Peptide Powder Volume K Forecast, by Type 2020 & 2033
- Table 23: Global Tuna Peptide Powder Revenue million Forecast, by Country 2020 & 2033
- Table 24: Global Tuna Peptide Powder Volume K Forecast, by Country 2020 & 2033
- Table 25: Brazil Tuna Peptide Powder Revenue (million) Forecast, by Application 2020 & 2033
- Table 26: Brazil Tuna Peptide Powder Volume (K) Forecast, by Application 2020 & 2033
- Table 27: Argentina Tuna Peptide Powder Revenue (million) Forecast, by Application 2020 & 2033
- Table 28: Argentina Tuna Peptide Powder Volume (K) Forecast, by Application 2020 & 2033
- Table 29: Rest of South America Tuna Peptide Powder Revenue (million) Forecast, by Application 2020 & 2033
- Table 30: Rest of South America Tuna Peptide Powder Volume (K) Forecast, by Application 2020 & 2033
- Table 31: Global Tuna Peptide Powder Revenue million Forecast, by Application 2020 & 2033
- Table 32: Global Tuna Peptide Powder Volume K Forecast, by Application 2020 & 2033
- Table 33: Global Tuna Peptide Powder Revenue million Forecast, by Type 2020 & 2033
- Table 34: Global Tuna Peptide Powder Volume K Forecast, by Type 2020 & 2033
- Table 35: Global Tuna Peptide Powder Revenue million Forecast, by Country 2020 & 2033
- Table 36: Global Tuna Peptide Powder Volume K Forecast, by Country 2020 & 2033
- Table 37: United Kingdom Tuna Peptide Powder Revenue (million) Forecast, by Application 2020 & 2033
- Table 38: United Kingdom Tuna Peptide Powder Volume (K) Forecast, by Application 2020 & 2033
- Table 39: Germany Tuna Peptide Powder Revenue (million) Forecast, by Application 2020 & 2033
- Table 40: Germany Tuna Peptide Powder Volume (K) Forecast, by Application 2020 & 2033
- Table 41: France Tuna Peptide Powder Revenue (million) Forecast, by Application 2020 & 2033
- Table 42: France Tuna Peptide Powder Volume (K) Forecast, by Application 2020 & 2033
- Table 43: Italy Tuna Peptide Powder Revenue (million) Forecast, by Application 2020 & 2033
- Table 44: Italy Tuna Peptide Powder Volume (K) Forecast, by Application 2020 & 2033
- Table 45: Spain Tuna Peptide Powder Revenue (million) Forecast, by Application 2020 & 2033
- Table 46: Spain Tuna Peptide Powder Volume (K) Forecast, by Application 2020 & 2033
- Table 47: Russia Tuna Peptide Powder Revenue (million) Forecast, by Application 2020 & 2033
- Table 48: Russia Tuna Peptide Powder Volume (K) Forecast, by Application 2020 & 2033
- Table 49: Benelux Tuna Peptide Powder Revenue (million) Forecast, by Application 2020 & 2033
- Table 50: Benelux Tuna Peptide Powder Volume (K) Forecast, by Application 2020 & 2033
- Table 51: Nordics Tuna Peptide Powder Revenue (million) Forecast, by Application 2020 & 2033
- Table 52: Nordics Tuna Peptide Powder Volume (K) Forecast, by Application 2020 & 2033
- Table 53: Rest of Europe Tuna Peptide Powder Revenue (million) Forecast, by Application 2020 & 2033
- Table 54: Rest of Europe Tuna Peptide Powder Volume (K) Forecast, by Application 2020 & 2033
- Table 55: Global Tuna Peptide Powder Revenue million Forecast, by Application 2020 & 2033
- Table 56: Global Tuna Peptide Powder Volume K Forecast, by Application 2020 & 2033
- Table 57: Global Tuna Peptide Powder Revenue million Forecast, by Type 2020 & 2033
- Table 58: Global Tuna Peptide Powder Volume K Forecast, by Type 2020 & 2033
- Table 59: Global Tuna Peptide Powder Revenue million Forecast, by Country 2020 & 2033
- Table 60: Global Tuna Peptide Powder Volume K Forecast, by Country 2020 & 2033
- Table 61: Turkey Tuna Peptide Powder Revenue (million) Forecast, by Application 2020 & 2033
- Table 62: Turkey Tuna Peptide Powder Volume (K) Forecast, by Application 2020 & 2033
- Table 63: Israel Tuna Peptide Powder Revenue (million) Forecast, by Application 2020 & 2033
- Table 64: Israel Tuna Peptide Powder Volume (K) Forecast, by Application 2020 & 2033
- Table 65: GCC Tuna Peptide Powder Revenue (million) Forecast, by Application 2020 & 2033
- Table 66: GCC Tuna Peptide Powder Volume (K) Forecast, by Application 2020 & 2033
- Table 67: North Africa Tuna Peptide Powder Revenue (million) Forecast, by Application 2020 & 2033
- Table 68: North Africa Tuna Peptide Powder Volume (K) Forecast, by Application 2020 & 2033
- Table 69: South Africa Tuna Peptide Powder Revenue (million) Forecast, by Application 2020 & 2033
- Table 70: South Africa Tuna Peptide Powder Volume (K) Forecast, by Application 2020 & 2033
- Table 71: Rest of Middle East & Africa Tuna Peptide Powder Revenue (million) Forecast, by Application 2020 & 2033
- Table 72: Rest of Middle East & Africa Tuna Peptide Powder Volume (K) Forecast, by Application 2020 & 2033
- Table 73: Global Tuna Peptide Powder Revenue million Forecast, by Application 2020 & 2033
- Table 74: Global Tuna Peptide Powder Volume K Forecast, by Application 2020 & 2033
- Table 75: Global Tuna Peptide Powder Revenue million Forecast, by Type 2020 & 2033
- Table 76: Global Tuna Peptide Powder Volume K Forecast, by Type 2020 & 2033
- Table 77: Global Tuna Peptide Powder Revenue million Forecast, by Country 2020 & 2033
- Table 78: Global Tuna Peptide Powder Volume K Forecast, by Country 2020 & 2033
- Table 79: China Tuna Peptide Powder Revenue (million) Forecast, by Application 2020 & 2033
- Table 80: China Tuna Peptide Powder Volume (K) Forecast, by Application 2020 & 2033
- Table 81: India Tuna Peptide Powder Revenue (million) Forecast, by Application 2020 & 2033
- Table 82: India Tuna Peptide Powder Volume (K) Forecast, by Application 2020 & 2033
- Table 83: Japan Tuna Peptide Powder Revenue (million) Forecast, by Application 2020 & 2033
- Table 84: Japan Tuna Peptide Powder Volume (K) Forecast, by Application 2020 & 2033
- Table 85: South Korea Tuna Peptide Powder Revenue (million) Forecast, by Application 2020 & 2033
- Table 86: South Korea Tuna Peptide Powder Volume (K) Forecast, by Application 2020 & 2033
- Table 87: ASEAN Tuna Peptide Powder Revenue (million) Forecast, by Application 2020 & 2033
- Table 88: ASEAN Tuna Peptide Powder Volume (K) Forecast, by Application 2020 & 2033
- Table 89: Oceania Tuna Peptide Powder Revenue (million) Forecast, by Application 2020 & 2033
- Table 90: Oceania Tuna Peptide Powder Volume (K) Forecast, by Application 2020 & 2033
- Table 91: Rest of Asia Pacific Tuna Peptide Powder Revenue (million) Forecast, by Application 2020 & 2033
- Table 92: Rest of Asia Pacific Tuna Peptide Powder Volume (K) Forecast, by Application 2020 & 2033
Frequently Asked Questions
1. What is the projected Compound Annual Growth Rate (CAGR) of the Tuna Peptide Powder?
The projected CAGR is approximately 5.6%.
2. Which companies are prominent players in the Tuna Peptide Powder?
Key companies in the market include Creative Enzymes, Biomega Group, Matexcel, Seagarden AS, Lonza Group, Sopropeche, Symrise AG, Bolognani Srl, Vital Proteins LLC, Waitaki Biosciences, Yantai Jiahui Marine Biotechnology.
3. What are the main segments of the Tuna Peptide Powder?
The market segments include Application, Type.
4. Can you provide details about the market size?
The market size is estimated to be USD 776 million as of 2022.
5. What are some drivers contributing to market growth?
N/A
6. What are the notable trends driving market growth?
N/A
7. Are there any restraints impacting market growth?
N/A
8. Can you provide examples of recent developments in the market?
N/A
9. What pricing options are available for accessing the report?
Pricing options include single-user, multi-user, and enterprise licenses priced at USD 3950.00, USD 5925.00, and USD 7900.00 respectively.
10. Is the market size provided in terms of value or volume?
The market size is provided in terms of value, measured in million and volume, measured in K.
11. Are there any specific market keywords associated with the report?
Yes, the market keyword associated with the report is "Tuna Peptide Powder," which aids in identifying and referencing the specific market segment covered.
12. How do I determine which pricing option suits my needs best?
The pricing options vary based on user requirements and access needs. Individual users may opt for single-user licenses, while businesses requiring broader access may choose multi-user or enterprise licenses for cost-effective access to the report.
13. Are there any additional resources or data provided in the Tuna Peptide Powder report?
While the report offers comprehensive insights, it's advisable to review the specific contents or supplementary materials provided to ascertain if additional resources or data are available.
14. How can I stay updated on further developments or reports in the Tuna Peptide Powder?
To stay informed about further developments, trends, and reports in the Tuna Peptide Powder, consider subscribing to industry newsletters, following relevant companies and organizations, or regularly checking reputable industry news sources and publications.
Methodology
Step 1 - Identification of Relevant Samples Size from Population Database


Step 2 - Approaches for Defining Global Market Size (Value, Volume* & Price*)

Note*: In applicable scenarios
Step 3 - Data Sources
Primary Research
- Web Analytics
- Survey Reports
- Research Institute
- Latest Research Reports
- Opinion Leaders
Secondary Research
- Annual Reports
- White Paper
- Latest Press Release
- Industry Association
- Paid Database
- Investor Presentations

Step 4 - Data Triangulation
Involves using different sources of information in order to increase the validity of a study
These sources are likely to be stakeholders in a program - participants, other researchers, program staff, other community members, and so on.
Then we put all data in single framework & apply various statistical tools to find out the dynamic on the market.
During the analysis stage, feedback from the stakeholder groups would be compared to determine areas of agreement as well as areas of divergence