

Key Insights
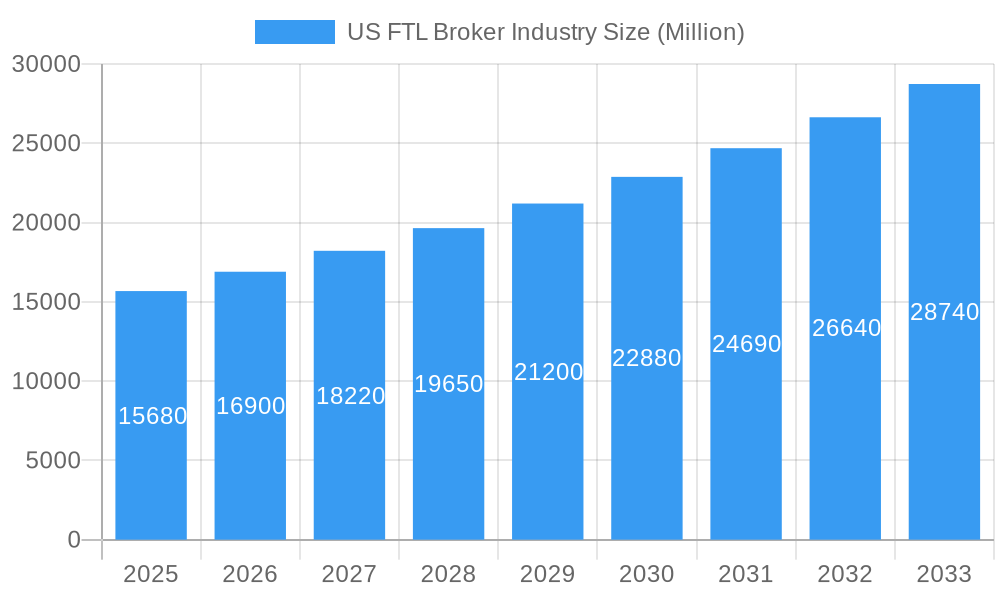
The US full truckload (FTL) brokerage industry, valued at $15.68 billion in 2025, is experiencing robust growth, projected to expand at a compound annual growth rate (CAGR) of 7.86% from 2025 to 2033. This expansion is driven by several key factors. The increasing complexity of supply chains, particularly within the manufacturing and automotive sectors, necessitates the use of specialized logistics providers like FTL brokers to manage transportation efficiency and costs. E-commerce growth continues to fuel demand for expedited shipping solutions, a key service offered by FTL brokers. Technological advancements, such as advanced route optimization software and improved transportation management systems (TMS), are streamlining operations and improving cost-effectiveness for both brokers and their clients. Furthermore, a growing focus on sustainability and carbon reduction within the transportation sector is prompting businesses to seek FTL brokers who can optimize routes and leverage fuel-efficient technologies, thereby enhancing their environmental footprint. However, challenges remain. Fluctuating fuel prices and driver shortages represent significant headwinds for the industry, impacting profitability and operational efficiency. Regulatory changes and increased insurance costs also add to the operational complexity.
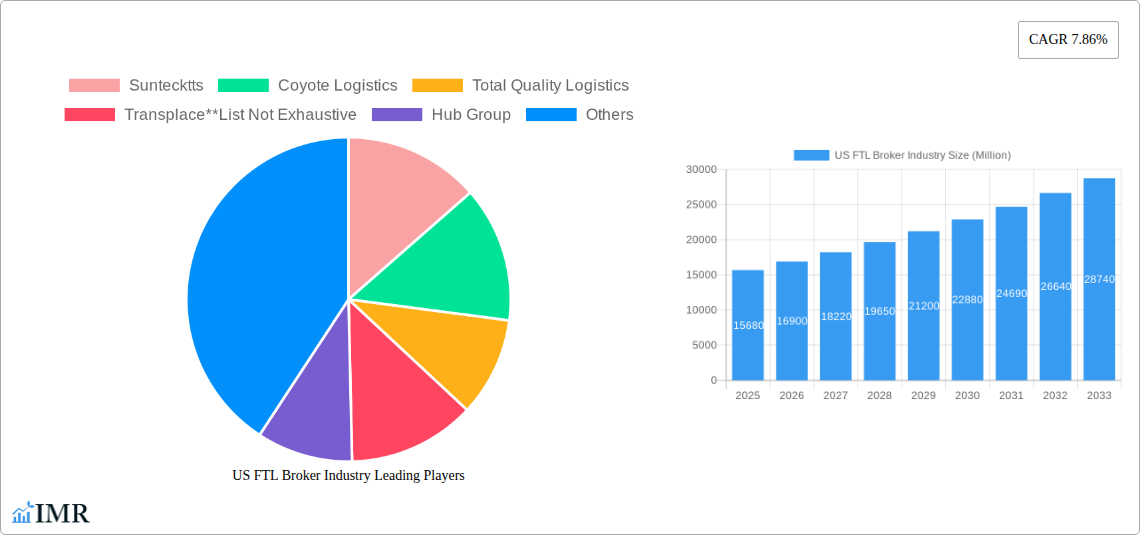
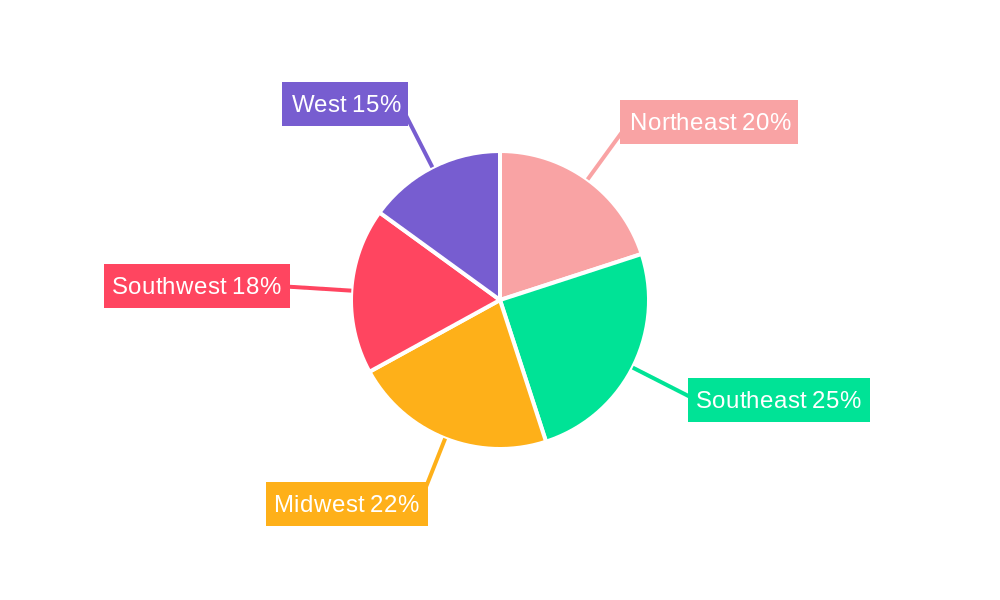
US FTL Broker Industry Market Size (In Billion)
The industry's segmentation reveals significant opportunities within various end-user sectors. Manufacturing and automotive remain dominant segments, while the oil and gas, mining and quarrying, and construction sectors are experiencing considerable growth, driven by infrastructure projects and resource extraction activities. The competitive landscape is characterized by a mix of large multinational companies such as C.H. Robinson, Schneider, and XPO Logistics, alongside smaller, regionally focused businesses. These companies compete on factors like pricing, service quality, technological capabilities, and network reach. Future growth will likely depend on companies' ability to leverage technology to enhance efficiency, expand their service offerings to meet evolving customer needs, and effectively manage the operational challenges posed by driver shortages and fluctuating fuel costs. Regional variations within the US market will likely exist, reflecting differences in economic activity and infrastructure across regions like the Northeast, Southeast, Midwest, Southwest, and West. The continued growth of the e-commerce sector and ongoing investment in infrastructure development will remain critical drivers for long-term expansion.
US FTL Broker Industry Company Market Share
US FTL Broker Industry Market Report: 2019-2033
This comprehensive report provides an in-depth analysis of the US Full Truckload (FTL) Broker industry, encompassing market dynamics, growth trends, key players, and future outlook. The report covers the period 2019-2033, with a focus on the base year 2025 and forecast period 2025-2033. This critical analysis is essential for industry professionals, investors, and anyone seeking to understand this dynamic and ever-evolving sector. The parent market is the broader US Logistics Industry, and the child market is the US FTL Broker segment. Market values are presented in millions of US dollars.
US FTL Broker Industry Market Dynamics & Structure
The US FTL Broker industry is characterized by a moderately concentrated market structure with several large players vying for market share alongside numerous smaller, regional brokers. Technological advancements such as digital freight matching platforms, advanced analytics, and automation are key innovation drivers, while regulatory compliance (e.g., FMCSA regulations) shapes the operational landscape. Substitute products include private fleets and direct carrier contracts, but the convenience and efficiency of FTL brokers continue to drive demand. The end-user demographics are diverse, spanning various sectors with varying transportation needs. Significant M&A activity further consolidates the market.
- Market Concentration: Highly concentrated, with the top 10 players holding approximately xx% of the market share in 2024.
- Technological Innovation: Digital freight matching, AI-powered route optimization, and blockchain technology are driving efficiency and transparency.
- Regulatory Framework: FMCSA regulations heavily influence operations and compliance, impacting smaller players disproportionately.
- Competitive Substitutes: Private fleets and direct carrier contracts offer alternatives, but brokers often provide superior flexibility and cost-effectiveness.
- M&A Trends: Consolidation through mergers and acquisitions is prevalent, aiming to increase scale and market reach. The volume of M&A deals in the last five years totaled approximately xx deals.
US FTL Broker Industry Growth Trends & Insights
The US FTL Broker market experienced significant growth between 2019 and 2024, driven by the rise of e-commerce, fluctuating fuel prices and increasing demand for efficient and reliable transportation solutions. The market is projected to continue its expansion at a Compound Annual Growth Rate (CAGR) of xx% during the forecast period (2025-2033), reaching a market size of xx million in 2033. This growth is fueled by technological advancements, changing consumer behavior (demand for faster delivery), and the evolving needs of diverse industries. Increased adoption of digital platforms and improved supply chain visibility are further driving penetration rates, with an estimated xx% market penetration by 2033.
Dominant Regions, Countries, or Segments in US FTL Broker Industry
The Manufacturing and Automotive sector represents the largest segment of the US FTL Broker market, driven by high volumes of goods transportation and the need for specialized logistics solutions. This dominance stems from the sector's significant production and distribution footprint across the US. Other significant end-user segments include Oil and Gas, Distributive Trade, and Construction. The South and Midwest regions exhibit the strongest growth, driven by robust manufacturing and industrial activity.
- Key Drivers:
- High volume of freight movement in Manufacturing and Automotive.
- Robust infrastructure and transportation networks in the South and Midwest.
- Favorable economic policies supporting industrial growth.
- Dominance Factors:
- Market share of Manufacturing and Automotive: xx%
- Growth potential fueled by continued production expansion and increased consumer spending.
US FTL Broker Industry Product Landscape
The FTL brokerage product landscape is evolving rapidly, with a shift towards integrated digital platforms providing real-time visibility, advanced analytics, and automated processes. Brokers now offer various value-added services such as load optimization, shipment tracking, and carrier management, enhancing efficiency and supply chain visibility. Unique selling propositions include specialization in specific industry verticals, advanced technology adoption, and dedicated customer service. Technological advancements like AI-powered forecasting and predictive analytics are revolutionizing the industry, improving route optimization and enhancing overall efficiency.
Key Drivers, Barriers & Challenges in US FTL Broker Industry
Key Drivers: E-commerce boom fueling increased demand for efficient freight transportation; technological advancements enhancing operational efficiency and transparency; favorable economic conditions supporting industrial growth.
Challenges & Restraints: Fluctuating fuel prices impacting profitability; driver shortages limiting capacity; intense competition among brokers; regulatory compliance complexities; supply chain disruptions and unforeseen external events. The estimated impact of these challenges on the market growth is approximately xx% reduction in the projected market size.
Emerging Opportunities in US FTL Broker Industry
Emerging opportunities lie in the adoption of blockchain technology for enhanced security and transparency, specialization in niche sectors (e.g., specialized freight), expansion into underserved regions, and leveraging big data analytics for predictive capabilities. The growing adoption of sustainable logistics practices also presents significant opportunities for FTL brokers.
Growth Accelerators in the US FTL Broker Industry
Technological breakthroughs such as AI-powered route optimization and predictive analytics are crucial catalysts for long-term growth. Strategic partnerships with technology providers and carriers expand reach and enhance service offerings. Expanding into underserved markets and developing specialized solutions for niche industries are critical growth strategies.
Key Players Shaping the US FTL Broker Industry Market
- Suntecktts
- Coyote Logistics (Coyote Logistics)
- Total Quality Logistics (Total Quality Logistics)
- Transplace (Transplace)
- Hub Group (Hub Group)
- Landstar System Inc (Landstar System Inc)
- CH Robinson (CH Robinson)
- BNSF Logistics LLC (BNSF Logistics LLC)
- XPO Logistics Inc (XPO Logistics Inc)
- Worldwide Express
- Schneider (Schneider)
- Echo Global Logistics (Echo Global Logistics)
- J B Hunt Transport Inc (J B Hunt Transport Inc)
- Kag Logistics Inc
- Globaltranz
Notable Milestones in US FTL Broker Industry Sector
- Sept 2023: Rhenus acquires ITS Logistics Hungary KFT, expanding its air freight services and Hungarian market presence.
- Sept 2023: Rhenus Group acquires BLU Logistics, significantly boosting its LATAM presence and Asia-LATAM trade lane capabilities.
In-Depth US FTL Broker Industry Market Outlook
The US FTL Broker industry is poised for sustained growth, driven by ongoing technological advancements, increasing demand for efficient logistics solutions, and continued consolidation within the market. Strategic partnerships, expansion into new markets, and the adoption of innovative technologies will shape the future of the industry, presenting significant opportunities for established players and new entrants alike. The market’s potential for expansion hinges on the ability of brokers to adapt to evolving industry dynamics and leverage technological advancements for improved efficiency and customer service.
US FTL Broker Industry Segmentation
-
1. End User
- 1.1. Manufacturing and Automotive
- 1.2. Oil and Gas, Mining, and Quarrying
- 1.3. Agriculture Fishing, and Forestry
- 1.4. Construction
- 1.5. Distributive Trade
- 1.6. Other End Users
US FTL Broker Industry Segmentation By Geography
-
1. North America
- 1.1. United States
- 1.2. Canada
- 1.3. Mexico
-
2. South America
- 2.1. Brazil
- 2.2. Argentina
- 2.3. Rest of South America
-
3. Europe
- 3.1. United Kingdom
- 3.2. Germany
- 3.3. France
- 3.4. Italy
- 3.5. Spain
- 3.6. Russia
- 3.7. Benelux
- 3.8. Nordics
- 3.9. Rest of Europe
-
4. Middle East & Africa
- 4.1. Turkey
- 4.2. Israel
- 4.3. GCC
- 4.4. North Africa
- 4.5. South Africa
- 4.6. Rest of Middle East & Africa
-
5. Asia Pacific
- 5.1. China
- 5.2. India
- 5.3. Japan
- 5.4. South Korea
- 5.5. ASEAN
- 5.6. Oceania
- 5.7. Rest of Asia Pacific
US FTL Broker Industry Regional Market Share
Geographic Coverage of US FTL Broker Industry
US FTL Broker Industry REPORT HIGHLIGHTS
| Aspects | Details |
|---|---|
| Study Period | 2020-2034 |
| Base Year | 2025 |
| Estimated Year | 2026 |
| Forecast Period | 2026-2034 |
| Historical Period | 2020-2025 |
| Growth Rate | CAGR of 7.86% from 2020-2034 |
| Segmentation |
|
Table of Contents
- 1. Introduction
- 1.1. Research Scope
- 1.2. Market Segmentation
- 1.3. Research Objective
- 1.4. Definitions and Assumptions
- 2. Executive Summary
- 2.1. Market Snapshot
- 3. Market Dynamics
- 3.1. Market Drivers
- 3.2. Market Restrains
- 3.3. Market Trends
- 3.4. Market Opportunities
- 4. Market Factor Analysis
- 4.1. Porters Five Forces
- 4.1.1. Bargaining Power of Suppliers
- 4.1.2. Bargaining Power of Buyers
- 4.1.3. Threat of New Entrants
- 4.1.4. Threat of Substitutes
- 4.1.5. Competitive Rivalry
- 4.2. PESTEL analysis
- 4.3. BCG Analysis
- 4.3.1. Stars (High Growth, High Market Share)
- 4.3.2. Cash Cows (Low Growth, High Market Share)
- 4.3.3. Question Mark (High Growth, Low Market Share)
- 4.3.4. Dogs (Low Growth, Low Market Share)
- 4.4. Ansoff Matrix Analysis
- 4.5. Supply Chain Analysis
- 4.6. Regulatory Landscape
- 4.7. Current Market Potential and Opportunity Assessment (TAM–SAM–SOM Framework)
- 4.8. IMR Analyst Note
- 4.1. Porters Five Forces
- 5. Market Analysis, Insights and Forecast 2021-2033
- 5.1. Market Analysis, Insights and Forecast - by End User
- 5.1.1. Manufacturing and Automotive
- 5.1.2. Oil and Gas, Mining, and Quarrying
- 5.1.3. Agriculture Fishing, and Forestry
- 5.1.4. Construction
- 5.1.5. Distributive Trade
- 5.1.6. Other End Users
- 5.2. Market Analysis, Insights and Forecast - by Region
- 5.2.1. North America
- 5.2.2. South America
- 5.2.3. Europe
- 5.2.4. Middle East & Africa
- 5.2.5. Asia Pacific
- 5.1. Market Analysis, Insights and Forecast - by End User
- 6. Global US FTL Broker Industry Analysis, Insights and Forecast, 2021-2033
- 6.1. Market Analysis, Insights and Forecast - by End User
- 6.1.1. Manufacturing and Automotive
- 6.1.2. Oil and Gas, Mining, and Quarrying
- 6.1.3. Agriculture Fishing, and Forestry
- 6.1.4. Construction
- 6.1.5. Distributive Trade
- 6.1.6. Other End Users
- 6.1. Market Analysis, Insights and Forecast - by End User
- 7. North America US FTL Broker Industry Analysis, Insights and Forecast, 2020-2032
- 7.1. Market Analysis, Insights and Forecast - by End User
- 7.1.1. Manufacturing and Automotive
- 7.1.2. Oil and Gas, Mining, and Quarrying
- 7.1.3. Agriculture Fishing, and Forestry
- 7.1.4. Construction
- 7.1.5. Distributive Trade
- 7.1.6. Other End Users
- 7.1. Market Analysis, Insights and Forecast - by End User
- 8. South America US FTL Broker Industry Analysis, Insights and Forecast, 2020-2032
- 8.1. Market Analysis, Insights and Forecast - by End User
- 8.1.1. Manufacturing and Automotive
- 8.1.2. Oil and Gas, Mining, and Quarrying
- 8.1.3. Agriculture Fishing, and Forestry
- 8.1.4. Construction
- 8.1.5. Distributive Trade
- 8.1.6. Other End Users
- 8.1. Market Analysis, Insights and Forecast - by End User
- 9. Europe US FTL Broker Industry Analysis, Insights and Forecast, 2020-2032
- 9.1. Market Analysis, Insights and Forecast - by End User
- 9.1.1. Manufacturing and Automotive
- 9.1.2. Oil and Gas, Mining, and Quarrying
- 9.1.3. Agriculture Fishing, and Forestry
- 9.1.4. Construction
- 9.1.5. Distributive Trade
- 9.1.6. Other End Users
- 9.1. Market Analysis, Insights and Forecast - by End User
- 10. Middle East & Africa US FTL Broker Industry Analysis, Insights and Forecast, 2020-2032
- 10.1. Market Analysis, Insights and Forecast - by End User
- 10.1.1. Manufacturing and Automotive
- 10.1.2. Oil and Gas, Mining, and Quarrying
- 10.1.3. Agriculture Fishing, and Forestry
- 10.1.4. Construction
- 10.1.5. Distributive Trade
- 10.1.6. Other End Users
- 10.1. Market Analysis, Insights and Forecast - by End User
- 11. Asia Pacific US FTL Broker Industry Analysis, Insights and Forecast, 2020-2032
- 11.1. Market Analysis, Insights and Forecast - by End User
- 11.1.1. Manufacturing and Automotive
- 11.1.2. Oil and Gas, Mining, and Quarrying
- 11.1.3. Agriculture Fishing, and Forestry
- 11.1.4. Construction
- 11.1.5. Distributive Trade
- 11.1.6. Other End Users
- 11.1. Market Analysis, Insights and Forecast - by End User
- 12. Competitive Analysis
- 12.1. Company Profiles
- 12.1.1 Suntecktts
- 12.1.1.1. Company Overview
- 12.1.1.2. Products
- 12.1.1.3. Company Financials
- 12.1.1.4. SWOT Analysis
- 12.1.2 Coyote Logistics
- 12.1.2.1. Company Overview
- 12.1.2.2. Products
- 12.1.2.3. Company Financials
- 12.1.2.4. SWOT Analysis
- 12.1.3 Total Quality Logistics
- 12.1.3.1. Company Overview
- 12.1.3.2. Products
- 12.1.3.3. Company Financials
- 12.1.3.4. SWOT Analysis
- 12.1.4 Transplace**List Not Exhaustive
- 12.1.4.1. Company Overview
- 12.1.4.2. Products
- 12.1.4.3. Company Financials
- 12.1.4.4. SWOT Analysis
- 12.1.5 Hub Group
- 12.1.5.1. Company Overview
- 12.1.5.2. Products
- 12.1.5.3. Company Financials
- 12.1.5.4. SWOT Analysis
- 12.1.6 Landstar System Inc
- 12.1.6.1. Company Overview
- 12.1.6.2. Products
- 12.1.6.3. Company Financials
- 12.1.6.4. SWOT Analysis
- 12.1.7 CH Robinson
- 12.1.7.1. Company Overview
- 12.1.7.2. Products
- 12.1.7.3. Company Financials
- 12.1.7.4. SWOT Analysis
- 12.1.8 BNSF Logistics LLC
- 12.1.8.1. Company Overview
- 12.1.8.2. Products
- 12.1.8.3. Company Financials
- 12.1.8.4. SWOT Analysis
- 12.1.9 XPO Logistics Inc
- 12.1.9.1. Company Overview
- 12.1.9.2. Products
- 12.1.9.3. Company Financials
- 12.1.9.4. SWOT Analysis
- 12.1.10 Worldwide Express
- 12.1.10.1. Company Overview
- 12.1.10.2. Products
- 12.1.10.3. Company Financials
- 12.1.10.4. SWOT Analysis
- 12.1.11 Schneider
- 12.1.11.1. Company Overview
- 12.1.11.2. Products
- 12.1.11.3. Company Financials
- 12.1.11.4. SWOT Analysis
- 12.1.12 Echo Global Logistics
- 12.1.12.1. Company Overview
- 12.1.12.2. Products
- 12.1.12.3. Company Financials
- 12.1.12.4. SWOT Analysis
- 12.1.13 J B Hunt Transport Inc
- 12.1.13.1. Company Overview
- 12.1.13.2. Products
- 12.1.13.3. Company Financials
- 12.1.13.4. SWOT Analysis
- 12.1.14 Kag Logistics Inc
- 12.1.14.1. Company Overview
- 12.1.14.2. Products
- 12.1.14.3. Company Financials
- 12.1.14.4. SWOT Analysis
- 12.1.15 Globaltranz
- 12.1.15.1. Company Overview
- 12.1.15.2. Products
- 12.1.15.3. Company Financials
- 12.1.15.4. SWOT Analysis
- 12.1.1 Suntecktts
- 12.2. Market Entropy
- 12.2.1 Company's Key Areas Served
- 12.2.2 Recent Developments
- 12.3. Company Market Share Analysis 2025
- 12.3.1 Top 5 Companies Market Share Analysis
- 12.3.2 Top 3 Companies Market Share Analysis
- 12.4. List of Potential Customers
- 13. Research Methodology
List of Figures
- Figure 1: Global US FTL Broker Industry Revenue Breakdown (Million, %) by Region 2025 & 2033
- Figure 2: North America US FTL Broker Industry Revenue (Million), by End User 2025 & 2033
- Figure 3: North America US FTL Broker Industry Revenue Share (%), by End User 2025 & 2033
- Figure 4: North America US FTL Broker Industry Revenue (Million), by Country 2025 & 2033
- Figure 5: North America US FTL Broker Industry Revenue Share (%), by Country 2025 & 2033
- Figure 6: South America US FTL Broker Industry Revenue (Million), by End User 2025 & 2033
- Figure 7: South America US FTL Broker Industry Revenue Share (%), by End User 2025 & 2033
- Figure 8: South America US FTL Broker Industry Revenue (Million), by Country 2025 & 2033
- Figure 9: South America US FTL Broker Industry Revenue Share (%), by Country 2025 & 2033
- Figure 10: Europe US FTL Broker Industry Revenue (Million), by End User 2025 & 2033
- Figure 11: Europe US FTL Broker Industry Revenue Share (%), by End User 2025 & 2033
- Figure 12: Europe US FTL Broker Industry Revenue (Million), by Country 2025 & 2033
- Figure 13: Europe US FTL Broker Industry Revenue Share (%), by Country 2025 & 2033
- Figure 14: Middle East & Africa US FTL Broker Industry Revenue (Million), by End User 2025 & 2033
- Figure 15: Middle East & Africa US FTL Broker Industry Revenue Share (%), by End User 2025 & 2033
- Figure 16: Middle East & Africa US FTL Broker Industry Revenue (Million), by Country 2025 & 2033
- Figure 17: Middle East & Africa US FTL Broker Industry Revenue Share (%), by Country 2025 & 2033
- Figure 18: Asia Pacific US FTL Broker Industry Revenue (Million), by End User 2025 & 2033
- Figure 19: Asia Pacific US FTL Broker Industry Revenue Share (%), by End User 2025 & 2033
- Figure 20: Asia Pacific US FTL Broker Industry Revenue (Million), by Country 2025 & 2033
- Figure 21: Asia Pacific US FTL Broker Industry Revenue Share (%), by Country 2025 & 2033
List of Tables
- Table 1: Global US FTL Broker Industry Revenue Million Forecast, by End User 2020 & 2033
- Table 2: Global US FTL Broker Industry Revenue Million Forecast, by Region 2020 & 2033
- Table 3: Global US FTL Broker Industry Revenue Million Forecast, by End User 2020 & 2033
- Table 4: Global US FTL Broker Industry Revenue Million Forecast, by Country 2020 & 2033
- Table 5: United States US FTL Broker Industry Revenue (Million) Forecast, by Application 2020 & 2033
- Table 6: Canada US FTL Broker Industry Revenue (Million) Forecast, by Application 2020 & 2033
- Table 7: Mexico US FTL Broker Industry Revenue (Million) Forecast, by Application 2020 & 2033
- Table 8: Global US FTL Broker Industry Revenue Million Forecast, by End User 2020 & 2033
- Table 9: Global US FTL Broker Industry Revenue Million Forecast, by Country 2020 & 2033
- Table 10: Brazil US FTL Broker Industry Revenue (Million) Forecast, by Application 2020 & 2033
- Table 11: Argentina US FTL Broker Industry Revenue (Million) Forecast, by Application 2020 & 2033
- Table 12: Rest of South America US FTL Broker Industry Revenue (Million) Forecast, by Application 2020 & 2033
- Table 13: Global US FTL Broker Industry Revenue Million Forecast, by End User 2020 & 2033
- Table 14: Global US FTL Broker Industry Revenue Million Forecast, by Country 2020 & 2033
- Table 15: United Kingdom US FTL Broker Industry Revenue (Million) Forecast, by Application 2020 & 2033
- Table 16: Germany US FTL Broker Industry Revenue (Million) Forecast, by Application 2020 & 2033
- Table 17: France US FTL Broker Industry Revenue (Million) Forecast, by Application 2020 & 2033
- Table 18: Italy US FTL Broker Industry Revenue (Million) Forecast, by Application 2020 & 2033
- Table 19: Spain US FTL Broker Industry Revenue (Million) Forecast, by Application 2020 & 2033
- Table 20: Russia US FTL Broker Industry Revenue (Million) Forecast, by Application 2020 & 2033
- Table 21: Benelux US FTL Broker Industry Revenue (Million) Forecast, by Application 2020 & 2033
- Table 22: Nordics US FTL Broker Industry Revenue (Million) Forecast, by Application 2020 & 2033
- Table 23: Rest of Europe US FTL Broker Industry Revenue (Million) Forecast, by Application 2020 & 2033
- Table 24: Global US FTL Broker Industry Revenue Million Forecast, by End User 2020 & 2033
- Table 25: Global US FTL Broker Industry Revenue Million Forecast, by Country 2020 & 2033
- Table 26: Turkey US FTL Broker Industry Revenue (Million) Forecast, by Application 2020 & 2033
- Table 27: Israel US FTL Broker Industry Revenue (Million) Forecast, by Application 2020 & 2033
- Table 28: GCC US FTL Broker Industry Revenue (Million) Forecast, by Application 2020 & 2033
- Table 29: North Africa US FTL Broker Industry Revenue (Million) Forecast, by Application 2020 & 2033
- Table 30: South Africa US FTL Broker Industry Revenue (Million) Forecast, by Application 2020 & 2033
- Table 31: Rest of Middle East & Africa US FTL Broker Industry Revenue (Million) Forecast, by Application 2020 & 2033
- Table 32: Global US FTL Broker Industry Revenue Million Forecast, by End User 2020 & 2033
- Table 33: Global US FTL Broker Industry Revenue Million Forecast, by Country 2020 & 2033
- Table 34: China US FTL Broker Industry Revenue (Million) Forecast, by Application 2020 & 2033
- Table 35: India US FTL Broker Industry Revenue (Million) Forecast, by Application 2020 & 2033
- Table 36: Japan US FTL Broker Industry Revenue (Million) Forecast, by Application 2020 & 2033
- Table 37: South Korea US FTL Broker Industry Revenue (Million) Forecast, by Application 2020 & 2033
- Table 38: ASEAN US FTL Broker Industry Revenue (Million) Forecast, by Application 2020 & 2033
- Table 39: Oceania US FTL Broker Industry Revenue (Million) Forecast, by Application 2020 & 2033
- Table 40: Rest of Asia Pacific US FTL Broker Industry Revenue (Million) Forecast, by Application 2020 & 2033
Frequently Asked Questions
1. What is the projected Compound Annual Growth Rate (CAGR) of the US FTL Broker Industry?
The projected CAGR is approximately 7.86%.
2. Which companies are prominent players in the US FTL Broker Industry?
Key companies in the market include Suntecktts, Coyote Logistics, Total Quality Logistics, Transplace**List Not Exhaustive, Hub Group, Landstar System Inc, CH Robinson, BNSF Logistics LLC, XPO Logistics Inc, Worldwide Express, Schneider, Echo Global Logistics, J B Hunt Transport Inc, Kag Logistics Inc, Globaltranz.
3. What are the main segments of the US FTL Broker Industry?
The market segments include End User.
4. Can you provide details about the market size?
The market size is estimated to be USD 15.68 Million as of 2022.
5. What are some drivers contributing to market growth?
4.; Increasing demand for efficient transportation4.; Growing eCommerce industry.
6. What are the notable trends driving market growth?
Fluctuating Fuel prices Hampering the Growth of the Market.
7. Are there any restraints impacting market growth?
4.; Intense competition affecting the market4.; Fluctuating fuel prices.
8. Can you provide examples of recent developments in the market?
Sept 2023: Rhenus continues its growth trajectory with the strategic acquisition of the Hungarian freight forwarder ITS Logistics Hungary KFT. This move will enable them to better serve their customer's needs, particularly in relation to air freight services, while also expanding their reach in the Hungarian market.
9. What pricing options are available for accessing the report?
Pricing options include single-user, multi-user, and enterprise licenses priced at USD 3800, USD 4500, and USD 5800 respectively.
10. Is the market size provided in terms of value or volume?
The market size is provided in terms of value, measured in Million.
11. Are there any specific market keywords associated with the report?
Yes, the market keyword associated with the report is "US FTL Broker Industry," which aids in identifying and referencing the specific market segment covered.
12. How do I determine which pricing option suits my needs best?
The pricing options vary based on user requirements and access needs. Individual users may opt for single-user licenses, while businesses requiring broader access may choose multi-user or enterprise licenses for cost-effective access to the report.
13. Are there any additional resources or data provided in the US FTL Broker Industry report?
While the report offers comprehensive insights, it's advisable to review the specific contents or supplementary materials provided to ascertain if additional resources or data are available.
14. How can I stay updated on further developments or reports in the US FTL Broker Industry?
To stay informed about further developments, trends, and reports in the US FTL Broker Industry, consider subscribing to industry newsletters, following relevant companies and organizations, or regularly checking reputable industry news sources and publications.
Methodology
Step 1 - Identification of Relevant Samples Size from Population Database


Step 2 - Approaches for Defining Global Market Size (Value, Volume* & Price*)

Note*: In applicable scenarios
Step 3 - Data Sources
Primary Research
- Web Analytics
- Survey Reports
- Research Institute
- Latest Research Reports
- Opinion Leaders
Secondary Research
- Annual Reports
- White Paper
- Latest Press Release
- Industry Association
- Paid Database
- Investor Presentations

Step 4 - Data Triangulation
Involves using different sources of information in order to increase the validity of a study
These sources are likely to be stakeholders in a program - participants, other researchers, program staff, other community members, and so on.
Then we put all data in single framework & apply various statistical tools to find out the dynamic on the market.
During the analysis stage, feedback from the stakeholder groups would be compared to determine areas of agreement as well as areas of divergence