

Key Insights
The U.S. processed meats market is projected for significant expansion, anticipating a market size of $3.16 billion by 2025. The market is forecast to grow at a Compound Annual Growth Rate (CAGR) of 3.45% from 2025 through 2033. This growth is propelled by evolving consumer preferences and dynamic retail environments. Key drivers include the rising demand for convenient, ready-to-eat protein options, influenced by increasingly busy lifestyles and population growth. Product innovations, such as healthier, lower-sodium, and plant-based meat alternatives, are broadening consumer appeal and contributing to market dynamism. The increasing popularity of premium and artisanal processed meats also supports market vitality, catering to consumers seeking unique and high-quality offerings.
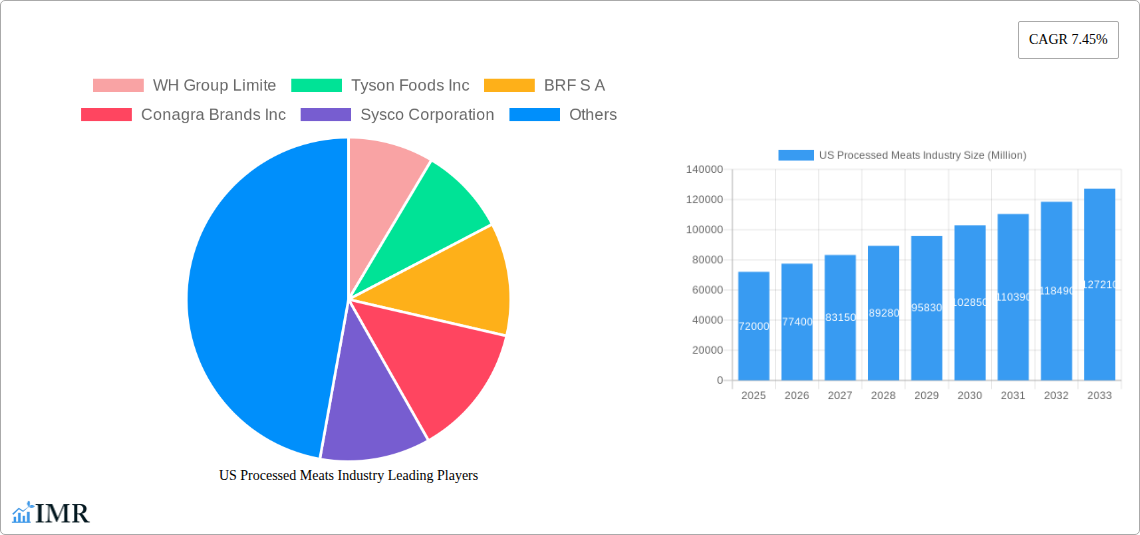
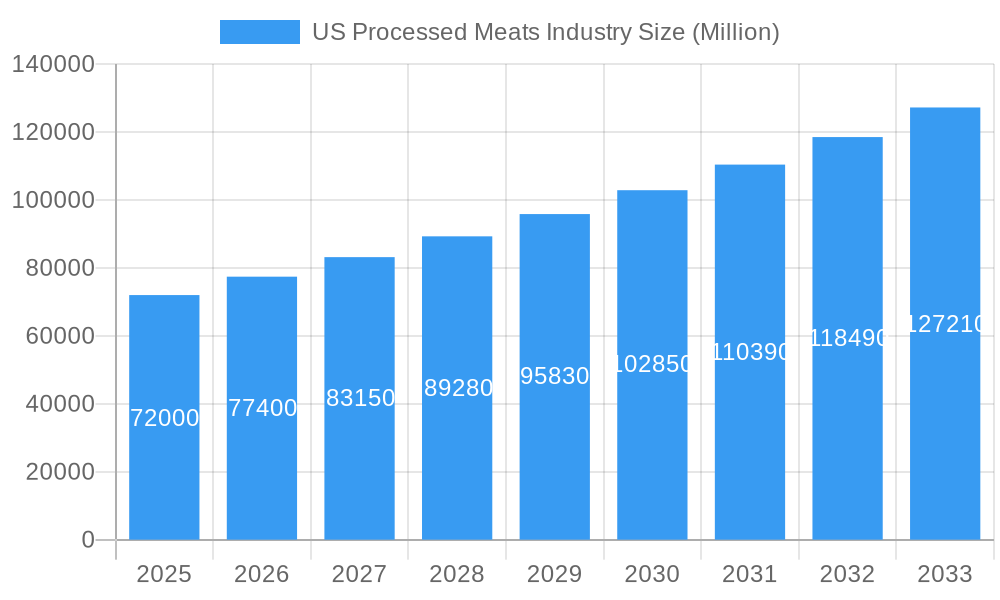
US Processed Meats Industry Market Size (In Billion)
Market expansion is further influenced by the growth of online retail channels and the increasing importance of the off-trade distribution segment, particularly supermarkets and hypermarkets, which provide extensive product selections. While these factors drive growth, potential restraints include growing consumer awareness of the health implications of processed meat consumption, leading to a shift towards fresh or minimally processed alternatives, and potential supply chain disruptions affecting raw material availability and cost. Nevertheless, the market's inherent resilience, ongoing innovation, and strategic initiatives by major players like WH Group Limited, Tyson Foods Inc., and JBS SA are expected to sustain its upward trajectory, with North America continuing to be a leading region.
US Processed Meats Industry Company Market Share
US Processed Meats Industry: Market Dynamics, Growth Trends, and Competitive Landscape (2019–2033)
This comprehensive report offers an in-depth analysis of the US Processed Meats Industry, providing critical insights into market dynamics, growth trajectories, and the competitive landscape. Covering a study period from 2019 to 2033, with a base and estimated year of 2025, this report is an indispensable resource for industry stakeholders seeking to understand and capitalize on the evolving processed meats market. We delve into market segmentation by meat type (Beef, Mutton, Pork, Poultry, Other Meat) and distribution channels (Off-Trade, On-Trade), examining parent and child markets with data presented in millions of units.
US Processed Meats Industry Market Dynamics & Structure
The US Processed Meats Industry exhibits a moderately concentrated market structure, with leading players like WH Group Limited, Tyson Foods Inc., and JBS SA holding significant market shares. Technological innovation is a key driver, evidenced by advancements in processing techniques, shelf-life extension, and the development of value-added products such as ready-to-eat meals and premium sausages. Stringent regulatory frameworks, including food safety standards set by the USDA, influence product development and manufacturing processes, acting as both a barrier and a driver for innovation. Competitive product substitutes, ranging from plant-based alternatives to fresh meat, present an ongoing challenge. End-user demographics are shifting, with a growing demand for convenient, healthy, and ethically sourced processed meat options. Mergers and acquisitions (M&A) remain a prevalent strategy for market consolidation and expansion.
- Market Concentration: Dominated by a few key players, but with room for niche market growth.
- Technological Innovation: Focus on efficiency, safety, product differentiation, and convenience.
- Regulatory Frameworks: USDA regulations are paramount, impacting production and labeling.
- Competitive Substitutes: Plant-based meats and fresh meat alternatives are gaining traction.
- End-User Demographics: Increasing demand for health-conscious, sustainable, and convenient options.
- M&A Trends: Ongoing consolidation to enhance market presence and product portfolios.
US Processed Meats Industry Growth Trends & Insights
The US Processed Meats Industry is poised for sustained growth, driven by evolving consumer preferences and robust demand. The market size is projected to expand significantly from 2025 through 2033, fueled by factors such as convenience, affordability, and the introduction of innovative product formulations. Adoption rates for value-added and specialty processed meats are steadily increasing as consumers seek more sophisticated and diverse options. Technological disruptions, including advancements in automation and packaging, are enhancing production efficiency and product quality. Shifts in consumer behavior, such as a greater emphasis on health and wellness, are influencing product development towards reduced sodium, lower fat, and natural ingredient options. The CAGR is estimated to be between 4.5% and 5.5% over the forecast period. Market penetration of processed meats, particularly in convenient formats and premium segments, is expected to deepen.
Dominant Regions, Countries, or Segments in US Processed Meats Industry
The Poultry segment stands out as a dominant force within the US Processed Meats Industry, driven by its versatility, perceived health benefits, and competitive pricing. This segment, encompassing a wide array of products from chicken nuggets to deli-sliced turkey, caters to a broad consumer base across all age groups. The Off-Trade distribution channel, particularly Supermarkets and Hypermarkets, remains the primary avenue for processed meat sales due to their extensive reach and product variety. The Online Channel is experiencing rapid growth, offering convenience and a wider selection to consumers. Economic policies supporting agricultural production and consumer spending power contribute significantly to the growth of this segment.
- Dominant Segment (Type): Poultry, due to its broad appeal and affordability.
- Dominant Segment (Distribution Channel): Off-Trade, with Supermarkets and Hypermarkets leading, and a strong surge in Online Channel.
- Key Drivers for Poultry:
- Consumer preference for perceived healthier protein.
- Versatility in culinary applications.
- Cost-effectiveness compared to other meats.
- Key Drivers for Off-Trade:
- Extensive consumer reach and accessibility.
- Wide product assortment and competitive pricing strategies.
- Growth of e-commerce platforms for grocery delivery.
US Processed Meats Industry Product Landscape
Innovation in the US Processed Meats Industry centers on enhancing flavor profiles, improving nutritional content, and offering greater convenience. Product developments include the introduction of gourmet sausages, artisanal deli meats, and ready-to-heat meal components. Performance metrics are increasingly focused on shelf-life extension through advanced preservation techniques and the reduction of artificial additives. Unique selling propositions often revolve around natural ingredients, reduced sodium content, and the incorporation of diverse global flavors. Technological advancements are enabling the creation of healthier yet indulgent processed meat options, appealing to health-conscious consumers without compromising on taste.
Key Drivers, Barriers & Challenges in US Processed Meats Industry
Key Drivers:
- Convenience and Time-Saving: Processed meats offer ready-to-eat or quick-preparation options for busy consumers.
- Affordability: Compared to fresh meat cuts, processed meats are often more budget-friendly.
- Product Innovation: Continuous introduction of new flavors, formats, and value-added products.
- Growing Demand for Protein: Increased awareness of protein's health benefits.
Barriers & Challenges:
- Health Concerns: Negative consumer perception regarding high sodium, fat, and preservatives.
- Competition from Plant-Based Alternatives: Growing popularity and innovation in the vegan and vegetarian meat substitute market.
- Supply Chain Volatility: Fluctuations in raw material prices (livestock, feed) and potential disruptions.
- Regulatory Scrutiny: Stringent food safety and labeling regulations can increase operational costs.
Emerging Opportunities in US Processed Meats Industry
Emerging opportunities in the US Processed Meats Industry lie in catering to niche markets and evolving consumer demands. There is significant potential in developing premium, artisanal processed meats with unique flavor profiles and ethically sourced ingredients. The demand for plant-based and hybrid meat products is rapidly expanding, presenting an opportunity for traditional players to innovate or acquire expertise. Furthermore, the "better-for-you" trend presents a chance to reformulate existing products with reduced sodium, less fat, and natural preservatives, appealing to health-conscious consumers. Untapped markets may also exist in specialized dietary needs, such as gluten-free or allergen-friendly processed meat options.
Growth Accelerators in the US Processed Meats Industry Industry
Technological breakthroughs in processing and preservation are key accelerators for long-term growth in the US Processed Meats Industry. Strategic partnerships between meat processors and ingredient suppliers can lead to the development of healthier and more appealing products. Market expansion strategies, including increased penetration into underserved regions and the exploration of international markets, will further drive growth. The industry's ability to adapt to consumer trends, such as the demand for sustainable sourcing and transparent supply chains, will also be crucial for sustained expansion.
Key Players Shaping the US Processed Meats Industry Market
- WH Group Limited
- Tyson Foods Inc.
- BRF S.A.
- Conagra Brands Inc.
- Sysco Corporation
- The Kraft Heinz Company
- Hormel Foods Corporation
- Cargill Inc.
- Marfrig Global Foods S.A.
- Maple Leaf Foods
- JBS SA
Notable Milestones in US Processed Meats Industry Sector
- May 2023: Tyson Foods Claryville announced its newly expanded cocktail sausage manufacturing capacity, allowing the company to meet high customer demand for its Hillshire Farm brand products. This USD 83 million expansion will add 15,000 square feet to its 342,000 square foot facility and state-of-the-art equipment to increase production by 50% to better serve customers.
- April 2023: The makers of the HERDEZ® brand announced the launch of its HERDEZ™ Mexican Refrigerated Entrées line with two delicious varieties, including HERDEZ™ Chicken Shredded in Mild Chipotle Sauce and HERDEZ™ Carnitas Slow Cooked Pork.
- March 2023: Tyson® brand introduces chicken sandwiches and sliders, bringing restaurant-quality taste to home. The new Tyson Chicken Breast Sandwiches and Sliders are available in Original and Spicy. The new product is available in the frozen snacks section at retailers nationwide.
In-Depth US Processed Meats Industry Market Outlook
The US Processed Meats Industry market outlook is characterized by significant potential for future growth, driven by a confluence of consumer demand and industry innovation. Growth accelerators include the ongoing consumer pursuit of convenient protein sources, coupled with manufacturers' commitment to product diversification and premiumization. Strategic opportunities lie in leveraging technological advancements for enhanced product quality and safety, as well as responding to the escalating demand for healthier, sustainably sourced options. The industry's ability to navigate regulatory landscapes and adapt to evolving dietary trends will be pivotal in realizing its full market potential and solidifying its position in the food sector.
US Processed Meats Industry Segmentation
-
1. Type
- 1.1. Beef
- 1.2. Mutton
- 1.3. Pork
- 1.4. Poultry
- 1.5. Other Meat
-
2. Distribution Channel
-
2.1. Off-Trade
- 2.1.1. Convenience Stores
- 2.1.2. Online Channel
- 2.1.3. Supermarkets and Hypermarkets
- 2.1.4. Others
- 2.2. On-Trade
-
2.1. Off-Trade
US Processed Meats Industry Segmentation By Geography
-
1. North America
- 1.1. United States
- 1.2. Canada
- 1.3. Mexico
-
2. South America
- 2.1. Brazil
- 2.2. Argentina
- 2.3. Rest of South America
-
3. Europe
- 3.1. United Kingdom
- 3.2. Germany
- 3.3. France
- 3.4. Italy
- 3.5. Spain
- 3.6. Russia
- 3.7. Benelux
- 3.8. Nordics
- 3.9. Rest of Europe
-
4. Middle East & Africa
- 4.1. Turkey
- 4.2. Israel
- 4.3. GCC
- 4.4. North Africa
- 4.5. South Africa
- 4.6. Rest of Middle East & Africa
-
5. Asia Pacific
- 5.1. China
- 5.2. India
- 5.3. Japan
- 5.4. South Korea
- 5.5. ASEAN
- 5.6. Oceania
- 5.7. Rest of Asia Pacific
US Processed Meats Industry Regional Market Share
Geographic Coverage of US Processed Meats Industry
US Processed Meats Industry REPORT HIGHLIGHTS
| Aspects | Details |
|---|---|
| Study Period | 2020-2034 |
| Base Year | 2025 |
| Estimated Year | 2026 |
| Forecast Period | 2026-2034 |
| Historical Period | 2020-2025 |
| Growth Rate | CAGR of 3.45% from 2020-2034 |
| Segmentation |
|
Table of Contents
- 1. Introduction
- 1.1. Research Scope
- 1.2. Market Segmentation
- 1.3. Research Methodology
- 1.4. Definitions and Assumptions
- 2. Executive Summary
- 2.1. Introduction
- 3. Market Dynamics
- 3.1. Introduction
- 3.2. Market Drivers
- 3.2.1. Increasing Demand for Functional and Fortified Food; Multi-functionality and Wide Application of Riboflavin
- 3.3. Market Restrains
- 3.3.1. Low Stability of Riboflavin on Exposure to Light and Heat
- 3.4. Market Trends
- 3.4.1. OTHER KEY INDUSTRY TRENDS COVERED IN THE REPORT
- 4. Market Factor Analysis
- 4.1. Porters Five Forces
- 4.2. Supply/Value Chain
- 4.3. PESTEL analysis
- 4.4. Market Entropy
- 4.5. Patent/Trademark Analysis
- 5. Global US Processed Meats Industry Analysis, Insights and Forecast, 2020-2032
- 5.1. Market Analysis, Insights and Forecast - by Type
- 5.1.1. Beef
- 5.1.2. Mutton
- 5.1.3. Pork
- 5.1.4. Poultry
- 5.1.5. Other Meat
- 5.2. Market Analysis, Insights and Forecast - by Distribution Channel
- 5.2.1. Off-Trade
- 5.2.1.1. Convenience Stores
- 5.2.1.2. Online Channel
- 5.2.1.3. Supermarkets and Hypermarkets
- 5.2.1.4. Others
- 5.2.2. On-Trade
- 5.2.1. Off-Trade
- 5.3. Market Analysis, Insights and Forecast - by Region
- 5.3.1. North America
- 5.3.2. South America
- 5.3.3. Europe
- 5.3.4. Middle East & Africa
- 5.3.5. Asia Pacific
- 5.1. Market Analysis, Insights and Forecast - by Type
- 6. North America US Processed Meats Industry Analysis, Insights and Forecast, 2020-2032
- 6.1. Market Analysis, Insights and Forecast - by Type
- 6.1.1. Beef
- 6.1.2. Mutton
- 6.1.3. Pork
- 6.1.4. Poultry
- 6.1.5. Other Meat
- 6.2. Market Analysis, Insights and Forecast - by Distribution Channel
- 6.2.1. Off-Trade
- 6.2.1.1. Convenience Stores
- 6.2.1.2. Online Channel
- 6.2.1.3. Supermarkets and Hypermarkets
- 6.2.1.4. Others
- 6.2.2. On-Trade
- 6.2.1. Off-Trade
- 6.1. Market Analysis, Insights and Forecast - by Type
- 7. South America US Processed Meats Industry Analysis, Insights and Forecast, 2020-2032
- 7.1. Market Analysis, Insights and Forecast - by Type
- 7.1.1. Beef
- 7.1.2. Mutton
- 7.1.3. Pork
- 7.1.4. Poultry
- 7.1.5. Other Meat
- 7.2. Market Analysis, Insights and Forecast - by Distribution Channel
- 7.2.1. Off-Trade
- 7.2.1.1. Convenience Stores
- 7.2.1.2. Online Channel
- 7.2.1.3. Supermarkets and Hypermarkets
- 7.2.1.4. Others
- 7.2.2. On-Trade
- 7.2.1. Off-Trade
- 7.1. Market Analysis, Insights and Forecast - by Type
- 8. Europe US Processed Meats Industry Analysis, Insights and Forecast, 2020-2032
- 8.1. Market Analysis, Insights and Forecast - by Type
- 8.1.1. Beef
- 8.1.2. Mutton
- 8.1.3. Pork
- 8.1.4. Poultry
- 8.1.5. Other Meat
- 8.2. Market Analysis, Insights and Forecast - by Distribution Channel
- 8.2.1. Off-Trade
- 8.2.1.1. Convenience Stores
- 8.2.1.2. Online Channel
- 8.2.1.3. Supermarkets and Hypermarkets
- 8.2.1.4. Others
- 8.2.2. On-Trade
- 8.2.1. Off-Trade
- 8.1. Market Analysis, Insights and Forecast - by Type
- 9. Middle East & Africa US Processed Meats Industry Analysis, Insights and Forecast, 2020-2032
- 9.1. Market Analysis, Insights and Forecast - by Type
- 9.1.1. Beef
- 9.1.2. Mutton
- 9.1.3. Pork
- 9.1.4. Poultry
- 9.1.5. Other Meat
- 9.2. Market Analysis, Insights and Forecast - by Distribution Channel
- 9.2.1. Off-Trade
- 9.2.1.1. Convenience Stores
- 9.2.1.2. Online Channel
- 9.2.1.3. Supermarkets and Hypermarkets
- 9.2.1.4. Others
- 9.2.2. On-Trade
- 9.2.1. Off-Trade
- 9.1. Market Analysis, Insights and Forecast - by Type
- 10. Asia Pacific US Processed Meats Industry Analysis, Insights and Forecast, 2020-2032
- 10.1. Market Analysis, Insights and Forecast - by Type
- 10.1.1. Beef
- 10.1.2. Mutton
- 10.1.3. Pork
- 10.1.4. Poultry
- 10.1.5. Other Meat
- 10.2. Market Analysis, Insights and Forecast - by Distribution Channel
- 10.2.1. Off-Trade
- 10.2.1.1. Convenience Stores
- 10.2.1.2. Online Channel
- 10.2.1.3. Supermarkets and Hypermarkets
- 10.2.1.4. Others
- 10.2.2. On-Trade
- 10.2.1. Off-Trade
- 10.1. Market Analysis, Insights and Forecast - by Type
- 11. Competitive Analysis
- 11.1. Global Market Share Analysis 2025
- 11.2. Company Profiles
- 11.2.1 WH Group Limite
- 11.2.1.1. Overview
- 11.2.1.2. Products
- 11.2.1.3. SWOT Analysis
- 11.2.1.4. Recent Developments
- 11.2.1.5. Financials (Based on Availability)
- 11.2.2 Tyson Foods Inc
- 11.2.2.1. Overview
- 11.2.2.2. Products
- 11.2.2.3. SWOT Analysis
- 11.2.2.4. Recent Developments
- 11.2.2.5. Financials (Based on Availability)
- 11.2.3 BRF S A
- 11.2.3.1. Overview
- 11.2.3.2. Products
- 11.2.3.3. SWOT Analysis
- 11.2.3.4. Recent Developments
- 11.2.3.5. Financials (Based on Availability)
- 11.2.4 Conagra Brands Inc
- 11.2.4.1. Overview
- 11.2.4.2. Products
- 11.2.4.3. SWOT Analysis
- 11.2.4.4. Recent Developments
- 11.2.4.5. Financials (Based on Availability)
- 11.2.5 Sysco Corporation
- 11.2.5.1. Overview
- 11.2.5.2. Products
- 11.2.5.3. SWOT Analysis
- 11.2.5.4. Recent Developments
- 11.2.5.5. Financials (Based on Availability)
- 11.2.6 The Kraft Heinz Company
- 11.2.6.1. Overview
- 11.2.6.2. Products
- 11.2.6.3. SWOT Analysis
- 11.2.6.4. Recent Developments
- 11.2.6.5. Financials (Based on Availability)
- 11.2.7 Hormel Foods Corporation
- 11.2.7.1. Overview
- 11.2.7.2. Products
- 11.2.7.3. SWOT Analysis
- 11.2.7.4. Recent Developments
- 11.2.7.5. Financials (Based on Availability)
- 11.2.8 Cargill Inc
- 11.2.8.1. Overview
- 11.2.8.2. Products
- 11.2.8.3. SWOT Analysis
- 11.2.8.4. Recent Developments
- 11.2.8.5. Financials (Based on Availability)
- 11.2.9 Marfrig Global Foods S A
- 11.2.9.1. Overview
- 11.2.9.2. Products
- 11.2.9.3. SWOT Analysis
- 11.2.9.4. Recent Developments
- 11.2.9.5. Financials (Based on Availability)
- 11.2.10 Maple Leaf Foods
- 11.2.10.1. Overview
- 11.2.10.2. Products
- 11.2.10.3. SWOT Analysis
- 11.2.10.4. Recent Developments
- 11.2.10.5. Financials (Based on Availability)
- 11.2.11 JBS SA
- 11.2.11.1. Overview
- 11.2.11.2. Products
- 11.2.11.3. SWOT Analysis
- 11.2.11.4. Recent Developments
- 11.2.11.5. Financials (Based on Availability)
- 11.2.1 WH Group Limite
List of Figures
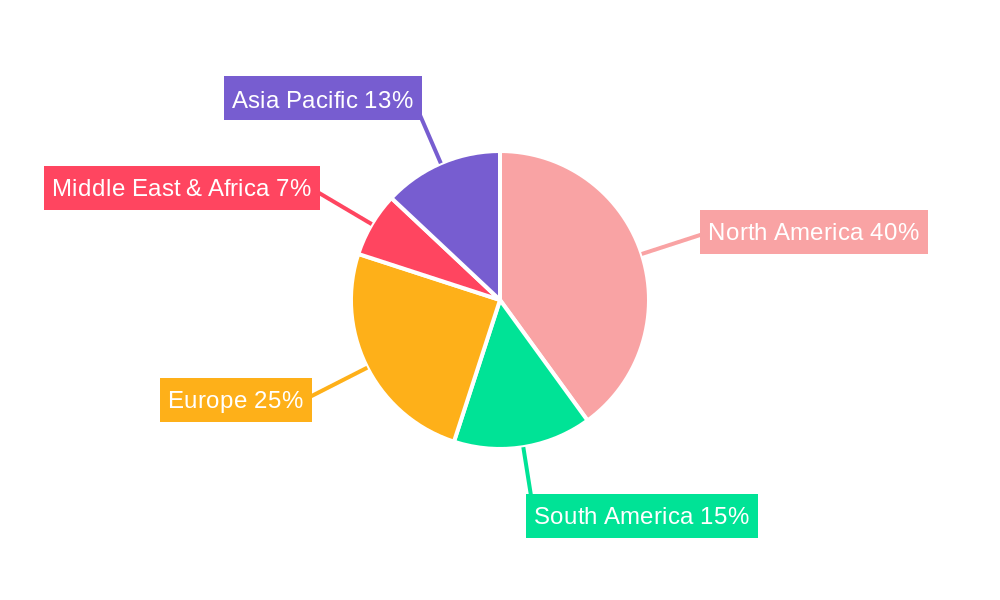
- Figure 1: Global US Processed Meats Industry Revenue Breakdown (billion, %) by Region 2025 & 2033
- Figure 2: North America US Processed Meats Industry Revenue (billion), by Type 2025 & 2033
- Figure 3: North America US Processed Meats Industry Revenue Share (%), by Type 2025 & 2033
- Figure 4: North America US Processed Meats Industry Revenue (billion), by Distribution Channel 2025 & 2033
- Figure 5: North America US Processed Meats Industry Revenue Share (%), by Distribution Channel 2025 & 2033
- Figure 6: North America US Processed Meats Industry Revenue (billion), by Country 2025 & 2033
- Figure 7: North America US Processed Meats Industry Revenue Share (%), by Country 2025 & 2033
- Figure 8: South America US Processed Meats Industry Revenue (billion), by Type 2025 & 2033
- Figure 9: South America US Processed Meats Industry Revenue Share (%), by Type 2025 & 2033
- Figure 10: South America US Processed Meats Industry Revenue (billion), by Distribution Channel 2025 & 2033
- Figure 11: South America US Processed Meats Industry Revenue Share (%), by Distribution Channel 2025 & 2033
- Figure 12: South America US Processed Meats Industry Revenue (billion), by Country 2025 & 2033
- Figure 13: South America US Processed Meats Industry Revenue Share (%), by Country 2025 & 2033
- Figure 14: Europe US Processed Meats Industry Revenue (billion), by Type 2025 & 2033
- Figure 15: Europe US Processed Meats Industry Revenue Share (%), by Type 2025 & 2033
- Figure 16: Europe US Processed Meats Industry Revenue (billion), by Distribution Channel 2025 & 2033
- Figure 17: Europe US Processed Meats Industry Revenue Share (%), by Distribution Channel 2025 & 2033
- Figure 18: Europe US Processed Meats Industry Revenue (billion), by Country 2025 & 2033
- Figure 19: Europe US Processed Meats Industry Revenue Share (%), by Country 2025 & 2033
- Figure 20: Middle East & Africa US Processed Meats Industry Revenue (billion), by Type 2025 & 2033
- Figure 21: Middle East & Africa US Processed Meats Industry Revenue Share (%), by Type 2025 & 2033
- Figure 22: Middle East & Africa US Processed Meats Industry Revenue (billion), by Distribution Channel 2025 & 2033
- Figure 23: Middle East & Africa US Processed Meats Industry Revenue Share (%), by Distribution Channel 2025 & 2033
- Figure 24: Middle East & Africa US Processed Meats Industry Revenue (billion), by Country 2025 & 2033
- Figure 25: Middle East & Africa US Processed Meats Industry Revenue Share (%), by Country 2025 & 2033
- Figure 26: Asia Pacific US Processed Meats Industry Revenue (billion), by Type 2025 & 2033
- Figure 27: Asia Pacific US Processed Meats Industry Revenue Share (%), by Type 2025 & 2033
- Figure 28: Asia Pacific US Processed Meats Industry Revenue (billion), by Distribution Channel 2025 & 2033
- Figure 29: Asia Pacific US Processed Meats Industry Revenue Share (%), by Distribution Channel 2025 & 2033
- Figure 30: Asia Pacific US Processed Meats Industry Revenue (billion), by Country 2025 & 2033
- Figure 31: Asia Pacific US Processed Meats Industry Revenue Share (%), by Country 2025 & 2033
List of Tables
- Table 1: Global US Processed Meats Industry Revenue billion Forecast, by Type 2020 & 2033
- Table 2: Global US Processed Meats Industry Revenue billion Forecast, by Distribution Channel 2020 & 2033
- Table 3: Global US Processed Meats Industry Revenue billion Forecast, by Region 2020 & 2033
- Table 4: Global US Processed Meats Industry Revenue billion Forecast, by Type 2020 & 2033
- Table 5: Global US Processed Meats Industry Revenue billion Forecast, by Distribution Channel 2020 & 2033
- Table 6: Global US Processed Meats Industry Revenue billion Forecast, by Country 2020 & 2033
- Table 7: United States US Processed Meats Industry Revenue (billion) Forecast, by Application 2020 & 2033
- Table 8: Canada US Processed Meats Industry Revenue (billion) Forecast, by Application 2020 & 2033
- Table 9: Mexico US Processed Meats Industry Revenue (billion) Forecast, by Application 2020 & 2033
- Table 10: Global US Processed Meats Industry Revenue billion Forecast, by Type 2020 & 2033
- Table 11: Global US Processed Meats Industry Revenue billion Forecast, by Distribution Channel 2020 & 2033
- Table 12: Global US Processed Meats Industry Revenue billion Forecast, by Country 2020 & 2033
- Table 13: Brazil US Processed Meats Industry Revenue (billion) Forecast, by Application 2020 & 2033
- Table 14: Argentina US Processed Meats Industry Revenue (billion) Forecast, by Application 2020 & 2033
- Table 15: Rest of South America US Processed Meats Industry Revenue (billion) Forecast, by Application 2020 & 2033
- Table 16: Global US Processed Meats Industry Revenue billion Forecast, by Type 2020 & 2033
- Table 17: Global US Processed Meats Industry Revenue billion Forecast, by Distribution Channel 2020 & 2033
- Table 18: Global US Processed Meats Industry Revenue billion Forecast, by Country 2020 & 2033
- Table 19: United Kingdom US Processed Meats Industry Revenue (billion) Forecast, by Application 2020 & 2033
- Table 20: Germany US Processed Meats Industry Revenue (billion) Forecast, by Application 2020 & 2033
- Table 21: France US Processed Meats Industry Revenue (billion) Forecast, by Application 2020 & 2033
- Table 22: Italy US Processed Meats Industry Revenue (billion) Forecast, by Application 2020 & 2033
- Table 23: Spain US Processed Meats Industry Revenue (billion) Forecast, by Application 2020 & 2033
- Table 24: Russia US Processed Meats Industry Revenue (billion) Forecast, by Application 2020 & 2033
- Table 25: Benelux US Processed Meats Industry Revenue (billion) Forecast, by Application 2020 & 2033
- Table 26: Nordics US Processed Meats Industry Revenue (billion) Forecast, by Application 2020 & 2033
- Table 27: Rest of Europe US Processed Meats Industry Revenue (billion) Forecast, by Application 2020 & 2033
- Table 28: Global US Processed Meats Industry Revenue billion Forecast, by Type 2020 & 2033
- Table 29: Global US Processed Meats Industry Revenue billion Forecast, by Distribution Channel 2020 & 2033
- Table 30: Global US Processed Meats Industry Revenue billion Forecast, by Country 2020 & 2033
- Table 31: Turkey US Processed Meats Industry Revenue (billion) Forecast, by Application 2020 & 2033
- Table 32: Israel US Processed Meats Industry Revenue (billion) Forecast, by Application 2020 & 2033
- Table 33: GCC US Processed Meats Industry Revenue (billion) Forecast, by Application 2020 & 2033
- Table 34: North Africa US Processed Meats Industry Revenue (billion) Forecast, by Application 2020 & 2033
- Table 35: South Africa US Processed Meats Industry Revenue (billion) Forecast, by Application 2020 & 2033
- Table 36: Rest of Middle East & Africa US Processed Meats Industry Revenue (billion) Forecast, by Application 2020 & 2033
- Table 37: Global US Processed Meats Industry Revenue billion Forecast, by Type 2020 & 2033
- Table 38: Global US Processed Meats Industry Revenue billion Forecast, by Distribution Channel 2020 & 2033
- Table 39: Global US Processed Meats Industry Revenue billion Forecast, by Country 2020 & 2033
- Table 40: China US Processed Meats Industry Revenue (billion) Forecast, by Application 2020 & 2033
- Table 41: India US Processed Meats Industry Revenue (billion) Forecast, by Application 2020 & 2033
- Table 42: Japan US Processed Meats Industry Revenue (billion) Forecast, by Application 2020 & 2033
- Table 43: South Korea US Processed Meats Industry Revenue (billion) Forecast, by Application 2020 & 2033
- Table 44: ASEAN US Processed Meats Industry Revenue (billion) Forecast, by Application 2020 & 2033
- Table 45: Oceania US Processed Meats Industry Revenue (billion) Forecast, by Application 2020 & 2033
- Table 46: Rest of Asia Pacific US Processed Meats Industry Revenue (billion) Forecast, by Application 2020 & 2033
Frequently Asked Questions
1. What is the projected Compound Annual Growth Rate (CAGR) of the US Processed Meats Industry?
The projected CAGR is approximately 3.45%.
2. Which companies are prominent players in the US Processed Meats Industry?
Key companies in the market include WH Group Limite, Tyson Foods Inc, BRF S A, Conagra Brands Inc, Sysco Corporation, The Kraft Heinz Company, Hormel Foods Corporation, Cargill Inc, Marfrig Global Foods S A, Maple Leaf Foods, JBS SA.
3. What are the main segments of the US Processed Meats Industry?
The market segments include Type, Distribution Channel.
4. Can you provide details about the market size?
The market size is estimated to be USD 3.16 billion as of 2022.
5. What are some drivers contributing to market growth?
Increasing Demand for Functional and Fortified Food; Multi-functionality and Wide Application of Riboflavin.
6. What are the notable trends driving market growth?
OTHER KEY INDUSTRY TRENDS COVERED IN THE REPORT.
7. Are there any restraints impacting market growth?
Low Stability of Riboflavin on Exposure to Light and Heat.
8. Can you provide examples of recent developments in the market?
May 2023: Tyson Foods Claryville announced its newly expanded cocktail sausage manufacturing capacity, allowing the company to meet high customer demand for its Hillshire Farm brand products. This USD 83 million expansion will add 15,000 square feet to its 342,000 square foot facility and state-of-the-art equipment to increase production by 50% to better serve customers.April 2023: The makers of the HERDEZ® brand announced the launch of its HERDEZ™ Mexican Refrigerated Entrées line with two delicious varieties, including HERDEZ™ Chicken Shredded in Mild Chipotle Sauce and HERDEZ™ Carnitas Slow Cooked Pork.March 2023: Tyson® brand introduces chicken sandwiches and sliders, bringing restaurant-quality taste to home. The new Tyson Chicken Breast Sandwiches and Sliders are available in Original and Spicy. The new product is available in the frozen snacks section at retailers nationwide.
9. What pricing options are available for accessing the report?
Pricing options include single-user, multi-user, and enterprise licenses priced at USD 3800, USD 4500, and USD 5800 respectively.
10. Is the market size provided in terms of value or volume?
The market size is provided in terms of value, measured in billion.
11. Are there any specific market keywords associated with the report?
Yes, the market keyword associated with the report is "US Processed Meats Industry," which aids in identifying and referencing the specific market segment covered.
12. How do I determine which pricing option suits my needs best?
The pricing options vary based on user requirements and access needs. Individual users may opt for single-user licenses, while businesses requiring broader access may choose multi-user or enterprise licenses for cost-effective access to the report.
13. Are there any additional resources or data provided in the US Processed Meats Industry report?
While the report offers comprehensive insights, it's advisable to review the specific contents or supplementary materials provided to ascertain if additional resources or data are available.
14. How can I stay updated on further developments or reports in the US Processed Meats Industry?
To stay informed about further developments, trends, and reports in the US Processed Meats Industry, consider subscribing to industry newsletters, following relevant companies and organizations, or regularly checking reputable industry news sources and publications.
Methodology
Step 1 - Identification of Relevant Samples Size from Population Database


Step 2 - Approaches for Defining Global Market Size (Value, Volume* & Price*)

Note*: In applicable scenarios
Step 3 - Data Sources
Primary Research
- Web Analytics
- Survey Reports
- Research Institute
- Latest Research Reports
- Opinion Leaders
Secondary Research
- Annual Reports
- White Paper
- Latest Press Release
- Industry Association
- Paid Database
- Investor Presentations

Step 4 - Data Triangulation
Involves using different sources of information in order to increase the validity of a study
These sources are likely to be stakeholders in a program - participants, other researchers, program staff, other community members, and so on.
Then we put all data in single framework & apply various statistical tools to find out the dynamic on the market.
During the analysis stage, feedback from the stakeholder groups would be compared to determine areas of agreement as well as areas of divergence