

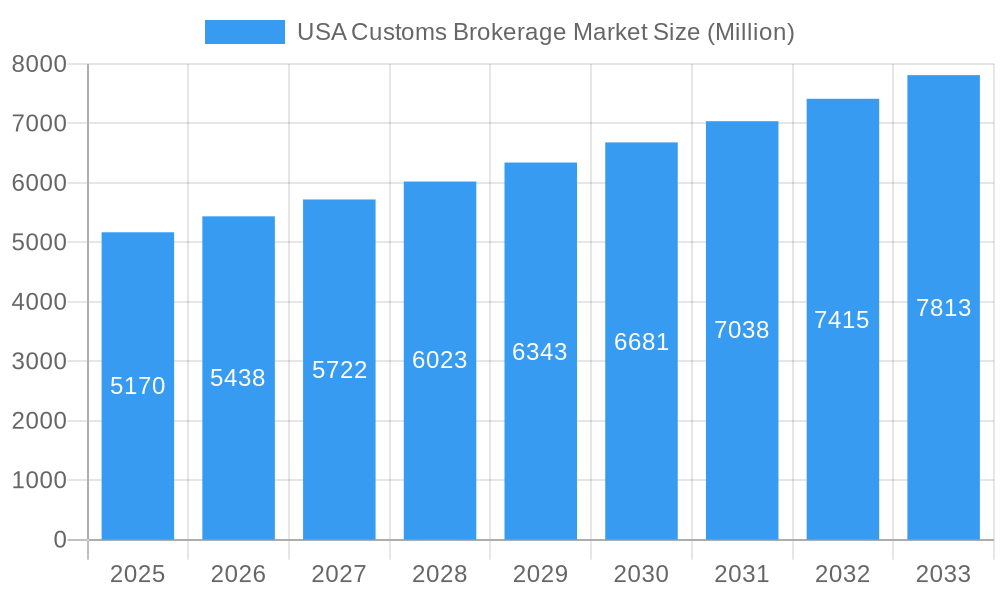
Key Insights
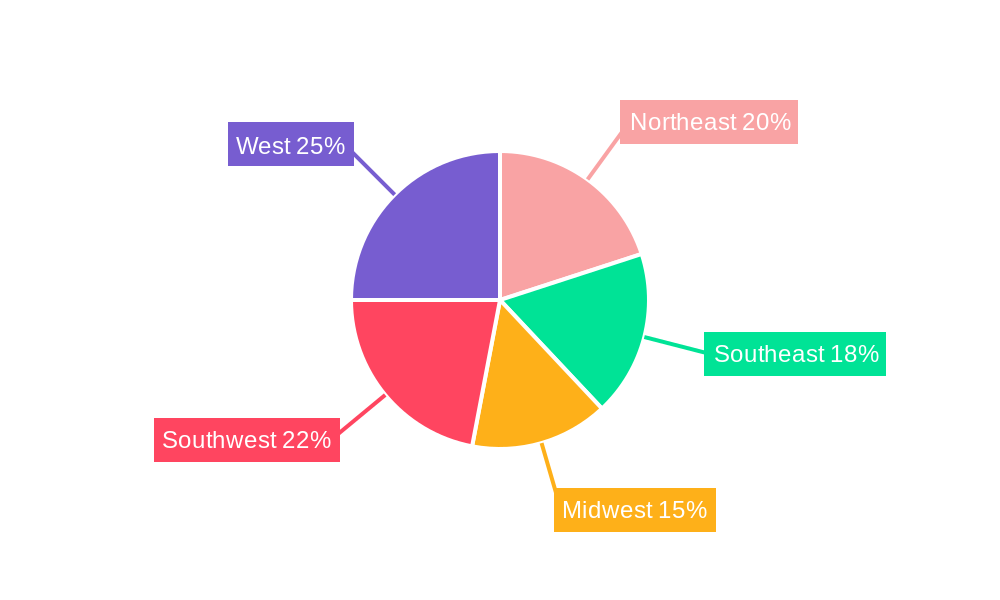
The US Customs Brokerage Market, valued at $5.17 billion in 2025, is projected to experience robust growth, with a Compound Annual Growth Rate (CAGR) of 4.95% from 2025 to 2033. This expansion is fueled by several key factors. The increasing volume of international trade, particularly e-commerce, necessitates efficient customs clearance processes, driving demand for brokerage services. Furthermore, growing regulatory complexities and the need for specialized expertise in navigating customs procedures are compelling businesses to outsource these functions to experienced brokers. The market is segmented by mode of transport (sea, air, and cross-border land), reflecting the diverse avenues of international trade. Key players like FedEx, DHL, UPS, and numerous specialized brokerage firms compete in this market, offering a range of services from documentation preparation to customs compliance consulting. Regional variations exist, with potentially higher demand in major port cities and states with significant import/export activity, such as California, New York, and Texas. The Northeast, Southeast, Midwest, Southwest, and West regions all contribute to the overall market size, with their individual shares likely influenced by geographical trade patterns and economic activity.
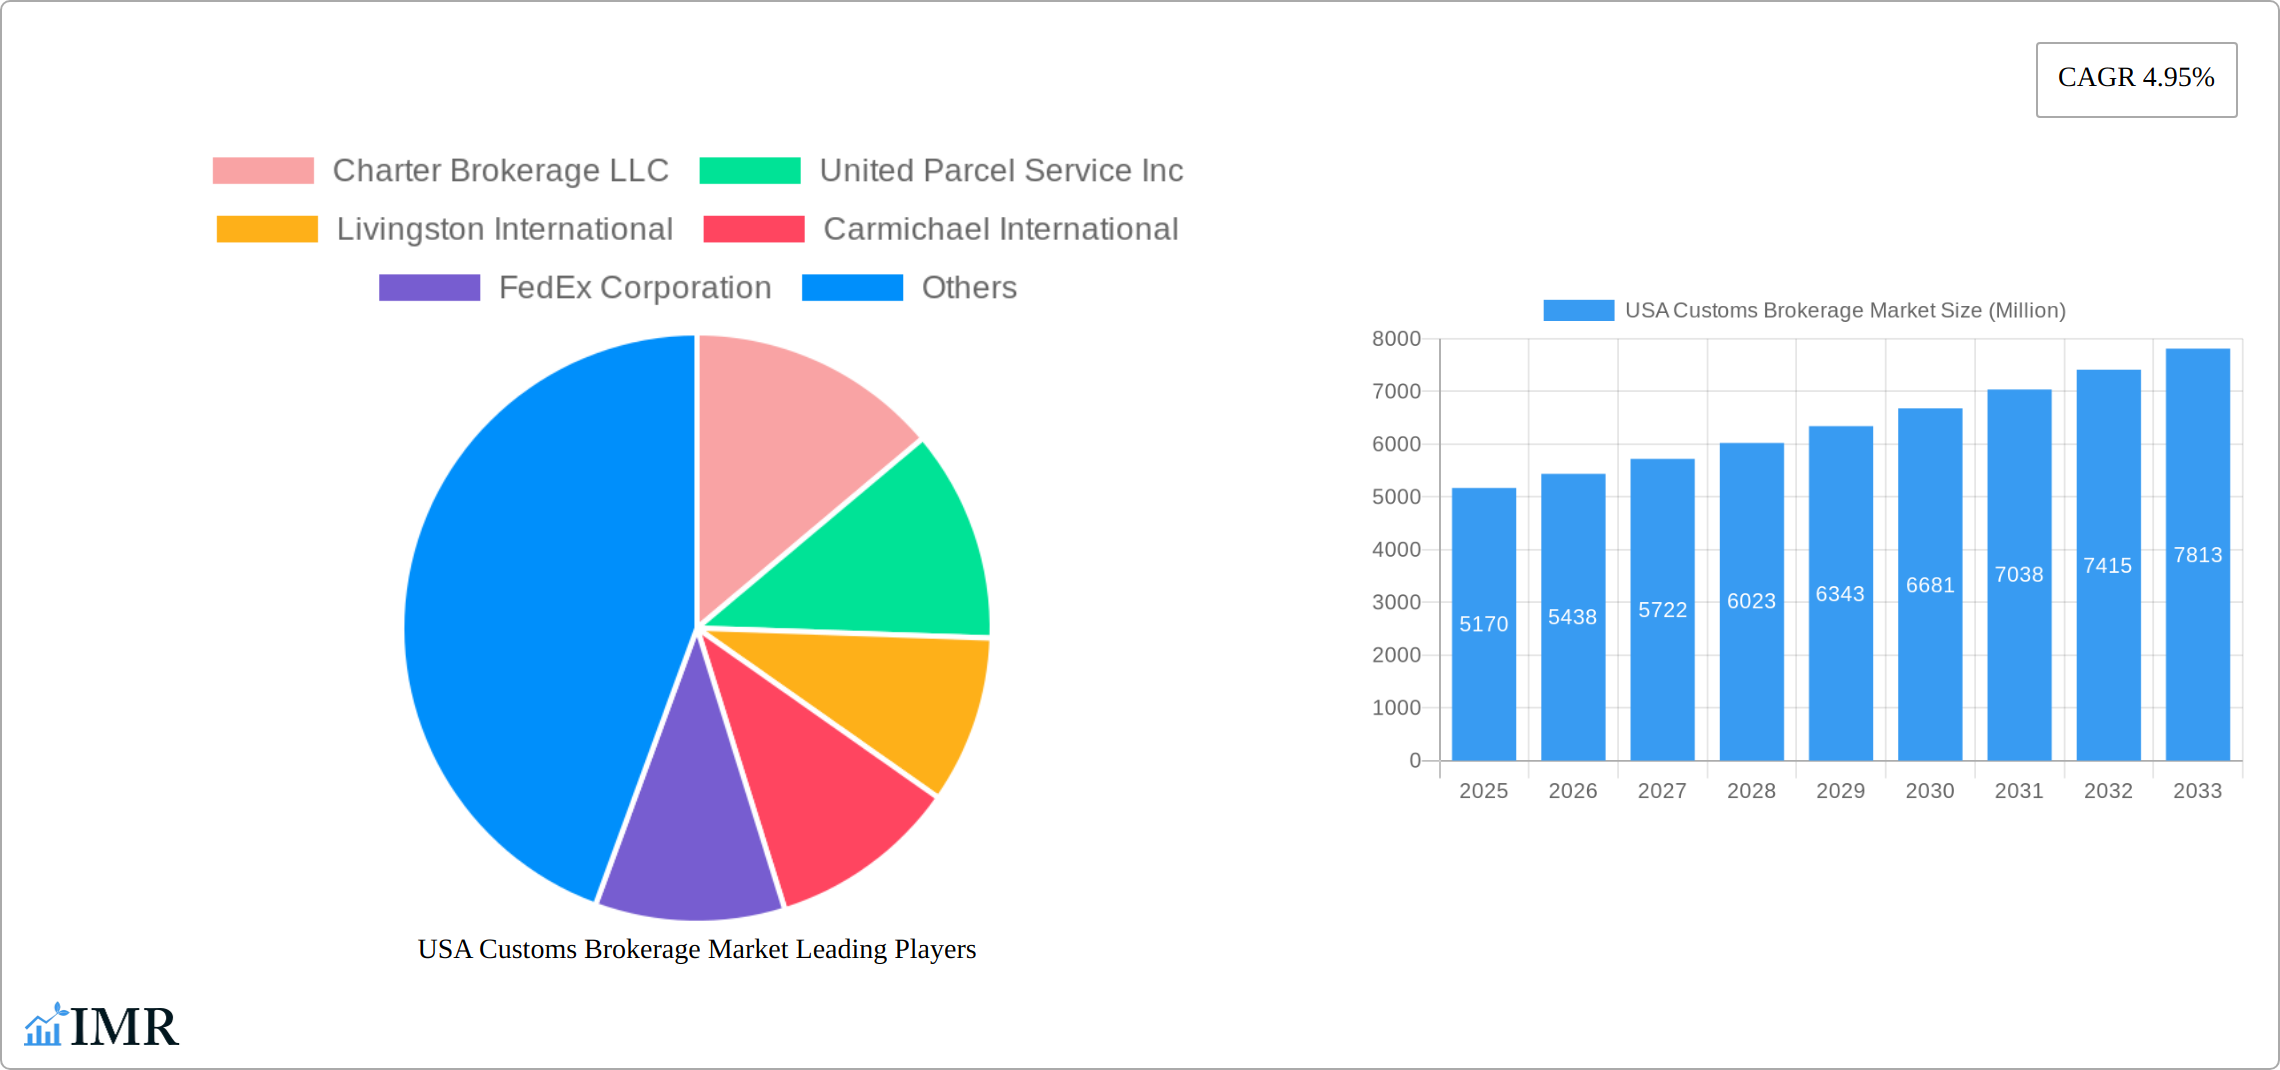
USA Customs Brokerage Market Market Size (In Billion)
The forecast period (2025-2033) anticipates continued growth, driven by technological advancements such as automation and digitalization within customs procedures. These technological improvements streamline processes, reduce processing times, and improve efficiency for both brokers and importers/exporters. However, potential restraints include fluctuating global economic conditions, trade policy changes (tariffs, sanctions), and the ongoing need for brokers to adapt to evolving regulations. The competitive landscape will continue to evolve as larger logistics companies expand their brokerage services and smaller niche players cater to specialized industries. Understanding these market dynamics is crucial for businesses seeking to enter or expand within the US Customs Brokerage Market. The consistent growth indicates a positive outlook for the foreseeable future, underpinned by the essential nature of customs brokerage services in facilitating international commerce.
USA Customs Brokerage Market Company Market Share
USA Customs Brokerage Market: A Comprehensive Report (2019-2033)
This in-depth report provides a comprehensive analysis of the USA Customs Brokerage Market, offering invaluable insights for industry professionals, investors, and strategic decision-makers. The report covers the period 2019-2033, with a focus on the forecast period 2025-2033 (Base Year: 2025, Estimated Year: 2025). The market is segmented by mode of transport (Sea, Air, Cross-border Land Transport), providing a granular understanding of growth dynamics within each segment. The total market size is projected to reach XX Million by 2033.
USA Customs Brokerage Market Dynamics & Structure
The USA Customs Brokerage market is characterized by a moderately concentrated structure, with several large multinational players and a significant number of smaller, specialized firms. Market concentration is further analyzed using the Herfindahl-Hirschman Index (HHI) and market share data for key players. Technological innovation, particularly in areas like automation, AI, and blockchain, is a key driver, improving efficiency and compliance. However, high initial investment costs and integration complexities present barriers to widespread adoption. The regulatory environment, including evolving trade policies and customs regulations, significantly impacts market dynamics. M&A activity has been robust, with several significant acquisitions in recent years, reflecting consolidation and expansion strategies. The competitive landscape includes various substitute services, particularly for smaller shipments, though the expertise and risk management capabilities offered by customs brokers remain crucial for large-scale operations. End-user demographics are heavily influenced by import/export volumes across various industries, impacting demand fluctuations.
- Market Concentration: Moderately Concentrated (HHI: xx)
- Technological Innovation: AI-powered customs clearance, blockchain for secure documentation.
- Regulatory Framework: Subject to constant change, impacting operational costs and compliance.
- Competitive Substitutes: Direct-to-consumer import solutions, simplified customs processes for small shipments.
- M&A Trends: Consolidation amongst larger players, acquisition of niche specialists. xx M&A deals recorded between 2019-2024.
USA Customs Brokerage Market Growth Trends & Insights
The USA Customs Brokerage market experienced a CAGR of xx% during the historical period (2019-2024), driven by increasing global trade, e-commerce expansion, and the complexity of customs regulations. Adoption rates for advanced technologies remain relatively low, but are projected to increase significantly over the forecast period. Consumer behavior shifts towards increased demand for faster, more transparent, and cost-effective customs brokerage services are pushing innovation. The market is expected to maintain a healthy growth trajectory, with a projected CAGR of xx% during 2025-2033, reaching an estimated value of XX Million by 2033. This growth is influenced by factors such as expanding e-commerce, the increasing complexity of global supply chains, and a heightened focus on compliance and security. Market penetration of technologically advanced solutions is expected to increase from xx% in 2025 to xx% by 2033.
Dominant Regions, Countries, or Segments in USA Customs Brokerage Market
The sea freight segment continues to be the cornerstone of the USA Customs Brokerage market, projected to hold a significant market share in the coming years, driven by the sheer volume of goods traversing international waters. This dominance is underpinned by the established and robust maritime infrastructure facilitating the vast majority of imports and exports. Simultaneously, the air freight segment is exhibiting dynamic expansion, fueled by the escalating demand for time-sensitive shipments and the burgeoning e-commerce sector, where speed and reliability are paramount. The ability to offer expedited clearance and efficient handling makes air freight increasingly attractive for high-value and time-critical goods.
The cross-border land transport segment is also demonstrating substantial growth potential. This upward trajectory is largely attributed to the strengthening bilateral trade relationships with key North American partners, namely Canada and Mexico. As supply chains become more integrated across the continent, the efficiency and streamlined processes offered by customs brokers specializing in land borders are becoming increasingly valuable.
- Sea Freight: Continues to lead due to the immense volume of global trade and well-established port infrastructure.
- Air Freight: Experiencing rapid growth driven by the e-commerce boom, the demand for expedited shipping, and the need for swift delivery of high-value goods.
- Cross-border Land Transport: Showing significant expansion, bolstered by robust and growing trade volumes with Canada and Mexico, necessitating efficient border clearance solutions.
- Geographic Dominance: States such as California, Texas, and New York remain at the forefront of customs brokerage activity due to their strategic locations and high import/export volumes, serving as major gateways for international commerce.
USA Customs Brokerage Market Product Landscape
The product landscape is evolving with a focus on integrated technology solutions, including automated customs clearance platforms, data analytics for compliance and risk management, and enhanced supply chain visibility tools. These offerings streamline processes, reduce errors, and improve efficiency. The key selling propositions are speed, accuracy, compliance, and cost savings. Many providers are leveraging AI and machine learning to predict and mitigate potential customs delays.
Key Drivers, Barriers & Challenges in USA Customs Brokerage Market
Key Drivers: The USA Customs Brokerage market is propelled by several interconnected factors. The persistent growth in global trade remains a fundamental driver, increasing the volume of goods requiring customs clearance. The exponential rise of e-commerce has created a surge in smaller, more frequent shipments, demanding agile and efficient brokerage services. Furthermore, the ever-increasing complexity of customs regulations and trade agreements necessitates specialized expertise, elevating the role of brokers. The demand for faster and more efficient logistics across all supply chain stages, coupled with the continuous evolution and adoption of technological advancements in automation, artificial intelligence, and data analytics, are crucial enablers of market growth and operational excellence.
Challenges & Restraints: Navigating the intricacies of stringent regulatory compliance requirements is a perpetual challenge, demanding constant vigilance and adaptation. The potential for significant customs delays and penalties due to non-compliance or unforeseen circumstances poses a considerable risk. The high operating costs associated with adopting and integrating new technologies, alongside the need for skilled personnel to manage them, can be a barrier for some. The market is characterized by intense competition, requiring brokers to differentiate themselves through service quality and specialized offerings. Moreover, supply chain disruptions, often exacerbated by geopolitical uncertainties and global events, can lead to unpredictable delays and increased operational complexity, as evidenced by potential increases in delays during periods of heightened geopolitical tension.
Emerging Opportunities in USA Customs Brokerage Market
Untapped markets include specialized sectors like pharmaceuticals and high-value goods, requiring specialized handling and compliance expertise. Opportunities also exist in developing innovative solutions leveraging blockchain technology for secure and transparent documentation, and AI for predictive analytics and risk mitigation. The growing demand for sustainable and responsible logistics practices presents opportunities for customs brokers offering environmentally friendly services.
Growth Accelerators in the USA Customs Brokerage Market Industry
Technological advancements, strategic partnerships to expand service offerings and geographic reach, and the adoption of innovative pricing models are key growth accelerators. The increasing use of data analytics for predictive compliance and risk management is transforming the industry. Government initiatives promoting trade facilitation also significantly boost market growth.
Key Players Shaping the USA Customs Brokerage Market Market
- Charter Brokerage LLC
- United Parcel Service Inc
- Livingston International
- Carmichael International
- FedEx Corporation
- Deutsche Post DHL group
- Trans American Customhouse Brokers Inc
- GHY International
- Flexport Inc
- Purolator International
- Samuel Shapiro & Company Inc
- Scarbrough International Ltd
- Expeditors International
- A N Deringer
- C H Robinson
- CH Powell Company
- 8 Other Companies (Key Information/Overview)
Notable Milestones in USA Customs Brokerage Market Sector
- November 2023: Kuehne+Nagel significantly bolstered its cross-border capabilities and market presence within North America through the strategic acquisition of Farrow, a well-established customs brokerage firm.
- October 2023: Rock-It Global expanded its specialized logistics services and market reach by acquiring Dell Will, demonstrating a strategic move to enhance its offerings within niche sectors like motorsports logistics.
In-Depth USA Customs Brokerage Market Market Outlook
The USA Customs Brokerage market is on a trajectory for robust and sustained growth in the foreseeable future. This expansion will be underpinned by the ongoing expansion of global trade, the relentless pace of technological innovation, and the dynamic evolution of regulatory frameworks governing international commerce. Success in this competitive landscape will hinge on strategic alliances, substantial investments in cutting-edge technologies that enhance efficiency and data visibility, and a keen focus on identifying and serving specialized or niche market segments that require tailored expertise. The market presents a compelling opportunity for forward-thinking companies that can adeptly navigate the complexities of the regulatory environment, deliver seamless, compliant, and technologically sophisticated customs brokerage services, thereby becoming indispensable partners in the global supply chain.
USA Customs Brokerage Market Segmentation
-
1. Mode of Transport
- 1.1. Sea
- 1.2. Air
- 1.3. Cross-border Land Transport
USA Customs Brokerage Market Segmentation By Geography
-
1. North America
- 1.1. United States
- 1.2. Canada
- 1.3. Mexico
-
2. South America
- 2.1. Brazil
- 2.2. Argentina
- 2.3. Rest of South America
-
3. Europe
- 3.1. United Kingdom
- 3.2. Germany
- 3.3. France
- 3.4. Italy
- 3.5. Spain
- 3.6. Russia
- 3.7. Benelux
- 3.8. Nordics
- 3.9. Rest of Europe
-
4. Middle East & Africa
- 4.1. Turkey
- 4.2. Israel
- 4.3. GCC
- 4.4. North Africa
- 4.5. South Africa
- 4.6. Rest of Middle East & Africa
-
5. Asia Pacific
- 5.1. China
- 5.2. India
- 5.3. Japan
- 5.4. South Korea
- 5.5. ASEAN
- 5.6. Oceania
- 5.7. Rest of Asia Pacific
USA Customs Brokerage Market Regional Market Share
Geographic Coverage of USA Customs Brokerage Market
USA Customs Brokerage Market REPORT HIGHLIGHTS
| Aspects | Details |
|---|---|
| Study Period | 2020-2034 |
| Base Year | 2025 |
| Estimated Year | 2026 |
| Forecast Period | 2026-2034 |
| Historical Period | 2020-2025 |
| Growth Rate | CAGR of 4.95% from 2020-2034 |
| Segmentation |
|
Table of Contents
- 1. Introduction
- 1.1. Research Scope
- 1.2. Market Segmentation
- 1.3. Research Objective
- 1.4. Definitions and Assumptions
- 2. Executive Summary
- 2.1. Market Snapshot
- 3. Market Dynamics
- 3.1. Market Drivers
- 3.2. Market Restrains
- 3.3. Market Trends
- 3.4. Market Opportunities
- 4. Market Factor Analysis
- 4.1. Porters Five Forces
- 4.1.1. Bargaining Power of Suppliers
- 4.1.2. Bargaining Power of Buyers
- 4.1.3. Threat of New Entrants
- 4.1.4. Threat of Substitutes
- 4.1.5. Competitive Rivalry
- 4.2. PESTEL analysis
- 4.3. BCG Analysis
- 4.3.1. Stars (High Growth, High Market Share)
- 4.3.2. Cash Cows (Low Growth, High Market Share)
- 4.3.3. Question Mark (High Growth, Low Market Share)
- 4.3.4. Dogs (Low Growth, Low Market Share)
- 4.4. Ansoff Matrix Analysis
- 4.5. Supply Chain Analysis
- 4.6. Regulatory Landscape
- 4.7. Current Market Potential and Opportunity Assessment (TAM–SAM–SOM Framework)
- 4.8. IMR Analyst Note
- 4.1. Porters Five Forces
- 5. Market Analysis, Insights and Forecast 2021-2033
- 5.1. Market Analysis, Insights and Forecast - by Mode of Transport
- 5.1.1. Sea
- 5.1.2. Air
- 5.1.3. Cross-border Land Transport
- 5.2. Market Analysis, Insights and Forecast - by Region
- 5.2.1. North America
- 5.2.2. South America
- 5.2.3. Europe
- 5.2.4. Middle East & Africa
- 5.2.5. Asia Pacific
- 5.1. Market Analysis, Insights and Forecast - by Mode of Transport
- 6. Global USA Customs Brokerage Market Analysis, Insights and Forecast, 2021-2033
- 6.1. Market Analysis, Insights and Forecast - by Mode of Transport
- 6.1.1. Sea
- 6.1.2. Air
- 6.1.3. Cross-border Land Transport
- 6.1. Market Analysis, Insights and Forecast - by Mode of Transport
- 7. North America USA Customs Brokerage Market Analysis, Insights and Forecast, 2020-2032
- 7.1. Market Analysis, Insights and Forecast - by Mode of Transport
- 7.1.1. Sea
- 7.1.2. Air
- 7.1.3. Cross-border Land Transport
- 7.1. Market Analysis, Insights and Forecast - by Mode of Transport
- 8. South America USA Customs Brokerage Market Analysis, Insights and Forecast, 2020-2032
- 8.1. Market Analysis, Insights and Forecast - by Mode of Transport
- 8.1.1. Sea
- 8.1.2. Air
- 8.1.3. Cross-border Land Transport
- 8.1. Market Analysis, Insights and Forecast - by Mode of Transport
- 9. Europe USA Customs Brokerage Market Analysis, Insights and Forecast, 2020-2032
- 9.1. Market Analysis, Insights and Forecast - by Mode of Transport
- 9.1.1. Sea
- 9.1.2. Air
- 9.1.3. Cross-border Land Transport
- 9.1. Market Analysis, Insights and Forecast - by Mode of Transport
- 10. Middle East & Africa USA Customs Brokerage Market Analysis, Insights and Forecast, 2020-2032
- 10.1. Market Analysis, Insights and Forecast - by Mode of Transport
- 10.1.1. Sea
- 10.1.2. Air
- 10.1.3. Cross-border Land Transport
- 10.1. Market Analysis, Insights and Forecast - by Mode of Transport
- 11. Asia Pacific USA Customs Brokerage Market Analysis, Insights and Forecast, 2020-2032
- 11.1. Market Analysis, Insights and Forecast - by Mode of Transport
- 11.1.1. Sea
- 11.1.2. Air
- 11.1.3. Cross-border Land Transport
- 11.1. Market Analysis, Insights and Forecast - by Mode of Transport
- 12. Competitive Analysis
- 12.1. Company Profiles
- 12.1.1 Charter Brokerage LLC
- 12.1.1.1. Company Overview
- 12.1.1.2. Products
- 12.1.1.3. Company Financials
- 12.1.1.4. SWOT Analysis
- 12.1.2 United Parcel Service Inc
- 12.1.2.1. Company Overview
- 12.1.2.2. Products
- 12.1.2.3. Company Financials
- 12.1.2.4. SWOT Analysis
- 12.1.3 Livingston International
- 12.1.3.1. Company Overview
- 12.1.3.2. Products
- 12.1.3.3. Company Financials
- 12.1.3.4. SWOT Analysis
- 12.1.4 Carmichael International
- 12.1.4.1. Company Overview
- 12.1.4.2. Products
- 12.1.4.3. Company Financials
- 12.1.4.4. SWOT Analysis
- 12.1.5 FedEx Corporation
- 12.1.5.1. Company Overview
- 12.1.5.2. Products
- 12.1.5.3. Company Financials
- 12.1.5.4. SWOT Analysis
- 12.1.6 Deutsche Post DHL group
- 12.1.6.1. Company Overview
- 12.1.6.2. Products
- 12.1.6.3. Company Financials
- 12.1.6.4. SWOT Analysis
- 12.1.7 Trans American Customhouse Brokers Inc GHY International Flexport Inc Purolator International Samuel Shapiro & Company Inc Scarbrough International Ltd
- 12.1.7.1. Company Overview
- 12.1.7.2. Products
- 12.1.7.3. Company Financials
- 12.1.7.4. SWOT Analysis
- 12.1.8 Expeditors International
- 12.1.8.1. Company Overview
- 12.1.8.2. Products
- 12.1.8.3. Company Financials
- 12.1.8.4. SWOT Analysis
- 12.1.9 A N Deringer
- 12.1.9.1. Company Overview
- 12.1.9.2. Products
- 12.1.9.3. Company Financials
- 12.1.9.4. SWOT Analysis
- 12.1.10 C H Robinson
- 12.1.10.1. Company Overview
- 12.1.10.2. Products
- 12.1.10.3. Company Financials
- 12.1.10.4. SWOT Analysis
- 12.1.11 CH Powell Company**List Not Exhaustive 8 3 Other Companies (Key Information/Overview)
- 12.1.11.1. Company Overview
- 12.1.11.2. Products
- 12.1.11.3. Company Financials
- 12.1.11.4. SWOT Analysis
- 12.1.1 Charter Brokerage LLC
- 12.2. Market Entropy
- 12.2.1 Company's Key Areas Served
- 12.2.2 Recent Developments
- 12.3. Company Market Share Analysis 2025
- 12.3.1 Top 5 Companies Market Share Analysis
- 12.3.2 Top 3 Companies Market Share Analysis
- 12.4. List of Potential Customers
- 13. Research Methodology
List of Figures
- Figure 1: Global USA Customs Brokerage Market Revenue Breakdown (Million, %) by Region 2025 & 2033
- Figure 2: North America USA Customs Brokerage Market Revenue (Million), by Mode of Transport 2025 & 2033
- Figure 3: North America USA Customs Brokerage Market Revenue Share (%), by Mode of Transport 2025 & 2033
- Figure 4: North America USA Customs Brokerage Market Revenue (Million), by Country 2025 & 2033
- Figure 5: North America USA Customs Brokerage Market Revenue Share (%), by Country 2025 & 2033
- Figure 6: South America USA Customs Brokerage Market Revenue (Million), by Mode of Transport 2025 & 2033
- Figure 7: South America USA Customs Brokerage Market Revenue Share (%), by Mode of Transport 2025 & 2033
- Figure 8: South America USA Customs Brokerage Market Revenue (Million), by Country 2025 & 2033
- Figure 9: South America USA Customs Brokerage Market Revenue Share (%), by Country 2025 & 2033
- Figure 10: Europe USA Customs Brokerage Market Revenue (Million), by Mode of Transport 2025 & 2033
- Figure 11: Europe USA Customs Brokerage Market Revenue Share (%), by Mode of Transport 2025 & 2033
- Figure 12: Europe USA Customs Brokerage Market Revenue (Million), by Country 2025 & 2033
- Figure 13: Europe USA Customs Brokerage Market Revenue Share (%), by Country 2025 & 2033
- Figure 14: Middle East & Africa USA Customs Brokerage Market Revenue (Million), by Mode of Transport 2025 & 2033
- Figure 15: Middle East & Africa USA Customs Brokerage Market Revenue Share (%), by Mode of Transport 2025 & 2033
- Figure 16: Middle East & Africa USA Customs Brokerage Market Revenue (Million), by Country 2025 & 2033
- Figure 17: Middle East & Africa USA Customs Brokerage Market Revenue Share (%), by Country 2025 & 2033
- Figure 18: Asia Pacific USA Customs Brokerage Market Revenue (Million), by Mode of Transport 2025 & 2033
- Figure 19: Asia Pacific USA Customs Brokerage Market Revenue Share (%), by Mode of Transport 2025 & 2033
- Figure 20: Asia Pacific USA Customs Brokerage Market Revenue (Million), by Country 2025 & 2033
- Figure 21: Asia Pacific USA Customs Brokerage Market Revenue Share (%), by Country 2025 & 2033
List of Tables
- Table 1: Global USA Customs Brokerage Market Revenue Million Forecast, by Mode of Transport 2020 & 2033
- Table 2: Global USA Customs Brokerage Market Revenue Million Forecast, by Region 2020 & 2033
- Table 3: Global USA Customs Brokerage Market Revenue Million Forecast, by Mode of Transport 2020 & 2033
- Table 4: Global USA Customs Brokerage Market Revenue Million Forecast, by Country 2020 & 2033
- Table 5: United States USA Customs Brokerage Market Revenue (Million) Forecast, by Application 2020 & 2033
- Table 6: Canada USA Customs Brokerage Market Revenue (Million) Forecast, by Application 2020 & 2033
- Table 7: Mexico USA Customs Brokerage Market Revenue (Million) Forecast, by Application 2020 & 2033
- Table 8: Global USA Customs Brokerage Market Revenue Million Forecast, by Mode of Transport 2020 & 2033
- Table 9: Global USA Customs Brokerage Market Revenue Million Forecast, by Country 2020 & 2033
- Table 10: Brazil USA Customs Brokerage Market Revenue (Million) Forecast, by Application 2020 & 2033
- Table 11: Argentina USA Customs Brokerage Market Revenue (Million) Forecast, by Application 2020 & 2033
- Table 12: Rest of South America USA Customs Brokerage Market Revenue (Million) Forecast, by Application 2020 & 2033
- Table 13: Global USA Customs Brokerage Market Revenue Million Forecast, by Mode of Transport 2020 & 2033
- Table 14: Global USA Customs Brokerage Market Revenue Million Forecast, by Country 2020 & 2033
- Table 15: United Kingdom USA Customs Brokerage Market Revenue (Million) Forecast, by Application 2020 & 2033
- Table 16: Germany USA Customs Brokerage Market Revenue (Million) Forecast, by Application 2020 & 2033
- Table 17: France USA Customs Brokerage Market Revenue (Million) Forecast, by Application 2020 & 2033
- Table 18: Italy USA Customs Brokerage Market Revenue (Million) Forecast, by Application 2020 & 2033
- Table 19: Spain USA Customs Brokerage Market Revenue (Million) Forecast, by Application 2020 & 2033
- Table 20: Russia USA Customs Brokerage Market Revenue (Million) Forecast, by Application 2020 & 2033
- Table 21: Benelux USA Customs Brokerage Market Revenue (Million) Forecast, by Application 2020 & 2033
- Table 22: Nordics USA Customs Brokerage Market Revenue (Million) Forecast, by Application 2020 & 2033
- Table 23: Rest of Europe USA Customs Brokerage Market Revenue (Million) Forecast, by Application 2020 & 2033
- Table 24: Global USA Customs Brokerage Market Revenue Million Forecast, by Mode of Transport 2020 & 2033
- Table 25: Global USA Customs Brokerage Market Revenue Million Forecast, by Country 2020 & 2033
- Table 26: Turkey USA Customs Brokerage Market Revenue (Million) Forecast, by Application 2020 & 2033
- Table 27: Israel USA Customs Brokerage Market Revenue (Million) Forecast, by Application 2020 & 2033
- Table 28: GCC USA Customs Brokerage Market Revenue (Million) Forecast, by Application 2020 & 2033
- Table 29: North Africa USA Customs Brokerage Market Revenue (Million) Forecast, by Application 2020 & 2033
- Table 30: South Africa USA Customs Brokerage Market Revenue (Million) Forecast, by Application 2020 & 2033
- Table 31: Rest of Middle East & Africa USA Customs Brokerage Market Revenue (Million) Forecast, by Application 2020 & 2033
- Table 32: Global USA Customs Brokerage Market Revenue Million Forecast, by Mode of Transport 2020 & 2033
- Table 33: Global USA Customs Brokerage Market Revenue Million Forecast, by Country 2020 & 2033
- Table 34: China USA Customs Brokerage Market Revenue (Million) Forecast, by Application 2020 & 2033
- Table 35: India USA Customs Brokerage Market Revenue (Million) Forecast, by Application 2020 & 2033
- Table 36: Japan USA Customs Brokerage Market Revenue (Million) Forecast, by Application 2020 & 2033
- Table 37: South Korea USA Customs Brokerage Market Revenue (Million) Forecast, by Application 2020 & 2033
- Table 38: ASEAN USA Customs Brokerage Market Revenue (Million) Forecast, by Application 2020 & 2033
- Table 39: Oceania USA Customs Brokerage Market Revenue (Million) Forecast, by Application 2020 & 2033
- Table 40: Rest of Asia Pacific USA Customs Brokerage Market Revenue (Million) Forecast, by Application 2020 & 2033
Frequently Asked Questions
1. What is the projected Compound Annual Growth Rate (CAGR) of the USA Customs Brokerage Market?
The projected CAGR is approximately 4.95%.
2. Which companies are prominent players in the USA Customs Brokerage Market?
Key companies in the market include Charter Brokerage LLC, United Parcel Service Inc, Livingston International, Carmichael International, FedEx Corporation, Deutsche Post DHL group, Trans American Customhouse Brokers Inc GHY International Flexport Inc Purolator International Samuel Shapiro & Company Inc Scarbrough International Ltd, Expeditors International, A N Deringer, C H Robinson, CH Powell Company**List Not Exhaustive 8 3 Other Companies (Key Information/Overview).
3. What are the main segments of the USA Customs Brokerage Market?
The market segments include Mode of Transport.
4. Can you provide details about the market size?
The market size is estimated to be USD 5.17 Million as of 2022.
5. What are some drivers contributing to market growth?
Increasing international trade; Advancements in technology.
6. What are the notable trends driving market growth?
Growth in Imports Driving the US Customs Brokerage Market.
7. Are there any restraints impacting market growth?
Geopolitical uncertainities; Changing trade policies.
8. Can you provide examples of recent developments in the market?
November 2023: Kuehne+Nagel completed the acquisition of Farrow, a Canada-based customs broker. This strategic move enhances cross-border capabilities at the US borders with Canada and Mexico.
9. What pricing options are available for accessing the report?
Pricing options include single-user, multi-user, and enterprise licenses priced at USD 3800, USD 4500, and USD 5800 respectively.
10. Is the market size provided in terms of value or volume?
The market size is provided in terms of value, measured in Million.
11. Are there any specific market keywords associated with the report?
Yes, the market keyword associated with the report is "USA Customs Brokerage Market," which aids in identifying and referencing the specific market segment covered.
12. How do I determine which pricing option suits my needs best?
The pricing options vary based on user requirements and access needs. Individual users may opt for single-user licenses, while businesses requiring broader access may choose multi-user or enterprise licenses for cost-effective access to the report.
13. Are there any additional resources or data provided in the USA Customs Brokerage Market report?
While the report offers comprehensive insights, it's advisable to review the specific contents or supplementary materials provided to ascertain if additional resources or data are available.
14. How can I stay updated on further developments or reports in the USA Customs Brokerage Market?
To stay informed about further developments, trends, and reports in the USA Customs Brokerage Market, consider subscribing to industry newsletters, following relevant companies and organizations, or regularly checking reputable industry news sources and publications.
Methodology
Step 1 - Identification of Relevant Samples Size from Population Database


Step 2 - Approaches for Defining Global Market Size (Value, Volume* & Price*)

Note*: In applicable scenarios
Step 3 - Data Sources
Primary Research
- Web Analytics
- Survey Reports
- Research Institute
- Latest Research Reports
- Opinion Leaders
Secondary Research
- Annual Reports
- White Paper
- Latest Press Release
- Industry Association
- Paid Database
- Investor Presentations

Step 4 - Data Triangulation
Involves using different sources of information in order to increase the validity of a study
These sources are likely to be stakeholders in a program - participants, other researchers, program staff, other community members, and so on.
Then we put all data in single framework & apply various statistical tools to find out the dynamic on the market.
During the analysis stage, feedback from the stakeholder groups would be compared to determine areas of agreement as well as areas of divergence