

Key Insights
The global vegetable frozen pizza market is expanding significantly, driven by consumer demand for convenient, healthy, and flavorful meal solutions. Key growth drivers include busy lifestyles necessitating quick meals, increased awareness of vegetable health benefits, and the introduction of diverse, innovative toppings. Continuous product innovation, featuring unique vegetable blends and enhanced crusts, coupled with strategic marketing emphasizing convenience and nutrition, further bolsters market growth. Major companies are investing in R&D to refine offerings and expand market presence. Segmentation analysis reveals preferences for specific vegetable combinations and crust types, informing product development and marketing strategies. Regional consumption patterns vary, with North America and Europe currently leading due to higher disposable incomes and established frozen food habits.
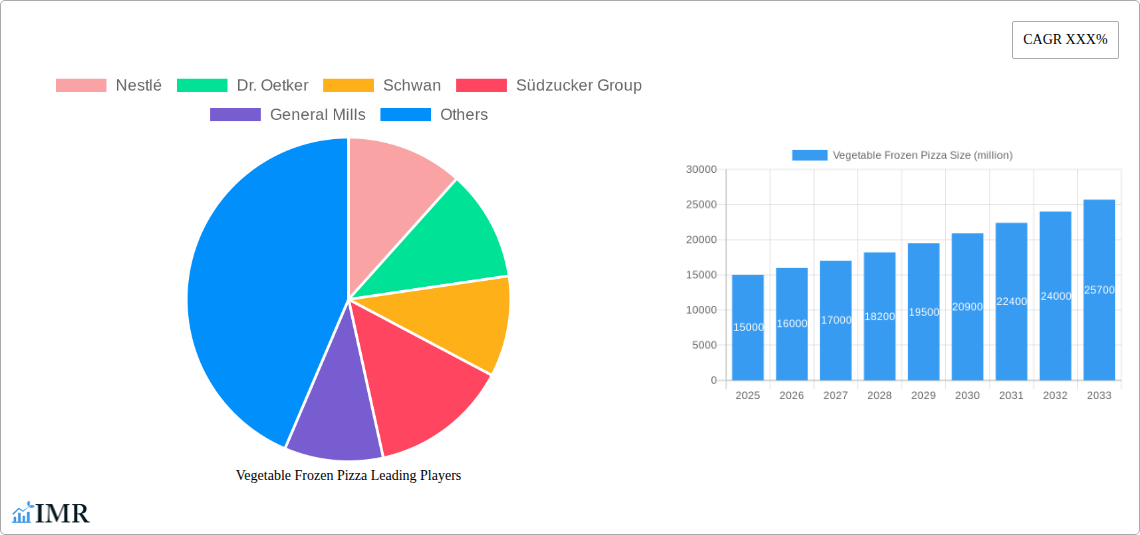
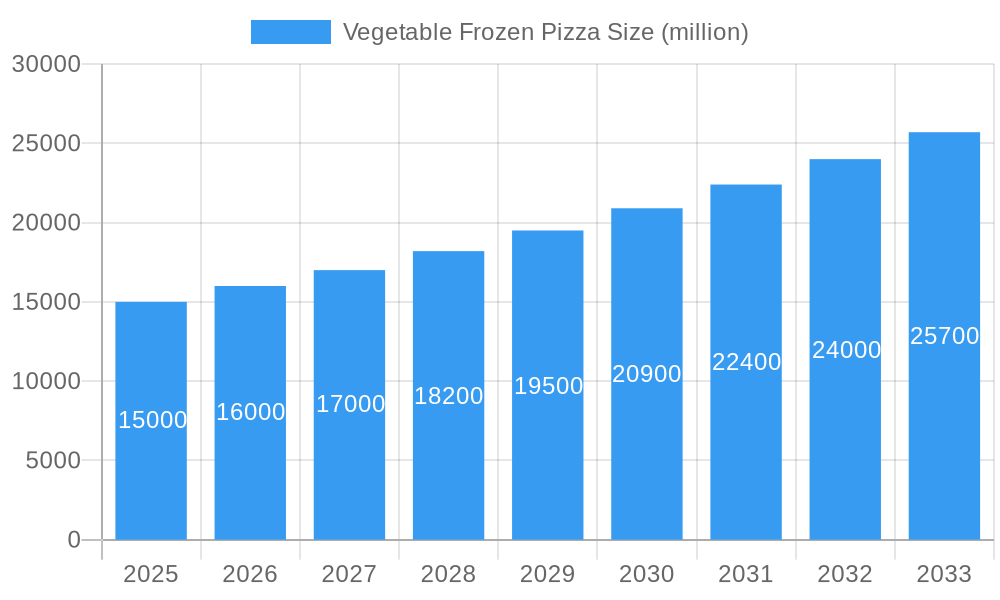
Vegetable Frozen Pizza Market Size (In Billion)
The vegetable frozen pizza market is projected to achieve a compound annual growth rate (CAGR) of 0.5%. The market size was valued at $7 billion in the base year 2025. While sustained growth is anticipated, challenges persist, including raw material price volatility, competition from alternative convenient meal options, and consumer concerns regarding nutritional content and packaging sustainability. To address these challenges, companies are prioritizing sustainable sourcing, innovative packaging, and product transparency to foster consumer trust. Success in this evolving market depends on adapting to consumer preferences, embracing sustainability, and delivering high-quality, innovative products.
Vegetable Frozen Pizza Company Market Share
Vegetable Frozen Pizza Market Report: 2019-2033
This comprehensive report provides a detailed analysis of the global vegetable frozen pizza market, offering invaluable insights for industry professionals, investors, and strategic decision-makers. The study period spans from 2019 to 2033, with 2025 serving as the base and estimated year. The report meticulously examines market dynamics, growth trends, competitive landscapes, and future prospects, encompassing both parent (frozen pizza) and child (vegetable frozen pizza) market segments. Expected market value is in million units.
Vegetable Frozen Pizza Market Dynamics & Structure
This section analyzes the competitive landscape, technological advancements, regulatory influences, and market trends within the vegetable frozen pizza industry. The report quantifies market concentration through market share analysis of key players, revealing the degree of competition and potential for disruption. We investigate the impact of technological innovations such as improved freezing techniques and enhanced vegetable preservation on product quality and consumer appeal. Further, the report details the evolving regulatory frameworks impacting food safety, labeling, and ingredient sourcing, alongside an examination of competitive substitutes (e.g., fresh pizzas, other frozen meals) and their influence on market share. Finally, we explore end-user demographics, identifying key consumer segments driving demand and analyzing the impact of mergers and acquisitions (M&A) activities on market consolidation.
- Market Concentration: The market is moderately concentrated, with the top 5 players holding approximately xx% market share in 2025.
- Technological Innovation: Focus is on improved vegetable preservation to maintain quality and enhance taste. xx% of new product launches in 2024 featured improved vegetable preservation technologies.
- Regulatory Landscape: Stringent food safety regulations in [mention specific regions/countries] are driving production standards.
- M&A Activity: The number of M&A deals in the frozen pizza segment from 2019-2024 totaled xx, with a significant portion involving companies focusing on vegetable varieties.
- Competitive Substitutes: Growth of the fresh pizza segment poses a significant threat; projected market share loss of xx% by 2033 due to this competition.
Vegetable Frozen Pizza Growth Trends & Insights
This section leverages extensive market data to provide a comprehensive overview of the vegetable frozen pizza market's evolution. It details the market size expansion throughout the historical period (2019-2024), highlighting year-on-year growth rates and total market value. We project market size and CAGR (Compound Annual Growth Rate) for the forecast period (2025-2033), supported by robust data analysis and market trend forecasting methodologies. The analysis encompasses adoption rates across various regions and demographics, examining the factors influencing consumer purchasing decisions and the impact of technological disruptions on market expansion. Consumer behavior shifts, such as increased demand for healthier options and convenience foods, are analyzed to understand their influence on market growth.
- Market Size 2024: xx million units
- Projected Market Size 2033: xx million units
- CAGR (2025-2033): xx%
- Market Penetration (2025): xx% in [mention specific region/country].
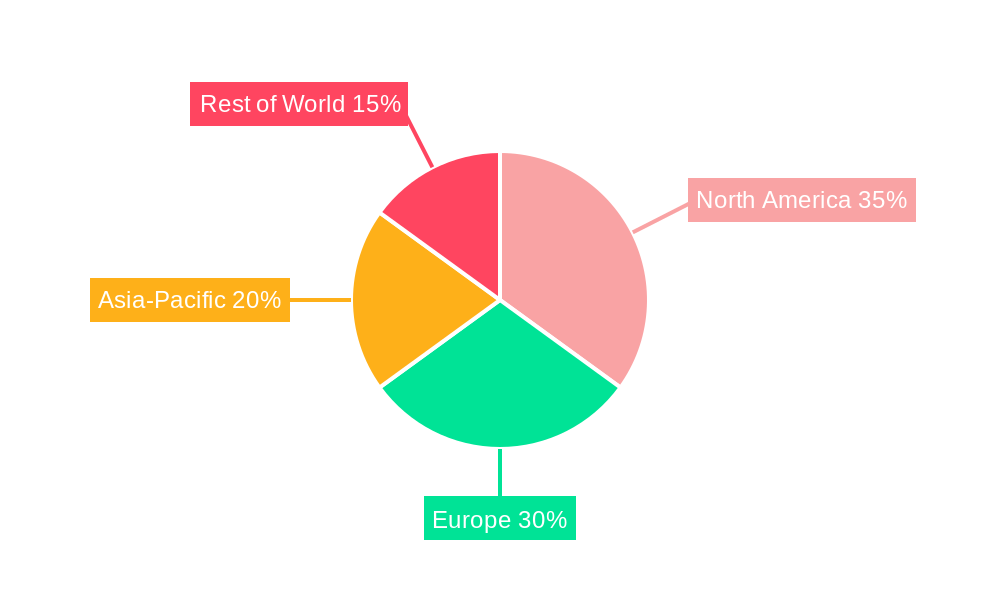
Dominant Regions, Countries, or Segments in Vegetable Frozen Pizza
This section identifies the leading regions and countries driving market growth. We analyze factors contributing to their dominance, including economic conditions, consumer preferences, regulatory environments, and infrastructure development. Key drivers are highlighted using bullet points, while paragraphs provide in-depth analysis of the market share and growth potential of leading regions/countries. The analysis may also delve into specific market segments (e.g., organic vegetable pizzas, specific vegetable types) that demonstrate particularly strong growth.
- Leading Region: North America, holding xx% market share in 2025.
- Key Drivers (North America): High disposable incomes, established frozen food infrastructure, and a preference for convenience foods.
- Growth Potential: Strong growth is expected in Asia-Pacific due to rising disposable incomes and increasing adoption of Western food habits; projected growth of xx% between 2025 and 2033.
Vegetable Frozen Pizza Product Landscape
This section examines the range of vegetable frozen pizzas available, detailing product innovations, applications, and performance metrics. The analysis highlights unique selling propositions (USPs) of different products, such as organic certification, specific vegetable combinations, or unique crust types. We also examine technological advancements impacting product development, including improved freezing and packaging techniques that enhance product quality and shelf life.
The market shows increasing diversity in vegetable combinations, crust types, and sizes to cater to varied consumer preferences. Innovative offerings, such as gluten-free and vegan options, are gaining traction.
Key Drivers, Barriers & Challenges in Vegetable Frozen Pizza
This section identifies the key drivers and challenges shaping the market. Drivers include increased consumer demand for convenient and healthy meal options, technological advancements, and favorable regulatory policies promoting food innovation.
Key Drivers:
- Growing demand for convenient and healthy meal options.
- Technological advancements in freezing and preservation techniques.
- Increased adoption of e-commerce for grocery shopping.
Challenges:
- Fluctuations in raw material prices (vegetables and other ingredients).
- Intense competition from established players and new entrants.
- Rising concerns about artificial preservatives and additives.
- Supply chain disruptions potentially leading to increased prices and reduced availability.
Emerging Opportunities in Vegetable Frozen Pizza
This section highlights emerging trends and opportunities, including untapped markets (e.g., emerging economies), innovative product applications (e.g., customizable vegetable options), and evolving consumer preferences (e.g., demand for plant-based alternatives). These opportunities represent potential avenues for growth and innovation within the vegetable frozen pizza market.
- Expansion into emerging markets with rising disposable incomes.
- Development of personalized vegetable combinations based on consumer preferences.
- Increasing focus on sustainable packaging and eco-friendly production methods.
Growth Accelerators in the Vegetable Frozen Pizza Industry
Technological breakthroughs in food preservation, strategic partnerships between food producers and vegetable suppliers, and successful market expansion strategies into untapped geographic regions are key growth catalysts. These factors will significantly influence long-term market potential and present strategic opportunities for players in the industry.
Technological innovations in vegetable preservation, improved supply chain management, and effective marketing strategies promoting health and convenience are crucial growth catalysts.
Key Players Shaping the Vegetable Frozen Pizza Market
- Nestlé
- Dr. Oetker
- Schwan
- Südzucker Group
- General Mills
- Conagra
- Palermo Villa
- Casa Tarradellas
- Orkla
- Goodfella's Pizza
- Italpizza
- Little Lady Foods
- Roncadin
- Amy's Kitchen, Inc
- Bernatello's
- Ditsch
- Maruha Nichiro
- Sanquan Food
- Ottogi
Notable Milestones in Vegetable Frozen Pizza Sector
- 2020: Increased focus on sustainable packaging by major players.
- 2021: Launch of several new vegan vegetable frozen pizza options.
- 2022: Acquisition of [Company Name] by [Acquiring Company] expands market presence.
- 2023: Introduction of new vegetable varieties (e.g., cauliflower crust) by multiple brands.
- 2024: Significant investment in improved vegetable preservation technologies by leading manufacturers.
In-Depth Vegetable Frozen Pizza Market Outlook
The vegetable frozen pizza market is poised for continued growth, driven by several key factors: increasing consumer demand for convenient and healthy meal options, technological advancements in freezing and preservation, and expansion into new markets. Strategic partnerships and innovations in product offerings will further propel market expansion, creating significant opportunities for both established players and new entrants. The future will see a growing focus on sustainability and health, presenting further opportunities for companies to differentiate themselves in a competitive market.
Vegetable Frozen Pizza Segmentation
-
1. Application
- 1.1. Home
- 1.2. Commercial
-
2. Type
- 2.1. ≤10 Inches
- 2.2. 10-16 Inches
- 2.3. >16 Inches
Vegetable Frozen Pizza Segmentation By Geography
-
1. North America
- 1.1. United States
- 1.2. Canada
- 1.3. Mexico
-
2. South America
- 2.1. Brazil
- 2.2. Argentina
- 2.3. Rest of South America
-
3. Europe
- 3.1. United Kingdom
- 3.2. Germany
- 3.3. France
- 3.4. Italy
- 3.5. Spain
- 3.6. Russia
- 3.7. Benelux
- 3.8. Nordics
- 3.9. Rest of Europe
-
4. Middle East & Africa
- 4.1. Turkey
- 4.2. Israel
- 4.3. GCC
- 4.4. North Africa
- 4.5. South Africa
- 4.6. Rest of Middle East & Africa
-
5. Asia Pacific
- 5.1. China
- 5.2. India
- 5.3. Japan
- 5.4. South Korea
- 5.5. ASEAN
- 5.6. Oceania
- 5.7. Rest of Asia Pacific
Vegetable Frozen Pizza Regional Market Share
Geographic Coverage of Vegetable Frozen Pizza
Vegetable Frozen Pizza REPORT HIGHLIGHTS
| Aspects | Details |
|---|---|
| Study Period | 2020-2034 |
| Base Year | 2025 |
| Estimated Year | 2026 |
| Forecast Period | 2026-2034 |
| Historical Period | 2020-2025 |
| Growth Rate | CAGR of 0.5% from 2020-2034 |
| Segmentation |
|
Table of Contents
- 1. Introduction
- 1.1. Research Scope
- 1.2. Market Segmentation
- 1.3. Research Methodology
- 1.4. Definitions and Assumptions
- 2. Executive Summary
- 2.1. Introduction
- 3. Market Dynamics
- 3.1. Introduction
- 3.2. Market Drivers
- 3.3. Market Restrains
- 3.4. Market Trends
- 4. Market Factor Analysis
- 4.1. Porters Five Forces
- 4.2. Supply/Value Chain
- 4.3. PESTEL analysis
- 4.4. Market Entropy
- 4.5. Patent/Trademark Analysis
- 5. Global Vegetable Frozen Pizza Analysis, Insights and Forecast, 2020-2032
- 5.1. Market Analysis, Insights and Forecast - by Application
- 5.1.1. Home
- 5.1.2. Commercial
- 5.2. Market Analysis, Insights and Forecast - by Type
- 5.2.1. ≤10 Inches
- 5.2.2. 10-16 Inches
- 5.2.3. >16 Inches
- 5.3. Market Analysis, Insights and Forecast - by Region
- 5.3.1. North America
- 5.3.2. South America
- 5.3.3. Europe
- 5.3.4. Middle East & Africa
- 5.3.5. Asia Pacific
- 5.1. Market Analysis, Insights and Forecast - by Application
- 6. North America Vegetable Frozen Pizza Analysis, Insights and Forecast, 2020-2032
- 6.1. Market Analysis, Insights and Forecast - by Application
- 6.1.1. Home
- 6.1.2. Commercial
- 6.2. Market Analysis, Insights and Forecast - by Type
- 6.2.1. ≤10 Inches
- 6.2.2. 10-16 Inches
- 6.2.3. >16 Inches
- 6.1. Market Analysis, Insights and Forecast - by Application
- 7. South America Vegetable Frozen Pizza Analysis, Insights and Forecast, 2020-2032
- 7.1. Market Analysis, Insights and Forecast - by Application
- 7.1.1. Home
- 7.1.2. Commercial
- 7.2. Market Analysis, Insights and Forecast - by Type
- 7.2.1. ≤10 Inches
- 7.2.2. 10-16 Inches
- 7.2.3. >16 Inches
- 7.1. Market Analysis, Insights and Forecast - by Application
- 8. Europe Vegetable Frozen Pizza Analysis, Insights and Forecast, 2020-2032
- 8.1. Market Analysis, Insights and Forecast - by Application
- 8.1.1. Home
- 8.1.2. Commercial
- 8.2. Market Analysis, Insights and Forecast - by Type
- 8.2.1. ≤10 Inches
- 8.2.2. 10-16 Inches
- 8.2.3. >16 Inches
- 8.1. Market Analysis, Insights and Forecast - by Application
- 9. Middle East & Africa Vegetable Frozen Pizza Analysis, Insights and Forecast, 2020-2032
- 9.1. Market Analysis, Insights and Forecast - by Application
- 9.1.1. Home
- 9.1.2. Commercial
- 9.2. Market Analysis, Insights and Forecast - by Type
- 9.2.1. ≤10 Inches
- 9.2.2. 10-16 Inches
- 9.2.3. >16 Inches
- 9.1. Market Analysis, Insights and Forecast - by Application
- 10. Asia Pacific Vegetable Frozen Pizza Analysis, Insights and Forecast, 2020-2032
- 10.1. Market Analysis, Insights and Forecast - by Application
- 10.1.1. Home
- 10.1.2. Commercial
- 10.2. Market Analysis, Insights and Forecast - by Type
- 10.2.1. ≤10 Inches
- 10.2.2. 10-16 Inches
- 10.2.3. >16 Inches
- 10.1. Market Analysis, Insights and Forecast - by Application
- 11. Competitive Analysis
- 11.1. Global Market Share Analysis 2025
- 11.2. Company Profiles
- 11.2.1 Nestlé
- 11.2.1.1. Overview
- 11.2.1.2. Products
- 11.2.1.3. SWOT Analysis
- 11.2.1.4. Recent Developments
- 11.2.1.5. Financials (Based on Availability)
- 11.2.2 Dr. Oetker
- 11.2.2.1. Overview
- 11.2.2.2. Products
- 11.2.2.3. SWOT Analysis
- 11.2.2.4. Recent Developments
- 11.2.2.5. Financials (Based on Availability)
- 11.2.3 Schwan
- 11.2.3.1. Overview
- 11.2.3.2. Products
- 11.2.3.3. SWOT Analysis
- 11.2.3.4. Recent Developments
- 11.2.3.5. Financials (Based on Availability)
- 11.2.4 Südzucker Group
- 11.2.4.1. Overview
- 11.2.4.2. Products
- 11.2.4.3. SWOT Analysis
- 11.2.4.4. Recent Developments
- 11.2.4.5. Financials (Based on Availability)
- 11.2.5 General Mills
- 11.2.5.1. Overview
- 11.2.5.2. Products
- 11.2.5.3. SWOT Analysis
- 11.2.5.4. Recent Developments
- 11.2.5.5. Financials (Based on Availability)
- 11.2.6 Conagra
- 11.2.6.1. Overview
- 11.2.6.2. Products
- 11.2.6.3. SWOT Analysis
- 11.2.6.4. Recent Developments
- 11.2.6.5. Financials (Based on Availability)
- 11.2.7 Palermo Villa
- 11.2.7.1. Overview
- 11.2.7.2. Products
- 11.2.7.3. SWOT Analysis
- 11.2.7.4. Recent Developments
- 11.2.7.5. Financials (Based on Availability)
- 11.2.8 Casa Tarradellas
- 11.2.8.1. Overview
- 11.2.8.2. Products
- 11.2.8.3. SWOT Analysis
- 11.2.8.4. Recent Developments
- 11.2.8.5. Financials (Based on Availability)
- 11.2.9 Orkla
- 11.2.9.1. Overview
- 11.2.9.2. Products
- 11.2.9.3. SWOT Analysis
- 11.2.9.4. Recent Developments
- 11.2.9.5. Financials (Based on Availability)
- 11.2.10 Goodfella's Pizza
- 11.2.10.1. Overview
- 11.2.10.2. Products
- 11.2.10.3. SWOT Analysis
- 11.2.10.4. Recent Developments
- 11.2.10.5. Financials (Based on Availability)
- 11.2.11 Italpizza
- 11.2.11.1. Overview
- 11.2.11.2. Products
- 11.2.11.3. SWOT Analysis
- 11.2.11.4. Recent Developments
- 11.2.11.5. Financials (Based on Availability)
- 11.2.12 Little Lady Foods
- 11.2.12.1. Overview
- 11.2.12.2. Products
- 11.2.12.3. SWOT Analysis
- 11.2.12.4. Recent Developments
- 11.2.12.5. Financials (Based on Availability)
- 11.2.13 Roncadin
- 11.2.13.1. Overview
- 11.2.13.2. Products
- 11.2.13.3. SWOT Analysis
- 11.2.13.4. Recent Developments
- 11.2.13.5. Financials (Based on Availability)
- 11.2.14 Amy's Kitchen
- 11.2.14.1. Overview
- 11.2.14.2. Products
- 11.2.14.3. SWOT Analysis
- 11.2.14.4. Recent Developments
- 11.2.14.5. Financials (Based on Availability)
- 11.2.15 Inc
- 11.2.15.1. Overview
- 11.2.15.2. Products
- 11.2.15.3. SWOT Analysis
- 11.2.15.4. Recent Developments
- 11.2.15.5. Financials (Based on Availability)
- 11.2.16 Bernatello's
- 11.2.16.1. Overview
- 11.2.16.2. Products
- 11.2.16.3. SWOT Analysis
- 11.2.16.4. Recent Developments
- 11.2.16.5. Financials (Based on Availability)
- 11.2.17 Ditsch
- 11.2.17.1. Overview
- 11.2.17.2. Products
- 11.2.17.3. SWOT Analysis
- 11.2.17.4. Recent Developments
- 11.2.17.5. Financials (Based on Availability)
- 11.2.18 Maruha Nichiro
- 11.2.18.1. Overview
- 11.2.18.2. Products
- 11.2.18.3. SWOT Analysis
- 11.2.18.4. Recent Developments
- 11.2.18.5. Financials (Based on Availability)
- 11.2.19 Sanquan Food
- 11.2.19.1. Overview
- 11.2.19.2. Products
- 11.2.19.3. SWOT Analysis
- 11.2.19.4. Recent Developments
- 11.2.19.5. Financials (Based on Availability)
- 11.2.20 Ottogi
- 11.2.20.1. Overview
- 11.2.20.2. Products
- 11.2.20.3. SWOT Analysis
- 11.2.20.4. Recent Developments
- 11.2.20.5. Financials (Based on Availability)
- 11.2.1 Nestlé
List of Figures
- Figure 1: Global Vegetable Frozen Pizza Revenue Breakdown (billion, %) by Region 2025 & 2033
- Figure 2: Global Vegetable Frozen Pizza Volume Breakdown (K, %) by Region 2025 & 2033
- Figure 3: North America Vegetable Frozen Pizza Revenue (billion), by Application 2025 & 2033
- Figure 4: North America Vegetable Frozen Pizza Volume (K), by Application 2025 & 2033
- Figure 5: North America Vegetable Frozen Pizza Revenue Share (%), by Application 2025 & 2033
- Figure 6: North America Vegetable Frozen Pizza Volume Share (%), by Application 2025 & 2033
- Figure 7: North America Vegetable Frozen Pizza Revenue (billion), by Type 2025 & 2033
- Figure 8: North America Vegetable Frozen Pizza Volume (K), by Type 2025 & 2033
- Figure 9: North America Vegetable Frozen Pizza Revenue Share (%), by Type 2025 & 2033
- Figure 10: North America Vegetable Frozen Pizza Volume Share (%), by Type 2025 & 2033
- Figure 11: North America Vegetable Frozen Pizza Revenue (billion), by Country 2025 & 2033
- Figure 12: North America Vegetable Frozen Pizza Volume (K), by Country 2025 & 2033
- Figure 13: North America Vegetable Frozen Pizza Revenue Share (%), by Country 2025 & 2033
- Figure 14: North America Vegetable Frozen Pizza Volume Share (%), by Country 2025 & 2033
- Figure 15: South America Vegetable Frozen Pizza Revenue (billion), by Application 2025 & 2033
- Figure 16: South America Vegetable Frozen Pizza Volume (K), by Application 2025 & 2033
- Figure 17: South America Vegetable Frozen Pizza Revenue Share (%), by Application 2025 & 2033
- Figure 18: South America Vegetable Frozen Pizza Volume Share (%), by Application 2025 & 2033
- Figure 19: South America Vegetable Frozen Pizza Revenue (billion), by Type 2025 & 2033
- Figure 20: South America Vegetable Frozen Pizza Volume (K), by Type 2025 & 2033
- Figure 21: South America Vegetable Frozen Pizza Revenue Share (%), by Type 2025 & 2033
- Figure 22: South America Vegetable Frozen Pizza Volume Share (%), by Type 2025 & 2033
- Figure 23: South America Vegetable Frozen Pizza Revenue (billion), by Country 2025 & 2033
- Figure 24: South America Vegetable Frozen Pizza Volume (K), by Country 2025 & 2033
- Figure 25: South America Vegetable Frozen Pizza Revenue Share (%), by Country 2025 & 2033
- Figure 26: South America Vegetable Frozen Pizza Volume Share (%), by Country 2025 & 2033
- Figure 27: Europe Vegetable Frozen Pizza Revenue (billion), by Application 2025 & 2033
- Figure 28: Europe Vegetable Frozen Pizza Volume (K), by Application 2025 & 2033
- Figure 29: Europe Vegetable Frozen Pizza Revenue Share (%), by Application 2025 & 2033
- Figure 30: Europe Vegetable Frozen Pizza Volume Share (%), by Application 2025 & 2033
- Figure 31: Europe Vegetable Frozen Pizza Revenue (billion), by Type 2025 & 2033
- Figure 32: Europe Vegetable Frozen Pizza Volume (K), by Type 2025 & 2033
- Figure 33: Europe Vegetable Frozen Pizza Revenue Share (%), by Type 2025 & 2033
- Figure 34: Europe Vegetable Frozen Pizza Volume Share (%), by Type 2025 & 2033
- Figure 35: Europe Vegetable Frozen Pizza Revenue (billion), by Country 2025 & 2033
- Figure 36: Europe Vegetable Frozen Pizza Volume (K), by Country 2025 & 2033
- Figure 37: Europe Vegetable Frozen Pizza Revenue Share (%), by Country 2025 & 2033
- Figure 38: Europe Vegetable Frozen Pizza Volume Share (%), by Country 2025 & 2033
- Figure 39: Middle East & Africa Vegetable Frozen Pizza Revenue (billion), by Application 2025 & 2033
- Figure 40: Middle East & Africa Vegetable Frozen Pizza Volume (K), by Application 2025 & 2033
- Figure 41: Middle East & Africa Vegetable Frozen Pizza Revenue Share (%), by Application 2025 & 2033
- Figure 42: Middle East & Africa Vegetable Frozen Pizza Volume Share (%), by Application 2025 & 2033
- Figure 43: Middle East & Africa Vegetable Frozen Pizza Revenue (billion), by Type 2025 & 2033
- Figure 44: Middle East & Africa Vegetable Frozen Pizza Volume (K), by Type 2025 & 2033
- Figure 45: Middle East & Africa Vegetable Frozen Pizza Revenue Share (%), by Type 2025 & 2033
- Figure 46: Middle East & Africa Vegetable Frozen Pizza Volume Share (%), by Type 2025 & 2033
- Figure 47: Middle East & Africa Vegetable Frozen Pizza Revenue (billion), by Country 2025 & 2033
- Figure 48: Middle East & Africa Vegetable Frozen Pizza Volume (K), by Country 2025 & 2033
- Figure 49: Middle East & Africa Vegetable Frozen Pizza Revenue Share (%), by Country 2025 & 2033
- Figure 50: Middle East & Africa Vegetable Frozen Pizza Volume Share (%), by Country 2025 & 2033
- Figure 51: Asia Pacific Vegetable Frozen Pizza Revenue (billion), by Application 2025 & 2033
- Figure 52: Asia Pacific Vegetable Frozen Pizza Volume (K), by Application 2025 & 2033
- Figure 53: Asia Pacific Vegetable Frozen Pizza Revenue Share (%), by Application 2025 & 2033
- Figure 54: Asia Pacific Vegetable Frozen Pizza Volume Share (%), by Application 2025 & 2033
- Figure 55: Asia Pacific Vegetable Frozen Pizza Revenue (billion), by Type 2025 & 2033
- Figure 56: Asia Pacific Vegetable Frozen Pizza Volume (K), by Type 2025 & 2033
- Figure 57: Asia Pacific Vegetable Frozen Pizza Revenue Share (%), by Type 2025 & 2033
- Figure 58: Asia Pacific Vegetable Frozen Pizza Volume Share (%), by Type 2025 & 2033
- Figure 59: Asia Pacific Vegetable Frozen Pizza Revenue (billion), by Country 2025 & 2033
- Figure 60: Asia Pacific Vegetable Frozen Pizza Volume (K), by Country 2025 & 2033
- Figure 61: Asia Pacific Vegetable Frozen Pizza Revenue Share (%), by Country 2025 & 2033
- Figure 62: Asia Pacific Vegetable Frozen Pizza Volume Share (%), by Country 2025 & 2033
List of Tables
- Table 1: Global Vegetable Frozen Pizza Revenue billion Forecast, by Application 2020 & 2033
- Table 2: Global Vegetable Frozen Pizza Volume K Forecast, by Application 2020 & 2033
- Table 3: Global Vegetable Frozen Pizza Revenue billion Forecast, by Type 2020 & 2033
- Table 4: Global Vegetable Frozen Pizza Volume K Forecast, by Type 2020 & 2033
- Table 5: Global Vegetable Frozen Pizza Revenue billion Forecast, by Region 2020 & 2033
- Table 6: Global Vegetable Frozen Pizza Volume K Forecast, by Region 2020 & 2033
- Table 7: Global Vegetable Frozen Pizza Revenue billion Forecast, by Application 2020 & 2033
- Table 8: Global Vegetable Frozen Pizza Volume K Forecast, by Application 2020 & 2033
- Table 9: Global Vegetable Frozen Pizza Revenue billion Forecast, by Type 2020 & 2033
- Table 10: Global Vegetable Frozen Pizza Volume K Forecast, by Type 2020 & 2033
- Table 11: Global Vegetable Frozen Pizza Revenue billion Forecast, by Country 2020 & 2033
- Table 12: Global Vegetable Frozen Pizza Volume K Forecast, by Country 2020 & 2033
- Table 13: United States Vegetable Frozen Pizza Revenue (billion) Forecast, by Application 2020 & 2033
- Table 14: United States Vegetable Frozen Pizza Volume (K) Forecast, by Application 2020 & 2033
- Table 15: Canada Vegetable Frozen Pizza Revenue (billion) Forecast, by Application 2020 & 2033
- Table 16: Canada Vegetable Frozen Pizza Volume (K) Forecast, by Application 2020 & 2033
- Table 17: Mexico Vegetable Frozen Pizza Revenue (billion) Forecast, by Application 2020 & 2033
- Table 18: Mexico Vegetable Frozen Pizza Volume (K) Forecast, by Application 2020 & 2033
- Table 19: Global Vegetable Frozen Pizza Revenue billion Forecast, by Application 2020 & 2033
- Table 20: Global Vegetable Frozen Pizza Volume K Forecast, by Application 2020 & 2033
- Table 21: Global Vegetable Frozen Pizza Revenue billion Forecast, by Type 2020 & 2033
- Table 22: Global Vegetable Frozen Pizza Volume K Forecast, by Type 2020 & 2033
- Table 23: Global Vegetable Frozen Pizza Revenue billion Forecast, by Country 2020 & 2033
- Table 24: Global Vegetable Frozen Pizza Volume K Forecast, by Country 2020 & 2033
- Table 25: Brazil Vegetable Frozen Pizza Revenue (billion) Forecast, by Application 2020 & 2033
- Table 26: Brazil Vegetable Frozen Pizza Volume (K) Forecast, by Application 2020 & 2033
- Table 27: Argentina Vegetable Frozen Pizza Revenue (billion) Forecast, by Application 2020 & 2033
- Table 28: Argentina Vegetable Frozen Pizza Volume (K) Forecast, by Application 2020 & 2033
- Table 29: Rest of South America Vegetable Frozen Pizza Revenue (billion) Forecast, by Application 2020 & 2033
- Table 30: Rest of South America Vegetable Frozen Pizza Volume (K) Forecast, by Application 2020 & 2033
- Table 31: Global Vegetable Frozen Pizza Revenue billion Forecast, by Application 2020 & 2033
- Table 32: Global Vegetable Frozen Pizza Volume K Forecast, by Application 2020 & 2033
- Table 33: Global Vegetable Frozen Pizza Revenue billion Forecast, by Type 2020 & 2033
- Table 34: Global Vegetable Frozen Pizza Volume K Forecast, by Type 2020 & 2033
- Table 35: Global Vegetable Frozen Pizza Revenue billion Forecast, by Country 2020 & 2033
- Table 36: Global Vegetable Frozen Pizza Volume K Forecast, by Country 2020 & 2033
- Table 37: United Kingdom Vegetable Frozen Pizza Revenue (billion) Forecast, by Application 2020 & 2033
- Table 38: United Kingdom Vegetable Frozen Pizza Volume (K) Forecast, by Application 2020 & 2033
- Table 39: Germany Vegetable Frozen Pizza Revenue (billion) Forecast, by Application 2020 & 2033
- Table 40: Germany Vegetable Frozen Pizza Volume (K) Forecast, by Application 2020 & 2033
- Table 41: France Vegetable Frozen Pizza Revenue (billion) Forecast, by Application 2020 & 2033
- Table 42: France Vegetable Frozen Pizza Volume (K) Forecast, by Application 2020 & 2033
- Table 43: Italy Vegetable Frozen Pizza Revenue (billion) Forecast, by Application 2020 & 2033
- Table 44: Italy Vegetable Frozen Pizza Volume (K) Forecast, by Application 2020 & 2033
- Table 45: Spain Vegetable Frozen Pizza Revenue (billion) Forecast, by Application 2020 & 2033
- Table 46: Spain Vegetable Frozen Pizza Volume (K) Forecast, by Application 2020 & 2033
- Table 47: Russia Vegetable Frozen Pizza Revenue (billion) Forecast, by Application 2020 & 2033
- Table 48: Russia Vegetable Frozen Pizza Volume (K) Forecast, by Application 2020 & 2033
- Table 49: Benelux Vegetable Frozen Pizza Revenue (billion) Forecast, by Application 2020 & 2033
- Table 50: Benelux Vegetable Frozen Pizza Volume (K) Forecast, by Application 2020 & 2033
- Table 51: Nordics Vegetable Frozen Pizza Revenue (billion) Forecast, by Application 2020 & 2033
- Table 52: Nordics Vegetable Frozen Pizza Volume (K) Forecast, by Application 2020 & 2033
- Table 53: Rest of Europe Vegetable Frozen Pizza Revenue (billion) Forecast, by Application 2020 & 2033
- Table 54: Rest of Europe Vegetable Frozen Pizza Volume (K) Forecast, by Application 2020 & 2033
- Table 55: Global Vegetable Frozen Pizza Revenue billion Forecast, by Application 2020 & 2033
- Table 56: Global Vegetable Frozen Pizza Volume K Forecast, by Application 2020 & 2033
- Table 57: Global Vegetable Frozen Pizza Revenue billion Forecast, by Type 2020 & 2033
- Table 58: Global Vegetable Frozen Pizza Volume K Forecast, by Type 2020 & 2033
- Table 59: Global Vegetable Frozen Pizza Revenue billion Forecast, by Country 2020 & 2033
- Table 60: Global Vegetable Frozen Pizza Volume K Forecast, by Country 2020 & 2033
- Table 61: Turkey Vegetable Frozen Pizza Revenue (billion) Forecast, by Application 2020 & 2033
- Table 62: Turkey Vegetable Frozen Pizza Volume (K) Forecast, by Application 2020 & 2033
- Table 63: Israel Vegetable Frozen Pizza Revenue (billion) Forecast, by Application 2020 & 2033
- Table 64: Israel Vegetable Frozen Pizza Volume (K) Forecast, by Application 2020 & 2033
- Table 65: GCC Vegetable Frozen Pizza Revenue (billion) Forecast, by Application 2020 & 2033
- Table 66: GCC Vegetable Frozen Pizza Volume (K) Forecast, by Application 2020 & 2033
- Table 67: North Africa Vegetable Frozen Pizza Revenue (billion) Forecast, by Application 2020 & 2033
- Table 68: North Africa Vegetable Frozen Pizza Volume (K) Forecast, by Application 2020 & 2033
- Table 69: South Africa Vegetable Frozen Pizza Revenue (billion) Forecast, by Application 2020 & 2033
- Table 70: South Africa Vegetable Frozen Pizza Volume (K) Forecast, by Application 2020 & 2033
- Table 71: Rest of Middle East & Africa Vegetable Frozen Pizza Revenue (billion) Forecast, by Application 2020 & 2033
- Table 72: Rest of Middle East & Africa Vegetable Frozen Pizza Volume (K) Forecast, by Application 2020 & 2033
- Table 73: Global Vegetable Frozen Pizza Revenue billion Forecast, by Application 2020 & 2033
- Table 74: Global Vegetable Frozen Pizza Volume K Forecast, by Application 2020 & 2033
- Table 75: Global Vegetable Frozen Pizza Revenue billion Forecast, by Type 2020 & 2033
- Table 76: Global Vegetable Frozen Pizza Volume K Forecast, by Type 2020 & 2033
- Table 77: Global Vegetable Frozen Pizza Revenue billion Forecast, by Country 2020 & 2033
- Table 78: Global Vegetable Frozen Pizza Volume K Forecast, by Country 2020 & 2033
- Table 79: China Vegetable Frozen Pizza Revenue (billion) Forecast, by Application 2020 & 2033
- Table 80: China Vegetable Frozen Pizza Volume (K) Forecast, by Application 2020 & 2033
- Table 81: India Vegetable Frozen Pizza Revenue (billion) Forecast, by Application 2020 & 2033
- Table 82: India Vegetable Frozen Pizza Volume (K) Forecast, by Application 2020 & 2033
- Table 83: Japan Vegetable Frozen Pizza Revenue (billion) Forecast, by Application 2020 & 2033
- Table 84: Japan Vegetable Frozen Pizza Volume (K) Forecast, by Application 2020 & 2033
- Table 85: South Korea Vegetable Frozen Pizza Revenue (billion) Forecast, by Application 2020 & 2033
- Table 86: South Korea Vegetable Frozen Pizza Volume (K) Forecast, by Application 2020 & 2033
- Table 87: ASEAN Vegetable Frozen Pizza Revenue (billion) Forecast, by Application 2020 & 2033
- Table 88: ASEAN Vegetable Frozen Pizza Volume (K) Forecast, by Application 2020 & 2033
- Table 89: Oceania Vegetable Frozen Pizza Revenue (billion) Forecast, by Application 2020 & 2033
- Table 90: Oceania Vegetable Frozen Pizza Volume (K) Forecast, by Application 2020 & 2033
- Table 91: Rest of Asia Pacific Vegetable Frozen Pizza Revenue (billion) Forecast, by Application 2020 & 2033
- Table 92: Rest of Asia Pacific Vegetable Frozen Pizza Volume (K) Forecast, by Application 2020 & 2033
Frequently Asked Questions
1. What is the projected Compound Annual Growth Rate (CAGR) of the Vegetable Frozen Pizza?
The projected CAGR is approximately 0.5%.
2. Which companies are prominent players in the Vegetable Frozen Pizza?
Key companies in the market include Nestlé, Dr. Oetker, Schwan, Südzucker Group, General Mills, Conagra, Palermo Villa, Casa Tarradellas, Orkla, Goodfella's Pizza, Italpizza, Little Lady Foods, Roncadin, Amy's Kitchen, Inc, Bernatello's, Ditsch, Maruha Nichiro, Sanquan Food, Ottogi.
3. What are the main segments of the Vegetable Frozen Pizza?
The market segments include Application, Type.
4. Can you provide details about the market size?
The market size is estimated to be USD 7 billion as of 2022.
5. What are some drivers contributing to market growth?
N/A
6. What are the notable trends driving market growth?
N/A
7. Are there any restraints impacting market growth?
N/A
8. Can you provide examples of recent developments in the market?
N/A
9. What pricing options are available for accessing the report?
Pricing options include single-user, multi-user, and enterprise licenses priced at USD 3950.00, USD 5925.00, and USD 7900.00 respectively.
10. Is the market size provided in terms of value or volume?
The market size is provided in terms of value, measured in billion and volume, measured in K.
11. Are there any specific market keywords associated with the report?
Yes, the market keyword associated with the report is "Vegetable Frozen Pizza," which aids in identifying and referencing the specific market segment covered.
12. How do I determine which pricing option suits my needs best?
The pricing options vary based on user requirements and access needs. Individual users may opt for single-user licenses, while businesses requiring broader access may choose multi-user or enterprise licenses for cost-effective access to the report.
13. Are there any additional resources or data provided in the Vegetable Frozen Pizza report?
While the report offers comprehensive insights, it's advisable to review the specific contents or supplementary materials provided to ascertain if additional resources or data are available.
14. How can I stay updated on further developments or reports in the Vegetable Frozen Pizza?
To stay informed about further developments, trends, and reports in the Vegetable Frozen Pizza, consider subscribing to industry newsletters, following relevant companies and organizations, or regularly checking reputable industry news sources and publications.
Methodology
Step 1 - Identification of Relevant Samples Size from Population Database


Step 2 - Approaches for Defining Global Market Size (Value, Volume* & Price*)

Note*: In applicable scenarios
Step 3 - Data Sources
Primary Research
- Web Analytics
- Survey Reports
- Research Institute
- Latest Research Reports
- Opinion Leaders
Secondary Research
- Annual Reports
- White Paper
- Latest Press Release
- Industry Association
- Paid Database
- Investor Presentations

Step 4 - Data Triangulation
Involves using different sources of information in order to increase the validity of a study
These sources are likely to be stakeholders in a program - participants, other researchers, program staff, other community members, and so on.
Then we put all data in single framework & apply various statistical tools to find out the dynamic on the market.
During the analysis stage, feedback from the stakeholder groups would be compared to determine areas of agreement as well as areas of divergence