

Key Insights
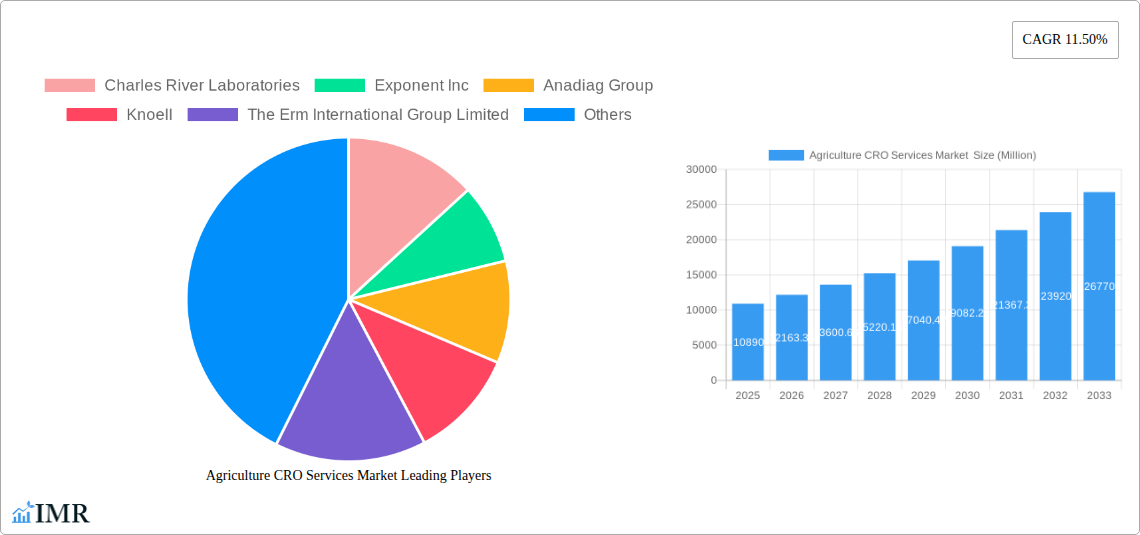
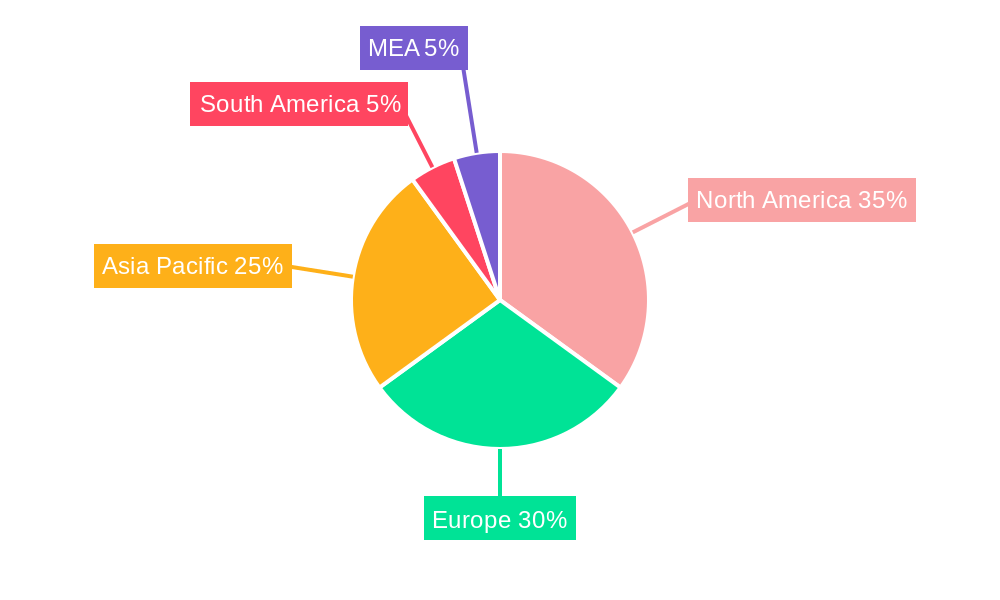
The global Agriculture CRO Services market is experiencing robust growth, projected to reach \$10.89 billion in 2025 and maintain a Compound Annual Growth Rate (CAGR) of 11.50% from 2025 to 2033. This expansion is driven by several key factors. The increasing demand for higher crop yields to meet the growing global food needs necessitates advanced research and development in agricultural technologies. This translates into greater reliance on Contract Research Organizations (CROs) specializing in agricultural services. Furthermore, the rising adoption of precision agriculture techniques, including data analytics and automation, is boosting the demand for specialized CRO services in areas like field testing, laboratory analysis, and regulatory compliance. Stringent regulatory requirements for new agricultural products are also fueling growth, as companies increasingly outsource regulatory affairs to experienced CROs to ensure compliance and expedite product launches. The market is segmented by service type (Field Services, Laboratory Services, Regulatory Services, and Other Services) and sector (Crop Protection Chemicals, Fertilizers, and Seeds), with each segment contributing to the overall market expansion. North America and Europe currently hold significant market shares, but the Asia-Pacific region is projected to exhibit substantial growth due to the increasing adoption of advanced agricultural practices and expanding agricultural production.
Agriculture CRO Services Market Market Size (In Billion)
The competitive landscape is characterized by a mix of large multinational CROs and specialized niche players. Key players such as Charles River Laboratories, Eurofins Scientific, and others are strategically investing in expanding their service offerings and geographic reach to capitalize on the market's growth potential. The market's future growth trajectory will depend on several factors including advancements in agricultural biotechnology, government regulations and policies supporting agricultural innovation, and the overall global economic conditions. Nevertheless, the long-term outlook for the Agriculture CRO Services market remains positive, driven by the persistent need for innovation and efficiency in the agricultural sector. Further segmentation within the market, based on specific crop types or agricultural techniques, is expected to emerge as the market matures, offering specialized services and creating new opportunities for CROs.

Agriculture CRO Services Market Company Market Share
Agriculture CRO Services Market: A Comprehensive Market Report (2019-2033)
This in-depth report provides a comprehensive analysis of the Agriculture CRO Services Market, encompassing market dynamics, growth trends, regional dominance, product landscape, key players, and future outlook. The study period spans from 2019 to 2033, with 2025 serving as the base and estimated year. The report is invaluable for industry professionals, investors, and strategic decision-makers seeking a detailed understanding of this dynamic market. The total market size in 2025 is estimated at xx Million and is projected to reach xx Million by 2033.
Agriculture CRO Services Market Market Dynamics & Structure
The Agriculture CRO Services market is characterized by moderate concentration, with several large players and numerous smaller specialized firms. Technological innovation, particularly in data analytics and precision agriculture, is a key driver, while stringent regulatory frameworks and evolving consumer demand for sustainable agricultural practices significantly shape market dynamics. The market exhibits considerable M&A activity, reflecting consolidation trends and the pursuit of expanded service offerings. The historical period (2019-2024) saw a xx% CAGR, demonstrating substantial growth.
- Market Concentration: Moderately concentrated, with top 5 players holding approximately xx% market share in 2025.
- Technological Innovation: Adoption of AI, machine learning, and IoT for data analysis and precision farming drives service demand.
- Regulatory Landscape: Stringent regulations regarding pesticide residues, GMOs, and environmental impact influence service needs.
- Competitive Substitutes: Limited direct substitutes, but internal R&D capabilities of large agri-businesses can pose some competition.
- End-User Demographics: Primarily large multinational agri-businesses and smaller specialized agricultural producers.
- M&A Trends: Significant M&A activity observed, with xx major deals concluded in the past five years, indicating consolidation and expansion strategies.
Agriculture CRO Services Market Growth Trends & Insights
The Agriculture CRO Services market demonstrates robust growth, driven by factors including increasing demand for high-quality agricultural products, the growing adoption of biotechnology, stringent regulatory requirements, and the rise of precision agriculture. The market size is projected to experience a CAGR of xx% during the forecast period (2025-2033), significantly surpassing the historical growth rate. This growth is fueled by the rising adoption of advanced technologies and the increasing need for efficient and cost-effective solutions for agricultural research and development. Market penetration of CRO services is steadily increasing, particularly amongst smaller to medium-sized agricultural businesses.
Dominant Regions, Countries, or Segments in Agriculture CRO Services Market
North America currently holds the largest market share, driven by strong R&D investments and the presence of major players. However, Asia-Pacific is anticipated to show the highest growth rate over the forecast period due to expanding agricultural activities and rising adoption of advanced technologies in developing economies. Within the service types, Laboratory Services holds the largest share, followed by Field Services and Regulatory Services. The Crop Protection Chemicals sector commands the highest demand, reflecting the industry's focus on developing new and improved crop protection solutions.
- Key Drivers (North America): High R&D expenditure, established CRO infrastructure, and stringent regulatory standards.
- Key Drivers (Asia-Pacific): Rapid economic growth, expansion of agricultural land, and increasing adoption of modern farming techniques.
- Dominant Service Type: Laboratory Services (xx% market share in 2025) due to the need for sophisticated analytical testing.
- Dominant Sector: Crop Protection Chemicals (xx% market share in 2025) given the large investments in new pesticide development.
Agriculture CRO Services Market Product Landscape
The Agriculture CRO Services market offers a diverse range of services, including field trials, laboratory testing, regulatory support, and data analysis. Recent innovations focus on integrating advanced technologies such as AI and machine learning to enhance data analysis, improve the accuracy of experimental designs, and accelerate the development process of new agricultural products. These innovations deliver faster turnaround times, enhanced data insights, and reduced costs for clients. Unique selling propositions often include specialized expertise in specific crops or agricultural practices and strong regulatory compliance capabilities.
Key Drivers, Barriers & Challenges in Agriculture CRO Services Market
Key Drivers: Increasing demand for food security, stringent regulations for crop protection chemicals, and growing adoption of precision agriculture technologies are key drivers. The rising need for faster and more efficient R&D processes, coupled with the complexities of agricultural research, also fuels the demand for CRO services.
Key Barriers & Challenges: High research and development costs, competition from internal R&D departments of large agricultural firms, and stringent regulatory compliance requirements pose significant challenges. Supply chain disruptions caused by external factors can also negatively impact the industry. Additionally, competition amongst CROs is fierce, leading to pressure on pricing.
Emerging Opportunities in Agriculture CRO Services Market
Emerging opportunities include expansion into untapped markets in developing countries, increased focus on sustainable and organic agriculture research, and the development of specialized services for niche crops or agricultural practices. Growth opportunities also exist in the development of new technologies, such as advanced analytics and precision agriculture tools, integrated within CRO service offerings.
Growth Accelerators in the Agriculture CRO Services Market Industry
Strategic partnerships between CROs and agricultural technology companies, the development of innovative data analytics platforms, and expansion into new geographical markets are key catalysts for long-term growth. Technological breakthroughs in areas such as genomics, molecular breeding, and precision agriculture are also accelerating market expansion and creating new service opportunities.
Key Players Shaping the Agriculture CRO Services Market Market
- Charles River Laboratories
- Exponent Inc
- Anadiag Group
- Knoell
- The ERM International Group Limited
- Technology Sciences Group Consulting Limited
- Eurofins Scientific
- IES Limited (i2l Research Limited)
- Ibacon Gmbh
- Syntech Research Group
Notable Milestones in Agriculture CRO Services Market Sector
- December 2023: Eurofins acquired SGS Crop Science operations in 14 countries, significantly expanding its service offerings in agriscience contract research and agro-testing.
- October 2023: SAI Global partnered with ERM International Group Limited, enhancing EHS solutions for agricultural clients.
- January 2023: SynTech Research Group received an Agronomic Evaluation Unit from the Colombian Institute of Agriculture (ICA), expanding its seed development and registration testing services nationwide.
In-Depth Agriculture CRO Services Market Market Outlook
The Agriculture CRO Services market is poised for continued strong growth, driven by technological advancements and increasing demand for efficient and sustainable agricultural practices. Strategic partnerships, geographical expansion, and the development of specialized services will be crucial for players to capitalize on the long-term growth potential. The market is expected to witness a significant shift towards integrated services, leveraging advanced technologies to provide comprehensive solutions to clients.
Agriculture CRO Services Market Segmentation
- 1. Production Analysis
- 2. Consumption Analysis
- 3. Import Market Analysis (Value & Volume)
- 4. Export Market Analysis (Value & Volume)
- 5. Price Trend Analysis
Agriculture CRO Services Market Segmentation By Geography
-
1. North America
- 1.1. United States
- 1.2. Canada
- 1.3. Mexico
-
2. South America
- 2.1. Brazil
- 2.2. Argentina
- 2.3. Rest of South America
-
3. Europe
- 3.1. United Kingdom
- 3.2. Germany
- 3.3. France
- 3.4. Italy
- 3.5. Spain
- 3.6. Russia
- 3.7. Benelux
- 3.8. Nordics
- 3.9. Rest of Europe
-
4. Middle East & Africa
- 4.1. Turkey
- 4.2. Israel
- 4.3. GCC
- 4.4. North Africa
- 4.5. South Africa
- 4.6. Rest of Middle East & Africa
-
5. Asia Pacific
- 5.1. China
- 5.2. India
- 5.3. Japan
- 5.4. South Korea
- 5.5. ASEAN
- 5.6. Oceania
- 5.7. Rest of Asia Pacific
Agriculture CRO Services Market Regional Market Share
Geographic Coverage of Agriculture CRO Services Market
Agriculture CRO Services Market REPORT HIGHLIGHTS
| Aspects | Details |
|---|---|
| Study Period | 2020-2034 |
| Base Year | 2025 |
| Estimated Year | 2026 |
| Forecast Period | 2026-2034 |
| Historical Period | 2020-2025 |
| Growth Rate | CAGR of 11.50% from 2020-2034 |
| Segmentation |
|
Table of Contents
- 1. Introduction
- 1.1. Research Scope
- 1.2. Market Segmentation
- 1.3. Research Objective
- 1.4. Definitions and Assumptions
- 2. Executive Summary
- 2.1. Market Snapshot
- 3. Market Dynamics
- 3.1. Market Drivers
- 3.2. Market Restrains
- 3.3. Market Trends
- 3.4. Market Opportunities
- 4. Market Factor Analysis
- 4.1. Porters Five Forces
- 4.1.1. Bargaining Power of Suppliers
- 4.1.2. Bargaining Power of Buyers
- 4.1.3. Threat of New Entrants
- 4.1.4. Threat of Substitutes
- 4.1.5. Competitive Rivalry
- 4.2. PESTEL analysis
- 4.3. BCG Analysis
- 4.3.1. Stars (High Growth, High Market Share)
- 4.3.2. Cash Cows (Low Growth, High Market Share)
- 4.3.3. Question Mark (High Growth, Low Market Share)
- 4.3.4. Dogs (Low Growth, Low Market Share)
- 4.4. Ansoff Matrix Analysis
- 4.5. Supply Chain Analysis
- 4.6. Regulatory Landscape
- 4.7. Current Market Potential and Opportunity Assessment (TAM–SAM–SOM Framework)
- 4.8. IMR Analyst Note
- 4.1. Porters Five Forces
- 5. Market Analysis, Insights and Forecast 2021-2033
- 5.1. Market Analysis, Insights and Forecast - by Production Analysis
- 5.2. Market Analysis, Insights and Forecast - by Consumption Analysis
- 5.3. Market Analysis, Insights and Forecast - by Import Market Analysis (Value & Volume)
- 5.4. Market Analysis, Insights and Forecast - by Export Market Analysis (Value & Volume)
- 5.5. Market Analysis, Insights and Forecast - by Price Trend Analysis
- 5.6. Market Analysis, Insights and Forecast - by Region
- 5.6.1. North America
- 5.6.2. South America
- 5.6.3. Europe
- 5.6.4. Middle East & Africa
- 5.6.5. Asia Pacific
- 6. Global Agriculture CRO Services Market Analysis, Insights and Forecast, 2021-2033
- 6.1. Market Analysis, Insights and Forecast - by Production Analysis
- 6.2. Market Analysis, Insights and Forecast - by Consumption Analysis
- 6.3. Market Analysis, Insights and Forecast - by Import Market Analysis (Value & Volume)
- 6.4. Market Analysis, Insights and Forecast - by Export Market Analysis (Value & Volume)
- 6.5. Market Analysis, Insights and Forecast - by Price Trend Analysis
- 7. North America Agriculture CRO Services Market Analysis, Insights and Forecast, 2020-2032
- 7.1. Market Analysis, Insights and Forecast - by Production Analysis
- 7.2. Market Analysis, Insights and Forecast - by Consumption Analysis
- 7.3. Market Analysis, Insights and Forecast - by Import Market Analysis (Value & Volume)
- 7.4. Market Analysis, Insights and Forecast - by Export Market Analysis (Value & Volume)
- 7.5. Market Analysis, Insights and Forecast - by Price Trend Analysis
- 8. South America Agriculture CRO Services Market Analysis, Insights and Forecast, 2020-2032
- 8.1. Market Analysis, Insights and Forecast - by Production Analysis
- 8.2. Market Analysis, Insights and Forecast - by Consumption Analysis
- 8.3. Market Analysis, Insights and Forecast - by Import Market Analysis (Value & Volume)
- 8.4. Market Analysis, Insights and Forecast - by Export Market Analysis (Value & Volume)
- 8.5. Market Analysis, Insights and Forecast - by Price Trend Analysis
- 9. Europe Agriculture CRO Services Market Analysis, Insights and Forecast, 2020-2032
- 9.1. Market Analysis, Insights and Forecast - by Production Analysis
- 9.2. Market Analysis, Insights and Forecast - by Consumption Analysis
- 9.3. Market Analysis, Insights and Forecast - by Import Market Analysis (Value & Volume)
- 9.4. Market Analysis, Insights and Forecast - by Export Market Analysis (Value & Volume)
- 9.5. Market Analysis, Insights and Forecast - by Price Trend Analysis
- 10. Middle East & Africa Agriculture CRO Services Market Analysis, Insights and Forecast, 2020-2032
- 10.1. Market Analysis, Insights and Forecast - by Production Analysis
- 10.2. Market Analysis, Insights and Forecast - by Consumption Analysis
- 10.3. Market Analysis, Insights and Forecast - by Import Market Analysis (Value & Volume)
- 10.4. Market Analysis, Insights and Forecast - by Export Market Analysis (Value & Volume)
- 10.5. Market Analysis, Insights and Forecast - by Price Trend Analysis
- 11. Asia Pacific Agriculture CRO Services Market Analysis, Insights and Forecast, 2020-2032
- 11.1. Market Analysis, Insights and Forecast - by Production Analysis
- 11.2. Market Analysis, Insights and Forecast - by Consumption Analysis
- 11.3. Market Analysis, Insights and Forecast - by Import Market Analysis (Value & Volume)
- 11.4. Market Analysis, Insights and Forecast - by Export Market Analysis (Value & Volume)
- 11.5. Market Analysis, Insights and Forecast - by Price Trend Analysis
- 12. Competitive Analysis
- 12.1. Company Profiles
- 12.1.1 Charles River Laboratories
- 12.1.1.1. Company Overview
- 12.1.1.2. Products
- 12.1.1.3. Company Financials
- 12.1.1.4. SWOT Analysis
- 12.1.2 Exponent Inc
- 12.1.2.1. Company Overview
- 12.1.2.2. Products
- 12.1.2.3. Company Financials
- 12.1.2.4. SWOT Analysis
- 12.1.3 Anadiag Group
- 12.1.3.1. Company Overview
- 12.1.3.2. Products
- 12.1.3.3. Company Financials
- 12.1.3.4. SWOT Analysis
- 12.1.4 Knoell
- 12.1.4.1. Company Overview
- 12.1.4.2. Products
- 12.1.4.3. Company Financials
- 12.1.4.4. SWOT Analysis
- 12.1.5 The Erm International Group Limited
- 12.1.5.1. Company Overview
- 12.1.5.2. Products
- 12.1.5.3. Company Financials
- 12.1.5.4. SWOT Analysis
- 12.1.6 Technology Sciences Group Consulting Limited
- 12.1.6.1. Company Overview
- 12.1.6.2. Products
- 12.1.6.3. Company Financials
- 12.1.6.4. SWOT Analysis
- 12.1.7 Eurofins Scientific
- 12.1.7.1. Company Overview
- 12.1.7.2. Products
- 12.1.7.3. Company Financials
- 12.1.7.4. SWOT Analysis
- 12.1.8 Ies Limited (i2l Research Limited)
- 12.1.8.1. Company Overview
- 12.1.8.2. Products
- 12.1.8.3. Company Financials
- 12.1.8.4. SWOT Analysis
- 12.1.9 Ibacon Gmbh*List Not Exhaustive
- 12.1.9.1. Company Overview
- 12.1.9.2. Products
- 12.1.9.3. Company Financials
- 12.1.9.4. SWOT Analysis
- 12.1.10 Syntech Research Group
- 12.1.10.1. Company Overview
- 12.1.10.2. Products
- 12.1.10.3. Company Financials
- 12.1.10.4. SWOT Analysis
- 12.1.1 Charles River Laboratories
- 12.2. Market Entropy
- 12.2.1 Company's Key Areas Served
- 12.2.2 Recent Developments
- 12.3. Company Market Share Analysis 2025
- 12.3.1 Top 5 Companies Market Share Analysis
- 12.3.2 Top 3 Companies Market Share Analysis
- 12.4. List of Potential Customers
- 13. Research Methodology
List of Figures
- Figure 1: Global Agriculture CRO Services Market Revenue Breakdown (Million, %) by Region 2025 & 2033
- Figure 2: North America Agriculture CRO Services Market Revenue (Million), by Production Analysis 2025 & 2033
- Figure 3: North America Agriculture CRO Services Market Revenue Share (%), by Production Analysis 2025 & 2033
- Figure 4: North America Agriculture CRO Services Market Revenue (Million), by Consumption Analysis 2025 & 2033
- Figure 5: North America Agriculture CRO Services Market Revenue Share (%), by Consumption Analysis 2025 & 2033
- Figure 6: North America Agriculture CRO Services Market Revenue (Million), by Import Market Analysis (Value & Volume) 2025 & 2033
- Figure 7: North America Agriculture CRO Services Market Revenue Share (%), by Import Market Analysis (Value & Volume) 2025 & 2033
- Figure 8: North America Agriculture CRO Services Market Revenue (Million), by Export Market Analysis (Value & Volume) 2025 & 2033
- Figure 9: North America Agriculture CRO Services Market Revenue Share (%), by Export Market Analysis (Value & Volume) 2025 & 2033
- Figure 10: North America Agriculture CRO Services Market Revenue (Million), by Price Trend Analysis 2025 & 2033
- Figure 11: North America Agriculture CRO Services Market Revenue Share (%), by Price Trend Analysis 2025 & 2033
- Figure 12: North America Agriculture CRO Services Market Revenue (Million), by Country 2025 & 2033
- Figure 13: North America Agriculture CRO Services Market Revenue Share (%), by Country 2025 & 2033
- Figure 14: South America Agriculture CRO Services Market Revenue (Million), by Production Analysis 2025 & 2033
- Figure 15: South America Agriculture CRO Services Market Revenue Share (%), by Production Analysis 2025 & 2033
- Figure 16: South America Agriculture CRO Services Market Revenue (Million), by Consumption Analysis 2025 & 2033
- Figure 17: South America Agriculture CRO Services Market Revenue Share (%), by Consumption Analysis 2025 & 2033
- Figure 18: South America Agriculture CRO Services Market Revenue (Million), by Import Market Analysis (Value & Volume) 2025 & 2033
- Figure 19: South America Agriculture CRO Services Market Revenue Share (%), by Import Market Analysis (Value & Volume) 2025 & 2033
- Figure 20: South America Agriculture CRO Services Market Revenue (Million), by Export Market Analysis (Value & Volume) 2025 & 2033
- Figure 21: South America Agriculture CRO Services Market Revenue Share (%), by Export Market Analysis (Value & Volume) 2025 & 2033
- Figure 22: South America Agriculture CRO Services Market Revenue (Million), by Price Trend Analysis 2025 & 2033
- Figure 23: South America Agriculture CRO Services Market Revenue Share (%), by Price Trend Analysis 2025 & 2033
- Figure 24: South America Agriculture CRO Services Market Revenue (Million), by Country 2025 & 2033
- Figure 25: South America Agriculture CRO Services Market Revenue Share (%), by Country 2025 & 2033
- Figure 26: Europe Agriculture CRO Services Market Revenue (Million), by Production Analysis 2025 & 2033
- Figure 27: Europe Agriculture CRO Services Market Revenue Share (%), by Production Analysis 2025 & 2033
- Figure 28: Europe Agriculture CRO Services Market Revenue (Million), by Consumption Analysis 2025 & 2033
- Figure 29: Europe Agriculture CRO Services Market Revenue Share (%), by Consumption Analysis 2025 & 2033
- Figure 30: Europe Agriculture CRO Services Market Revenue (Million), by Import Market Analysis (Value & Volume) 2025 & 2033
- Figure 31: Europe Agriculture CRO Services Market Revenue Share (%), by Import Market Analysis (Value & Volume) 2025 & 2033
- Figure 32: Europe Agriculture CRO Services Market Revenue (Million), by Export Market Analysis (Value & Volume) 2025 & 2033
- Figure 33: Europe Agriculture CRO Services Market Revenue Share (%), by Export Market Analysis (Value & Volume) 2025 & 2033
- Figure 34: Europe Agriculture CRO Services Market Revenue (Million), by Price Trend Analysis 2025 & 2033
- Figure 35: Europe Agriculture CRO Services Market Revenue Share (%), by Price Trend Analysis 2025 & 2033
- Figure 36: Europe Agriculture CRO Services Market Revenue (Million), by Country 2025 & 2033
- Figure 37: Europe Agriculture CRO Services Market Revenue Share (%), by Country 2025 & 2033
- Figure 38: Middle East & Africa Agriculture CRO Services Market Revenue (Million), by Production Analysis 2025 & 2033
- Figure 39: Middle East & Africa Agriculture CRO Services Market Revenue Share (%), by Production Analysis 2025 & 2033
- Figure 40: Middle East & Africa Agriculture CRO Services Market Revenue (Million), by Consumption Analysis 2025 & 2033
- Figure 41: Middle East & Africa Agriculture CRO Services Market Revenue Share (%), by Consumption Analysis 2025 & 2033
- Figure 42: Middle East & Africa Agriculture CRO Services Market Revenue (Million), by Import Market Analysis (Value & Volume) 2025 & 2033
- Figure 43: Middle East & Africa Agriculture CRO Services Market Revenue Share (%), by Import Market Analysis (Value & Volume) 2025 & 2033
- Figure 44: Middle East & Africa Agriculture CRO Services Market Revenue (Million), by Export Market Analysis (Value & Volume) 2025 & 2033
- Figure 45: Middle East & Africa Agriculture CRO Services Market Revenue Share (%), by Export Market Analysis (Value & Volume) 2025 & 2033
- Figure 46: Middle East & Africa Agriculture CRO Services Market Revenue (Million), by Price Trend Analysis 2025 & 2033
- Figure 47: Middle East & Africa Agriculture CRO Services Market Revenue Share (%), by Price Trend Analysis 2025 & 2033
- Figure 48: Middle East & Africa Agriculture CRO Services Market Revenue (Million), by Country 2025 & 2033
- Figure 49: Middle East & Africa Agriculture CRO Services Market Revenue Share (%), by Country 2025 & 2033
- Figure 50: Asia Pacific Agriculture CRO Services Market Revenue (Million), by Production Analysis 2025 & 2033
- Figure 51: Asia Pacific Agriculture CRO Services Market Revenue Share (%), by Production Analysis 2025 & 2033
- Figure 52: Asia Pacific Agriculture CRO Services Market Revenue (Million), by Consumption Analysis 2025 & 2033
- Figure 53: Asia Pacific Agriculture CRO Services Market Revenue Share (%), by Consumption Analysis 2025 & 2033
- Figure 54: Asia Pacific Agriculture CRO Services Market Revenue (Million), by Import Market Analysis (Value & Volume) 2025 & 2033
- Figure 55: Asia Pacific Agriculture CRO Services Market Revenue Share (%), by Import Market Analysis (Value & Volume) 2025 & 2033
- Figure 56: Asia Pacific Agriculture CRO Services Market Revenue (Million), by Export Market Analysis (Value & Volume) 2025 & 2033
- Figure 57: Asia Pacific Agriculture CRO Services Market Revenue Share (%), by Export Market Analysis (Value & Volume) 2025 & 2033
- Figure 58: Asia Pacific Agriculture CRO Services Market Revenue (Million), by Price Trend Analysis 2025 & 2033
- Figure 59: Asia Pacific Agriculture CRO Services Market Revenue Share (%), by Price Trend Analysis 2025 & 2033
- Figure 60: Asia Pacific Agriculture CRO Services Market Revenue (Million), by Country 2025 & 2033
- Figure 61: Asia Pacific Agriculture CRO Services Market Revenue Share (%), by Country 2025 & 2033
List of Tables
- Table 1: Global Agriculture CRO Services Market Revenue Million Forecast, by Production Analysis 2020 & 2033
- Table 2: Global Agriculture CRO Services Market Revenue Million Forecast, by Consumption Analysis 2020 & 2033
- Table 3: Global Agriculture CRO Services Market Revenue Million Forecast, by Import Market Analysis (Value & Volume) 2020 & 2033
- Table 4: Global Agriculture CRO Services Market Revenue Million Forecast, by Export Market Analysis (Value & Volume) 2020 & 2033
- Table 5: Global Agriculture CRO Services Market Revenue Million Forecast, by Price Trend Analysis 2020 & 2033
- Table 6: Global Agriculture CRO Services Market Revenue Million Forecast, by Region 2020 & 2033
- Table 7: Global Agriculture CRO Services Market Revenue Million Forecast, by Production Analysis 2020 & 2033
- Table 8: Global Agriculture CRO Services Market Revenue Million Forecast, by Consumption Analysis 2020 & 2033
- Table 9: Global Agriculture CRO Services Market Revenue Million Forecast, by Import Market Analysis (Value & Volume) 2020 & 2033
- Table 10: Global Agriculture CRO Services Market Revenue Million Forecast, by Export Market Analysis (Value & Volume) 2020 & 2033
- Table 11: Global Agriculture CRO Services Market Revenue Million Forecast, by Price Trend Analysis 2020 & 2033
- Table 12: Global Agriculture CRO Services Market Revenue Million Forecast, by Country 2020 & 2033
- Table 13: United States Agriculture CRO Services Market Revenue (Million) Forecast, by Application 2020 & 2033
- Table 14: Canada Agriculture CRO Services Market Revenue (Million) Forecast, by Application 2020 & 2033
- Table 15: Mexico Agriculture CRO Services Market Revenue (Million) Forecast, by Application 2020 & 2033
- Table 16: Global Agriculture CRO Services Market Revenue Million Forecast, by Production Analysis 2020 & 2033
- Table 17: Global Agriculture CRO Services Market Revenue Million Forecast, by Consumption Analysis 2020 & 2033
- Table 18: Global Agriculture CRO Services Market Revenue Million Forecast, by Import Market Analysis (Value & Volume) 2020 & 2033
- Table 19: Global Agriculture CRO Services Market Revenue Million Forecast, by Export Market Analysis (Value & Volume) 2020 & 2033
- Table 20: Global Agriculture CRO Services Market Revenue Million Forecast, by Price Trend Analysis 2020 & 2033
- Table 21: Global Agriculture CRO Services Market Revenue Million Forecast, by Country 2020 & 2033
- Table 22: Brazil Agriculture CRO Services Market Revenue (Million) Forecast, by Application 2020 & 2033
- Table 23: Argentina Agriculture CRO Services Market Revenue (Million) Forecast, by Application 2020 & 2033
- Table 24: Rest of South America Agriculture CRO Services Market Revenue (Million) Forecast, by Application 2020 & 2033
- Table 25: Global Agriculture CRO Services Market Revenue Million Forecast, by Production Analysis 2020 & 2033
- Table 26: Global Agriculture CRO Services Market Revenue Million Forecast, by Consumption Analysis 2020 & 2033
- Table 27: Global Agriculture CRO Services Market Revenue Million Forecast, by Import Market Analysis (Value & Volume) 2020 & 2033
- Table 28: Global Agriculture CRO Services Market Revenue Million Forecast, by Export Market Analysis (Value & Volume) 2020 & 2033
- Table 29: Global Agriculture CRO Services Market Revenue Million Forecast, by Price Trend Analysis 2020 & 2033
- Table 30: Global Agriculture CRO Services Market Revenue Million Forecast, by Country 2020 & 2033
- Table 31: United Kingdom Agriculture CRO Services Market Revenue (Million) Forecast, by Application 2020 & 2033
- Table 32: Germany Agriculture CRO Services Market Revenue (Million) Forecast, by Application 2020 & 2033
- Table 33: France Agriculture CRO Services Market Revenue (Million) Forecast, by Application 2020 & 2033
- Table 34: Italy Agriculture CRO Services Market Revenue (Million) Forecast, by Application 2020 & 2033
- Table 35: Spain Agriculture CRO Services Market Revenue (Million) Forecast, by Application 2020 & 2033
- Table 36: Russia Agriculture CRO Services Market Revenue (Million) Forecast, by Application 2020 & 2033
- Table 37: Benelux Agriculture CRO Services Market Revenue (Million) Forecast, by Application 2020 & 2033
- Table 38: Nordics Agriculture CRO Services Market Revenue (Million) Forecast, by Application 2020 & 2033
- Table 39: Rest of Europe Agriculture CRO Services Market Revenue (Million) Forecast, by Application 2020 & 2033
- Table 40: Global Agriculture CRO Services Market Revenue Million Forecast, by Production Analysis 2020 & 2033
- Table 41: Global Agriculture CRO Services Market Revenue Million Forecast, by Consumption Analysis 2020 & 2033
- Table 42: Global Agriculture CRO Services Market Revenue Million Forecast, by Import Market Analysis (Value & Volume) 2020 & 2033
- Table 43: Global Agriculture CRO Services Market Revenue Million Forecast, by Export Market Analysis (Value & Volume) 2020 & 2033
- Table 44: Global Agriculture CRO Services Market Revenue Million Forecast, by Price Trend Analysis 2020 & 2033
- Table 45: Global Agriculture CRO Services Market Revenue Million Forecast, by Country 2020 & 2033
- Table 46: Turkey Agriculture CRO Services Market Revenue (Million) Forecast, by Application 2020 & 2033
- Table 47: Israel Agriculture CRO Services Market Revenue (Million) Forecast, by Application 2020 & 2033
- Table 48: GCC Agriculture CRO Services Market Revenue (Million) Forecast, by Application 2020 & 2033
- Table 49: North Africa Agriculture CRO Services Market Revenue (Million) Forecast, by Application 2020 & 2033
- Table 50: South Africa Agriculture CRO Services Market Revenue (Million) Forecast, by Application 2020 & 2033
- Table 51: Rest of Middle East & Africa Agriculture CRO Services Market Revenue (Million) Forecast, by Application 2020 & 2033
- Table 52: Global Agriculture CRO Services Market Revenue Million Forecast, by Production Analysis 2020 & 2033
- Table 53: Global Agriculture CRO Services Market Revenue Million Forecast, by Consumption Analysis 2020 & 2033
- Table 54: Global Agriculture CRO Services Market Revenue Million Forecast, by Import Market Analysis (Value & Volume) 2020 & 2033
- Table 55: Global Agriculture CRO Services Market Revenue Million Forecast, by Export Market Analysis (Value & Volume) 2020 & 2033
- Table 56: Global Agriculture CRO Services Market Revenue Million Forecast, by Price Trend Analysis 2020 & 2033
- Table 57: Global Agriculture CRO Services Market Revenue Million Forecast, by Country 2020 & 2033
- Table 58: China Agriculture CRO Services Market Revenue (Million) Forecast, by Application 2020 & 2033
- Table 59: India Agriculture CRO Services Market Revenue (Million) Forecast, by Application 2020 & 2033
- Table 60: Japan Agriculture CRO Services Market Revenue (Million) Forecast, by Application 2020 & 2033
- Table 61: South Korea Agriculture CRO Services Market Revenue (Million) Forecast, by Application 2020 & 2033
- Table 62: ASEAN Agriculture CRO Services Market Revenue (Million) Forecast, by Application 2020 & 2033
- Table 63: Oceania Agriculture CRO Services Market Revenue (Million) Forecast, by Application 2020 & 2033
- Table 64: Rest of Asia Pacific Agriculture CRO Services Market Revenue (Million) Forecast, by Application 2020 & 2033
Frequently Asked Questions
1. What is the projected Compound Annual Growth Rate (CAGR) of the Agriculture CRO Services Market ?
The projected CAGR is approximately 11.50%.
2. Which companies are prominent players in the Agriculture CRO Services Market ?
Key companies in the market include Charles River Laboratories, Exponent Inc, Anadiag Group, Knoell, The Erm International Group Limited, Technology Sciences Group Consulting Limited, Eurofins Scientific, Ies Limited (i2l Research Limited), Ibacon Gmbh*List Not Exhaustive, Syntech Research Group.
3. What are the main segments of the Agriculture CRO Services Market ?
The market segments include Production Analysis, Consumption Analysis, Import Market Analysis (Value & Volume), Export Market Analysis (Value & Volume), Price Trend Analysis.
4. Can you provide details about the market size?
The market size is estimated to be USD 10.89 Million as of 2022.
5. What are some drivers contributing to market growth?
Need for Custom Product Development; Use of CROs for Regulatory Services.
6. What are the notable trends driving market growth?
Fertilizer is the Biggest Sector for CRO Services.
7. Are there any restraints impacting market growth?
Data and Cyber Security Concerns; Lack of Experts and Professionals in this Industry.
8. Can you provide examples of recent developments in the market?
December 2023: Eurofins signed an agreement to acquire the operations of SGS Crop Science in 14 countries. The acquisition further reinforced service offerings in agriscience contract research services and agro testing and its commitment to providing its clients with the best scientific and regulatory support standards.
9. What pricing options are available for accessing the report?
Pricing options include single-user, multi-user, and enterprise licenses priced at USD 4750, USD 5250, and USD 8750 respectively.
10. Is the market size provided in terms of value or volume?
The market size is provided in terms of value, measured in Million.
11. Are there any specific market keywords associated with the report?
Yes, the market keyword associated with the report is "Agriculture CRO Services Market ," which aids in identifying and referencing the specific market segment covered.
12. How do I determine which pricing option suits my needs best?
The pricing options vary based on user requirements and access needs. Individual users may opt for single-user licenses, while businesses requiring broader access may choose multi-user or enterprise licenses for cost-effective access to the report.
13. Are there any additional resources or data provided in the Agriculture CRO Services Market report?
While the report offers comprehensive insights, it's advisable to review the specific contents or supplementary materials provided to ascertain if additional resources or data are available.
14. How can I stay updated on further developments or reports in the Agriculture CRO Services Market ?
To stay informed about further developments, trends, and reports in the Agriculture CRO Services Market , consider subscribing to industry newsletters, following relevant companies and organizations, or regularly checking reputable industry news sources and publications.
Methodology
Step 1 - Identification of Relevant Samples Size from Population Database


Step 2 - Approaches for Defining Global Market Size (Value, Volume* & Price*)

Note*: In applicable scenarios
Step 3 - Data Sources
Primary Research
- Web Analytics
- Survey Reports
- Research Institute
- Latest Research Reports
- Opinion Leaders
Secondary Research
- Annual Reports
- White Paper
- Latest Press Release
- Industry Association
- Paid Database
- Investor Presentations

Step 4 - Data Triangulation
Involves using different sources of information in order to increase the validity of a study
These sources are likely to be stakeholders in a program - participants, other researchers, program staff, other community members, and so on.
Then we put all data in single framework & apply various statistical tools to find out the dynamic on the market.
During the analysis stage, feedback from the stakeholder groups would be compared to determine areas of agreement as well as areas of divergence