

Key Insights
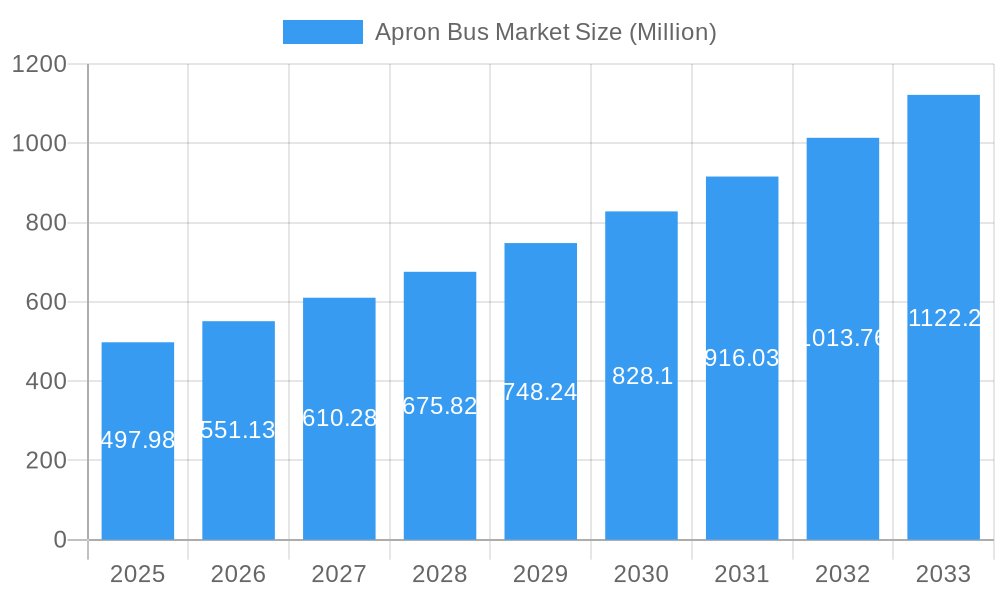
The global apron bus market, valued at $497.98 million in 2025, is projected to experience robust growth, driven by the increasing passenger traffic at airports worldwide and the rising demand for efficient passenger transportation solutions. The market's Compound Annual Growth Rate (CAGR) of 10.77% from 2019 to 2024 indicates a significant upward trajectory. This growth is fueled by several key factors. Firstly, the continuous expansion of airport infrastructure globally necessitates efficient and reliable ground transportation systems, making apron buses an essential component. Secondly, a growing preference for electric and hybrid apron buses is contributing to market expansion, driven by environmental concerns and government regulations promoting sustainable transportation. Major players like BYD Company Ltd, Proterra Inc., and Ashok Leyland are at the forefront of technological advancements, introducing innovative and eco-friendly models. Furthermore, the increasing focus on improving passenger experience through enhanced comfort and safety features in apron buses is a significant driver.
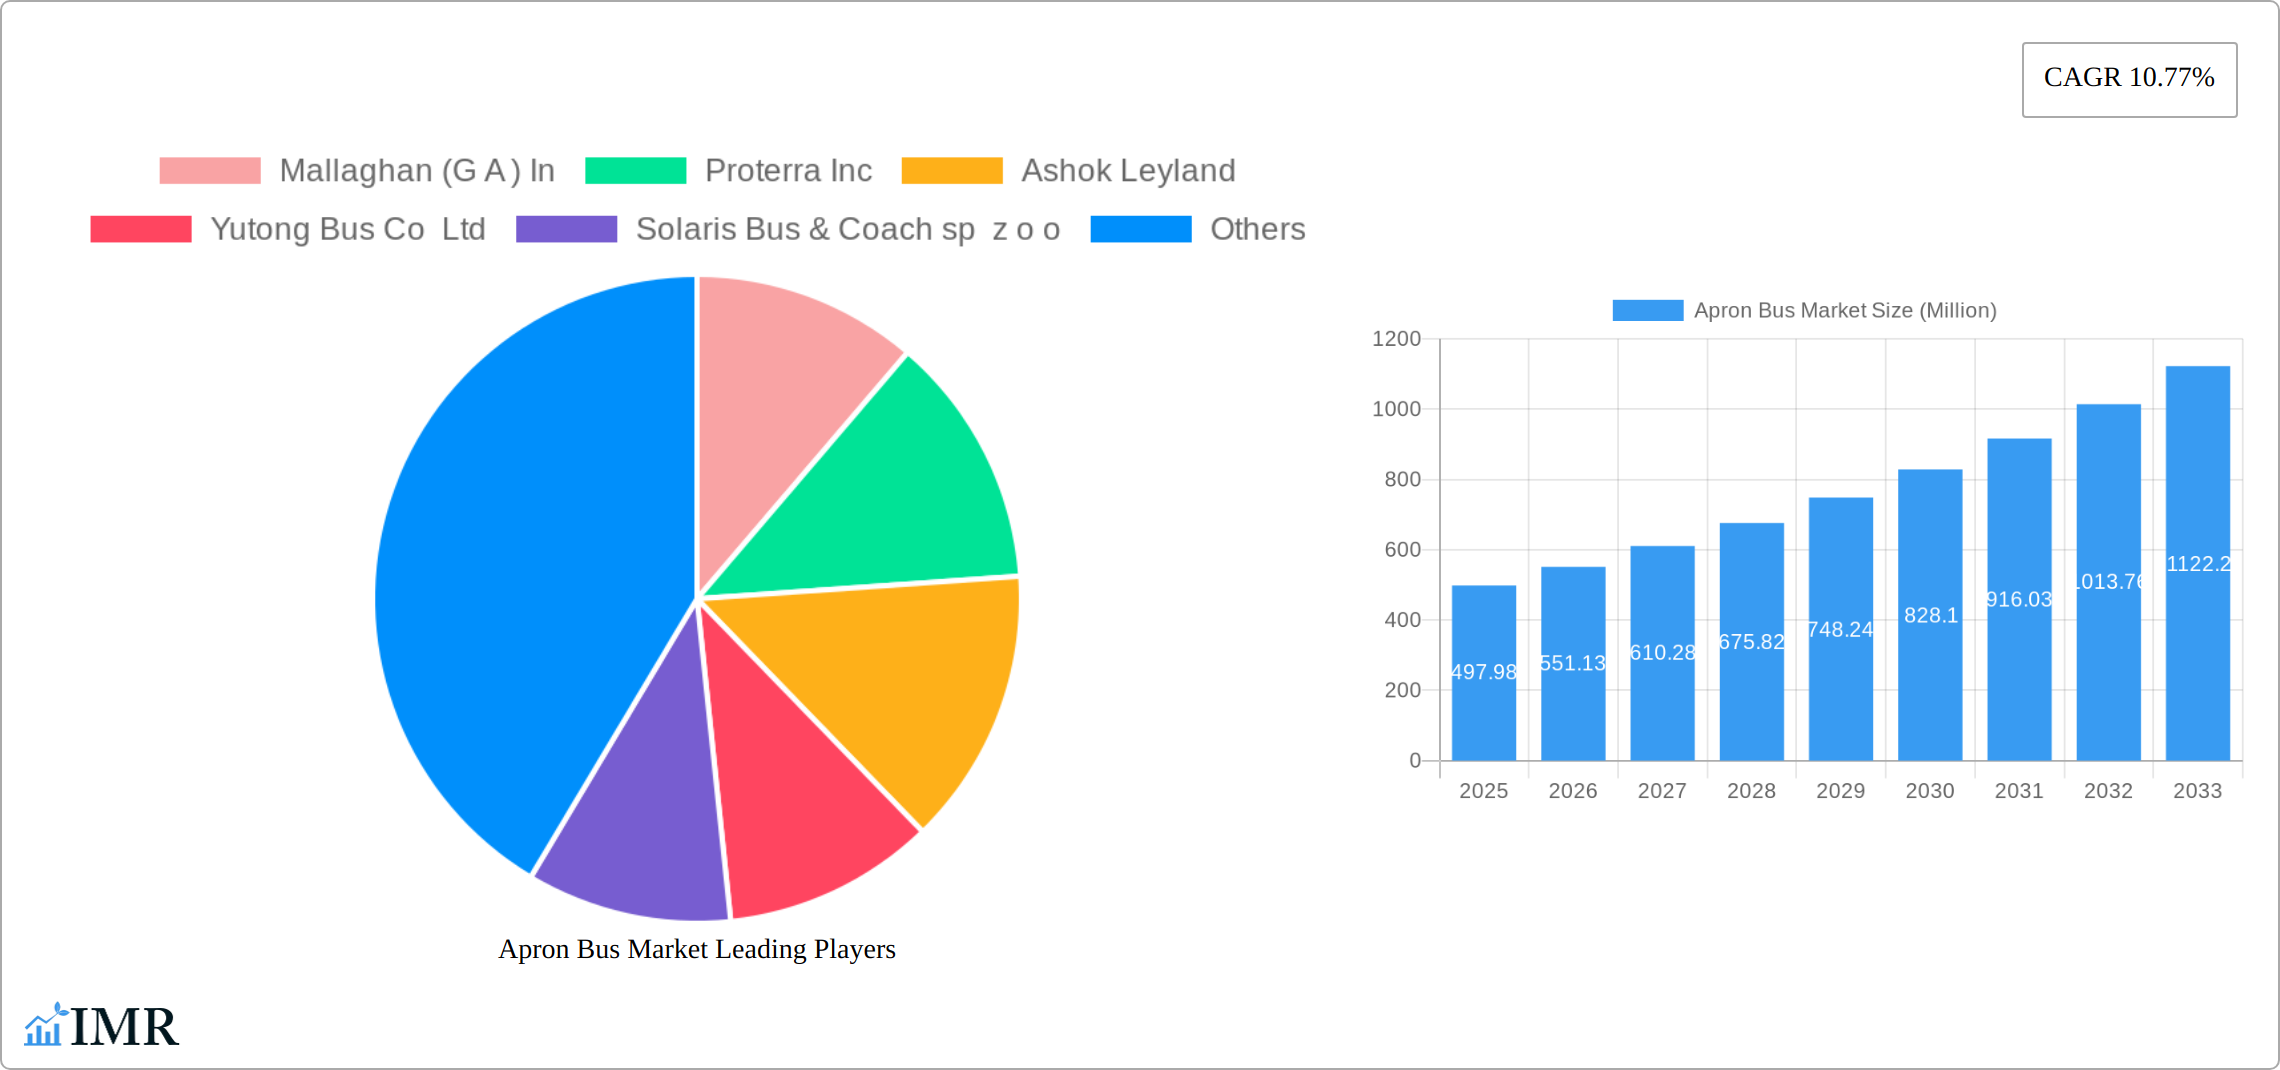
Apron Bus Market Market Size (In Million)
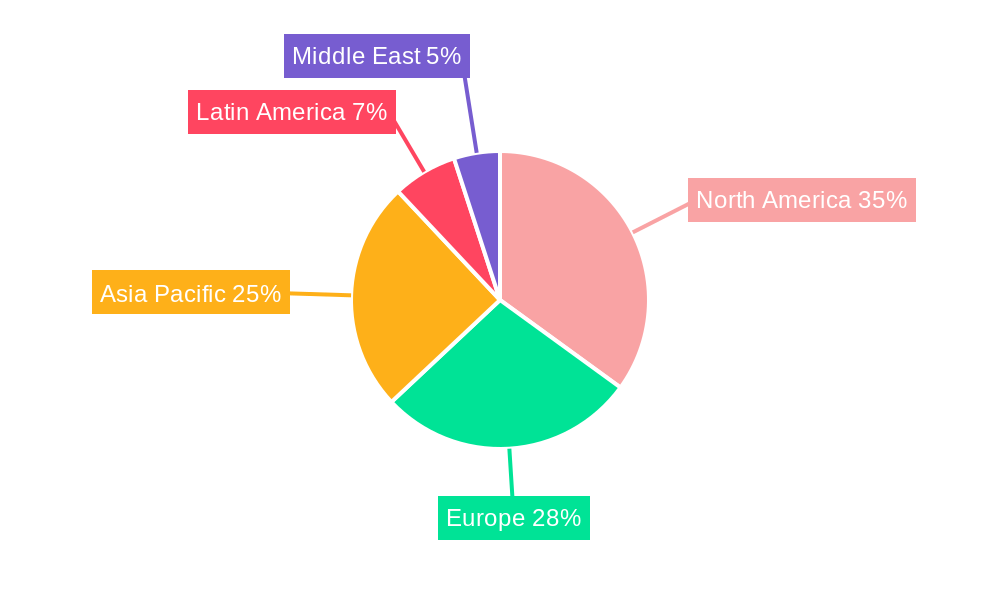
However, certain market restraints also exist. High initial investment costs associated with purchasing and maintaining apron buses, especially the advanced electric models, can pose a challenge for smaller airports. Fluctuations in fuel prices and raw material costs also influence the overall market dynamics. The market is segmented by type, primarily into electric and diesel-powered buses, with the electric segment witnessing faster growth due to its environmentally friendly nature and potential for long-term cost savings. Regionally, North America and Asia Pacific are expected to dominate the market, given the presence of major airport hubs and significant investments in infrastructure development within these regions. The forecast period of 2025-2033 presents a significant opportunity for market expansion as airport modernization projects continue and the demand for sustainable transportation solutions intensifies. Competition among existing players and the emergence of new entrants will likely intensify, shaping the market landscape in the coming years.
Apron Bus Market Company Market Share
Apron Bus Market: A Comprehensive Market Report (2019-2033)
This comprehensive report provides a detailed analysis of the Apron Bus Market, encompassing market dynamics, growth trends, regional insights, product landscape, key players, and future opportunities. The study period covers 2019-2033, with a base year of 2025 and a forecast period of 2025-2033. This report serves as an invaluable resource for industry professionals, investors, and stakeholders seeking to understand and capitalize on the evolving apron bus market landscape. The parent market is the Airport Ground Support Equipment (GSE) market, and the child market is specifically Apron Buses. The market size in 2025 is estimated at xx Million units.
Apron Bus Market Market Dynamics & Structure
The global apron bus market is characterized by moderate concentration, with key players holding significant market share. Technological innovation, driven by the increasing demand for electric and fuel-efficient vehicles, is a major driver of market growth. Stringent environmental regulations, particularly concerning emissions, are further shaping market dynamics. Competitive substitutes include traditional diesel buses and other ground transportation solutions. The end-user demographics comprise primarily airports of various sizes, with a growing focus on large international hubs. M&A activity in the sector has been relatively moderate in recent years, with approximately xx deals recorded between 2019 and 2024.
- Market Concentration: Moderately concentrated, with top 5 players holding approximately xx% market share in 2024.
- Technological Innovation: Emphasis on electric and hybrid technologies, autonomous driving capabilities, and improved passenger comfort features.
- Regulatory Framework: Stringent emission standards and safety regulations driving adoption of cleaner technologies.
- Competitive Substitutes: Traditional diesel buses, smaller shuttle buses, and other ground transportation options.
- End-User Demographics: Primarily airports, with a growing focus on larger, busier international airports.
- M&A Trends: Moderate M&A activity, with xx deals observed between 2019 and 2024, primarily focused on consolidation and technological integration.
Apron Bus Market Growth Trends & Insights
The global apron bus market is experiencing steady growth, driven by increasing air passenger traffic and a growing emphasis on efficient and sustainable ground transportation solutions within airports. The market is projected to grow at a Compound Annual Growth Rate (CAGR) of xx% during the forecast period (2025-2033), reaching xx Million units by 2033. This growth is fueled by technological advancements, such as the introduction of electric apron buses, improving operational efficiency and reducing environmental impact. Furthermore, rising environmental concerns and stricter emission regulations are accelerating the adoption of electric and hybrid models. Consumer behavior shifts towards environmentally friendly transportation options are further supporting market expansion. Market penetration of electric apron buses is expected to reach xx% by 2033.
Dominant Regions, Countries, or Segments in Apron Bus Market
North America and Europe are currently the dominant regions in the apron bus market, driven by high air passenger traffic, robust airport infrastructure, and stringent environmental regulations. Within these regions, countries like the US, UK, and Germany exhibit significant market share. The Electric segment is experiencing faster growth compared to the Diesel segment, primarily due to increasing environmental concerns and government incentives for electric vehicle adoption.
- Key Drivers in North America: High air passenger volume, strong infrastructure investments, and government support for sustainable transportation.
- Key Drivers in Europe: Stringent emission regulations, focus on sustainable transportation initiatives, and supportive government policies.
- Segment Dominance: The Electric segment is the fastest-growing, driven by environmental concerns and technological advancements. Market share for Electric buses is projected to reach xx% by 2033.
Apron Bus Market Product Landscape
The Apron Bus market is witnessing a rapid evolution, driven by the integration of cutting-edge technologies aimed at enhancing operational efficiency, passenger experience, and environmental sustainability. Electric powertrains are at the forefront, offering significant advantages in terms of zero tailpipe emissions, reduced noise pollution, and lower running costs compared to traditional diesel engines. Beyond electrification, manufacturers are focusing on advanced passenger safety features, including enhanced emergency exits, robust fire suppression systems, and sophisticated driver assistance technologies. Passenger comfort is also a key consideration, with improvements in seating ergonomics, climate control systems, and on-board infotainment and connectivity options. Key performance metrics that define product competitiveness include passenger capacity, operational range, rapid charging capabilities, and overall fleet management efficiency. Unique selling propositions frequently revolve around a holistic approach to sustainability, a demonstrably superior passenger journey, and a compelling reduction in total cost of ownership for airport operators.
Key Drivers, Barriers & Challenges in Apron Bus Market
Key Drivers:
- Surge in Global Air Passenger Traffic: The continuous growth in air travel directly translates to an increased demand for efficient and reliable airport ground transportation solutions like apron buses.
- Stringent Environmental Regulations: Increasingly rigorous emission standards and environmental protection mandates are pushing airports and airlines towards adopting cleaner technologies, favoring electric and hybrid apron buses.
- Growing Demand for Sustainable Ground Transport: A broader societal and industry-wide push towards sustainability is driving investment in eco-friendly solutions for all aspects of airport operations.
- Technological Advancements: Innovations in electric vehicle technology, battery storage, charging infrastructure, and the nascent development of autonomous driving capabilities are making apron buses more efficient, safer, and cost-effective.
Key Challenges:
- High Initial Capital Investment: The upfront cost of acquiring modern, technologically advanced apron buses, particularly electric variants, can be substantial, posing a barrier for some operators.
- Limited Charging Infrastructure: While improving, the availability and standardization of charging infrastructure at many airports can still be a bottleneck, especially for rapid charging solutions.
- Supply Chain Vulnerabilities: Global supply chain disruptions, particularly for critical components like batteries and semiconductors, can impact production timelines and component availability, leading to delays and increased costs.
- Intense Market Competition: The apron bus market is characterized by robust competition from established manufacturers and emerging players. This rivalry often leads to price pressures, potentially impacting the profit margins for some companies, necessitating a focus on innovation and differentiation.
Emerging Opportunities in Apron Bus Market
- Geographic Market Expansion: Tapping into rapidly developing emerging markets with burgeoning air travel sectors presents significant growth opportunities for apron bus manufacturers and service providers.
- Autonomous Driving Integration: The development and implementation of autonomous driving capabilities in apron buses promise to revolutionize operational efficiency, reduce labor costs, and enhance safety through consistent driving performance.
- Innovative Mobility Solutions: Exploring and implementing novel business models such as on-demand bus-sharing services, integrated ride-hailing solutions for airport transit, and flexible leasing arrangements can open new revenue streams.
- System Integration with Airport Operations: Opportunities exist in developing apron buses that can seamlessly integrate with other airport ground support equipment (GSE) systems, enabling better fleet management, predictive maintenance, and optimized operational workflows.
Growth Accelerators in the Apron Bus Market Industry
Technological breakthroughs in battery technology, autonomous driving systems, and improved charging infrastructure are key catalysts for long-term growth. Strategic partnerships between bus manufacturers, airport operators, and technology providers are accelerating market expansion. Governments' focus on sustainable transportation initiatives and incentives for electric vehicle adoption also contribute significantly to market growth.
Key Players Shaping the Apron Bus Market Market
Notable Milestones in Apron Bus Market Sector
- July 2023: Busnex launched the fully electric 'DinoBus' airport apron bus, showcasing the industry's shift towards decarbonization.
- August 2023: LSP Plus Corporation secured a five-year contract for parking and shuttle operations at Eppley Airport (OMA), highlighting the growing importance of efficient ground transportation.
In-Depth Apron Bus Market Market Outlook
The future of the apron bus market looks promising, driven by continuous technological advancements, increasing demand for sustainable transportation solutions, and supportive government policies. Strategic partnerships and investments in research and development will further accelerate market growth, creating significant opportunities for industry players. The market's potential lies in the adoption of advanced technologies, expansion into untapped markets, and the development of innovative business models. The focus on sustainability and operational efficiency will continue to shape the future of the apron bus market.
Apron Bus Market Segmentation
- 1. Production Analysis
- 2. Consumption Analysis
- 3. Import Market Analysis (Value & Volume)
- 4. Export Market Analysis (Value & Volume)
- 5. Price Trend Analysis
Apron Bus Market Segmentation By Geography
-
1. North America
- 1.1. United States
- 1.2. Canada
- 1.3. Mexico
-
2. South America
- 2.1. Brazil
- 2.2. Argentina
- 2.3. Rest of South America
-
3. Europe
- 3.1. United Kingdom
- 3.2. Germany
- 3.3. France
- 3.4. Italy
- 3.5. Spain
- 3.6. Russia
- 3.7. Benelux
- 3.8. Nordics
- 3.9. Rest of Europe
-
4. Middle East & Africa
- 4.1. Turkey
- 4.2. Israel
- 4.3. GCC
- 4.4. North Africa
- 4.5. South Africa
- 4.6. Rest of Middle East & Africa
-
5. Asia Pacific
- 5.1. China
- 5.2. India
- 5.3. Japan
- 5.4. South Korea
- 5.5. ASEAN
- 5.6. Oceania
- 5.7. Rest of Asia Pacific
Apron Bus Market Regional Market Share
Geographic Coverage of Apron Bus Market
Apron Bus Market REPORT HIGHLIGHTS
| Aspects | Details |
|---|---|
| Study Period | 2020-2034 |
| Base Year | 2025 |
| Estimated Year | 2026 |
| Forecast Period | 2026-2034 |
| Historical Period | 2020-2025 |
| Growth Rate | CAGR of 10.77% from 2020-2034 |
| Segmentation |
|
Table of Contents
- 1. Introduction
- 1.1. Research Scope
- 1.2. Market Segmentation
- 1.3. Research Objective
- 1.4. Definitions and Assumptions
- 2. Executive Summary
- 2.1. Market Snapshot
- 3. Market Dynamics
- 3.1. Market Drivers
- 3.2. Market Restrains
- 3.3. Market Trends
- 3.4. Market Opportunities
- 4. Market Factor Analysis
- 4.1. Porters Five Forces
- 4.1.1. Bargaining Power of Suppliers
- 4.1.2. Bargaining Power of Buyers
- 4.1.3. Threat of New Entrants
- 4.1.4. Threat of Substitutes
- 4.1.5. Competitive Rivalry
- 4.2. PESTEL analysis
- 4.3. BCG Analysis
- 4.3.1. Stars (High Growth, High Market Share)
- 4.3.2. Cash Cows (Low Growth, High Market Share)
- 4.3.3. Question Mark (High Growth, Low Market Share)
- 4.3.4. Dogs (Low Growth, Low Market Share)
- 4.4. Ansoff Matrix Analysis
- 4.5. Supply Chain Analysis
- 4.6. Regulatory Landscape
- 4.7. Current Market Potential and Opportunity Assessment (TAM–SAM–SOM Framework)
- 4.8. IMR Analyst Note
- 4.1. Porters Five Forces
- 5. Market Analysis, Insights and Forecast 2021-2033
- 5.1. Market Analysis, Insights and Forecast - by Production Analysis
- 5.2. Market Analysis, Insights and Forecast - by Consumption Analysis
- 5.3. Market Analysis, Insights and Forecast - by Import Market Analysis (Value & Volume)
- 5.4. Market Analysis, Insights and Forecast - by Export Market Analysis (Value & Volume)
- 5.5. Market Analysis, Insights and Forecast - by Price Trend Analysis
- 5.6. Market Analysis, Insights and Forecast - by Region
- 5.6.1. North America
- 5.6.2. South America
- 5.6.3. Europe
- 5.6.4. Middle East & Africa
- 5.6.5. Asia Pacific
- 6. Global Apron Bus Market Analysis, Insights and Forecast, 2021-2033
- 6.1. Market Analysis, Insights and Forecast - by Production Analysis
- 6.2. Market Analysis, Insights and Forecast - by Consumption Analysis
- 6.3. Market Analysis, Insights and Forecast - by Import Market Analysis (Value & Volume)
- 6.4. Market Analysis, Insights and Forecast - by Export Market Analysis (Value & Volume)
- 6.5. Market Analysis, Insights and Forecast - by Price Trend Analysis
- 7. North America Apron Bus Market Analysis, Insights and Forecast, 2020-2032
- 7.1. Market Analysis, Insights and Forecast - by Production Analysis
- 7.2. Market Analysis, Insights and Forecast - by Consumption Analysis
- 7.3. Market Analysis, Insights and Forecast - by Import Market Analysis (Value & Volume)
- 7.4. Market Analysis, Insights and Forecast - by Export Market Analysis (Value & Volume)
- 7.5. Market Analysis, Insights and Forecast - by Price Trend Analysis
- 8. South America Apron Bus Market Analysis, Insights and Forecast, 2020-2032
- 8.1. Market Analysis, Insights and Forecast - by Production Analysis
- 8.2. Market Analysis, Insights and Forecast - by Consumption Analysis
- 8.3. Market Analysis, Insights and Forecast - by Import Market Analysis (Value & Volume)
- 8.4. Market Analysis, Insights and Forecast - by Export Market Analysis (Value & Volume)
- 8.5. Market Analysis, Insights and Forecast - by Price Trend Analysis
- 9. Europe Apron Bus Market Analysis, Insights and Forecast, 2020-2032
- 9.1. Market Analysis, Insights and Forecast - by Production Analysis
- 9.2. Market Analysis, Insights and Forecast - by Consumption Analysis
- 9.3. Market Analysis, Insights and Forecast - by Import Market Analysis (Value & Volume)
- 9.4. Market Analysis, Insights and Forecast - by Export Market Analysis (Value & Volume)
- 9.5. Market Analysis, Insights and Forecast - by Price Trend Analysis
- 10. Middle East & Africa Apron Bus Market Analysis, Insights and Forecast, 2020-2032
- 10.1. Market Analysis, Insights and Forecast - by Production Analysis
- 10.2. Market Analysis, Insights and Forecast - by Consumption Analysis
- 10.3. Market Analysis, Insights and Forecast - by Import Market Analysis (Value & Volume)
- 10.4. Market Analysis, Insights and Forecast - by Export Market Analysis (Value & Volume)
- 10.5. Market Analysis, Insights and Forecast - by Price Trend Analysis
- 11. Asia Pacific Apron Bus Market Analysis, Insights and Forecast, 2020-2032
- 11.1. Market Analysis, Insights and Forecast - by Production Analysis
- 11.2. Market Analysis, Insights and Forecast - by Consumption Analysis
- 11.3. Market Analysis, Insights and Forecast - by Import Market Analysis (Value & Volume)
- 11.4. Market Analysis, Insights and Forecast - by Export Market Analysis (Value & Volume)
- 11.5. Market Analysis, Insights and Forecast - by Price Trend Analysis
- 12. Competitive Analysis
- 12.1. Company Profiles
- 12.1.1 Mallaghan (G A ) In
- 12.1.1.1. Company Overview
- 12.1.1.2. Products
- 12.1.1.3. Company Financials
- 12.1.1.4. SWOT Analysis
- 12.1.2 Proterra Inc
- 12.1.2.1. Company Overview
- 12.1.2.2. Products
- 12.1.2.3. Company Financials
- 12.1.2.4. SWOT Analysis
- 12.1.3 Ashok Leyland
- 12.1.3.1. Company Overview
- 12.1.3.2. Products
- 12.1.3.3. Company Financials
- 12.1.3.4. SWOT Analysis
- 12.1.4 Yutong Bus Co Ltd
- 12.1.4.1. Company Overview
- 12.1.4.2. Products
- 12.1.4.3. Company Financials
- 12.1.4.4. SWOT Analysis
- 12.1.5 Solaris Bus & Coach sp z o o
- 12.1.5.1. Company Overview
- 12.1.5.2. Products
- 12.1.5.3. Company Financials
- 12.1.5.4. SWOT Analysis
- 12.1.6 Xiamen King Long International Trading Co Ltd
- 12.1.6.1. Company Overview
- 12.1.6.2. Products
- 12.1.6.3. Company Financials
- 12.1.6.4. SWOT Analysis
- 12.1.7 TAM - EUROPE
- 12.1.7.1. Company Overview
- 12.1.7.2. Products
- 12.1.7.3. Company Financials
- 12.1.7.4. SWOT Analysis
- 12.1.8 AB Volvo (Volvo Group)
- 12.1.8.1. Company Overview
- 12.1.8.2. Products
- 12.1.8.3. Company Financials
- 12.1.8.4. SWOT Analysis
- 12.1.9 COBUS Industries GmbH
- 12.1.9.1. Company Overview
- 12.1.9.2. Products
- 12.1.9.3. Company Financials
- 12.1.9.4. SWOT Analysis
- 12.1.10 BYD Company Ltd
- 12.1.10.1. Company Overview
- 12.1.10.2. Products
- 12.1.10.3. Company Financials
- 12.1.10.4. SWOT Analysis
- 12.1.11 Xinfa Airport Equipment Ltd
- 12.1.11.1. Company Overview
- 12.1.11.2. Products
- 12.1.11.3. Company Financials
- 12.1.11.4. SWOT Analysis
- 12.1.1 Mallaghan (G A ) In
- 12.2. Market Entropy
- 12.2.1 Company's Key Areas Served
- 12.2.2 Recent Developments
- 12.3. Company Market Share Analysis 2025
- 12.3.1 Top 5 Companies Market Share Analysis
- 12.3.2 Top 3 Companies Market Share Analysis
- 12.4. List of Potential Customers
- 13. Research Methodology
List of Figures
- Figure 1: Global Apron Bus Market Revenue Breakdown (million, %) by Region 2025 & 2033
- Figure 2: North America Apron Bus Market Revenue (million), by Production Analysis 2025 & 2033
- Figure 3: North America Apron Bus Market Revenue Share (%), by Production Analysis 2025 & 2033
- Figure 4: North America Apron Bus Market Revenue (million), by Consumption Analysis 2025 & 2033
- Figure 5: North America Apron Bus Market Revenue Share (%), by Consumption Analysis 2025 & 2033
- Figure 6: North America Apron Bus Market Revenue (million), by Import Market Analysis (Value & Volume) 2025 & 2033
- Figure 7: North America Apron Bus Market Revenue Share (%), by Import Market Analysis (Value & Volume) 2025 & 2033
- Figure 8: North America Apron Bus Market Revenue (million), by Export Market Analysis (Value & Volume) 2025 & 2033
- Figure 9: North America Apron Bus Market Revenue Share (%), by Export Market Analysis (Value & Volume) 2025 & 2033
- Figure 10: North America Apron Bus Market Revenue (million), by Price Trend Analysis 2025 & 2033
- Figure 11: North America Apron Bus Market Revenue Share (%), by Price Trend Analysis 2025 & 2033
- Figure 12: North America Apron Bus Market Revenue (million), by Country 2025 & 2033
- Figure 13: North America Apron Bus Market Revenue Share (%), by Country 2025 & 2033
- Figure 14: South America Apron Bus Market Revenue (million), by Production Analysis 2025 & 2033
- Figure 15: South America Apron Bus Market Revenue Share (%), by Production Analysis 2025 & 2033
- Figure 16: South America Apron Bus Market Revenue (million), by Consumption Analysis 2025 & 2033
- Figure 17: South America Apron Bus Market Revenue Share (%), by Consumption Analysis 2025 & 2033
- Figure 18: South America Apron Bus Market Revenue (million), by Import Market Analysis (Value & Volume) 2025 & 2033
- Figure 19: South America Apron Bus Market Revenue Share (%), by Import Market Analysis (Value & Volume) 2025 & 2033
- Figure 20: South America Apron Bus Market Revenue (million), by Export Market Analysis (Value & Volume) 2025 & 2033
- Figure 21: South America Apron Bus Market Revenue Share (%), by Export Market Analysis (Value & Volume) 2025 & 2033
- Figure 22: South America Apron Bus Market Revenue (million), by Price Trend Analysis 2025 & 2033
- Figure 23: South America Apron Bus Market Revenue Share (%), by Price Trend Analysis 2025 & 2033
- Figure 24: South America Apron Bus Market Revenue (million), by Country 2025 & 2033
- Figure 25: South America Apron Bus Market Revenue Share (%), by Country 2025 & 2033
- Figure 26: Europe Apron Bus Market Revenue (million), by Production Analysis 2025 & 2033
- Figure 27: Europe Apron Bus Market Revenue Share (%), by Production Analysis 2025 & 2033
- Figure 28: Europe Apron Bus Market Revenue (million), by Consumption Analysis 2025 & 2033
- Figure 29: Europe Apron Bus Market Revenue Share (%), by Consumption Analysis 2025 & 2033
- Figure 30: Europe Apron Bus Market Revenue (million), by Import Market Analysis (Value & Volume) 2025 & 2033
- Figure 31: Europe Apron Bus Market Revenue Share (%), by Import Market Analysis (Value & Volume) 2025 & 2033
- Figure 32: Europe Apron Bus Market Revenue (million), by Export Market Analysis (Value & Volume) 2025 & 2033
- Figure 33: Europe Apron Bus Market Revenue Share (%), by Export Market Analysis (Value & Volume) 2025 & 2033
- Figure 34: Europe Apron Bus Market Revenue (million), by Price Trend Analysis 2025 & 2033
- Figure 35: Europe Apron Bus Market Revenue Share (%), by Price Trend Analysis 2025 & 2033
- Figure 36: Europe Apron Bus Market Revenue (million), by Country 2025 & 2033
- Figure 37: Europe Apron Bus Market Revenue Share (%), by Country 2025 & 2033
- Figure 38: Middle East & Africa Apron Bus Market Revenue (million), by Production Analysis 2025 & 2033
- Figure 39: Middle East & Africa Apron Bus Market Revenue Share (%), by Production Analysis 2025 & 2033
- Figure 40: Middle East & Africa Apron Bus Market Revenue (million), by Consumption Analysis 2025 & 2033
- Figure 41: Middle East & Africa Apron Bus Market Revenue Share (%), by Consumption Analysis 2025 & 2033
- Figure 42: Middle East & Africa Apron Bus Market Revenue (million), by Import Market Analysis (Value & Volume) 2025 & 2033
- Figure 43: Middle East & Africa Apron Bus Market Revenue Share (%), by Import Market Analysis (Value & Volume) 2025 & 2033
- Figure 44: Middle East & Africa Apron Bus Market Revenue (million), by Export Market Analysis (Value & Volume) 2025 & 2033
- Figure 45: Middle East & Africa Apron Bus Market Revenue Share (%), by Export Market Analysis (Value & Volume) 2025 & 2033
- Figure 46: Middle East & Africa Apron Bus Market Revenue (million), by Price Trend Analysis 2025 & 2033
- Figure 47: Middle East & Africa Apron Bus Market Revenue Share (%), by Price Trend Analysis 2025 & 2033
- Figure 48: Middle East & Africa Apron Bus Market Revenue (million), by Country 2025 & 2033
- Figure 49: Middle East & Africa Apron Bus Market Revenue Share (%), by Country 2025 & 2033
- Figure 50: Asia Pacific Apron Bus Market Revenue (million), by Production Analysis 2025 & 2033
- Figure 51: Asia Pacific Apron Bus Market Revenue Share (%), by Production Analysis 2025 & 2033
- Figure 52: Asia Pacific Apron Bus Market Revenue (million), by Consumption Analysis 2025 & 2033
- Figure 53: Asia Pacific Apron Bus Market Revenue Share (%), by Consumption Analysis 2025 & 2033
- Figure 54: Asia Pacific Apron Bus Market Revenue (million), by Import Market Analysis (Value & Volume) 2025 & 2033
- Figure 55: Asia Pacific Apron Bus Market Revenue Share (%), by Import Market Analysis (Value & Volume) 2025 & 2033
- Figure 56: Asia Pacific Apron Bus Market Revenue (million), by Export Market Analysis (Value & Volume) 2025 & 2033
- Figure 57: Asia Pacific Apron Bus Market Revenue Share (%), by Export Market Analysis (Value & Volume) 2025 & 2033
- Figure 58: Asia Pacific Apron Bus Market Revenue (million), by Price Trend Analysis 2025 & 2033
- Figure 59: Asia Pacific Apron Bus Market Revenue Share (%), by Price Trend Analysis 2025 & 2033
- Figure 60: Asia Pacific Apron Bus Market Revenue (million), by Country 2025 & 2033
- Figure 61: Asia Pacific Apron Bus Market Revenue Share (%), by Country 2025 & 2033
List of Tables
- Table 1: Global Apron Bus Market Revenue million Forecast, by Production Analysis 2020 & 2033
- Table 2: Global Apron Bus Market Revenue million Forecast, by Consumption Analysis 2020 & 2033
- Table 3: Global Apron Bus Market Revenue million Forecast, by Import Market Analysis (Value & Volume) 2020 & 2033
- Table 4: Global Apron Bus Market Revenue million Forecast, by Export Market Analysis (Value & Volume) 2020 & 2033
- Table 5: Global Apron Bus Market Revenue million Forecast, by Price Trend Analysis 2020 & 2033
- Table 6: Global Apron Bus Market Revenue million Forecast, by Region 2020 & 2033
- Table 7: Global Apron Bus Market Revenue million Forecast, by Production Analysis 2020 & 2033
- Table 8: Global Apron Bus Market Revenue million Forecast, by Consumption Analysis 2020 & 2033
- Table 9: Global Apron Bus Market Revenue million Forecast, by Import Market Analysis (Value & Volume) 2020 & 2033
- Table 10: Global Apron Bus Market Revenue million Forecast, by Export Market Analysis (Value & Volume) 2020 & 2033
- Table 11: Global Apron Bus Market Revenue million Forecast, by Price Trend Analysis 2020 & 2033
- Table 12: Global Apron Bus Market Revenue million Forecast, by Country 2020 & 2033
- Table 13: United States Apron Bus Market Revenue (million) Forecast, by Application 2020 & 2033
- Table 14: Canada Apron Bus Market Revenue (million) Forecast, by Application 2020 & 2033
- Table 15: Mexico Apron Bus Market Revenue (million) Forecast, by Application 2020 & 2033
- Table 16: Global Apron Bus Market Revenue million Forecast, by Production Analysis 2020 & 2033
- Table 17: Global Apron Bus Market Revenue million Forecast, by Consumption Analysis 2020 & 2033
- Table 18: Global Apron Bus Market Revenue million Forecast, by Import Market Analysis (Value & Volume) 2020 & 2033
- Table 19: Global Apron Bus Market Revenue million Forecast, by Export Market Analysis (Value & Volume) 2020 & 2033
- Table 20: Global Apron Bus Market Revenue million Forecast, by Price Trend Analysis 2020 & 2033
- Table 21: Global Apron Bus Market Revenue million Forecast, by Country 2020 & 2033
- Table 22: Brazil Apron Bus Market Revenue (million) Forecast, by Application 2020 & 2033
- Table 23: Argentina Apron Bus Market Revenue (million) Forecast, by Application 2020 & 2033
- Table 24: Rest of South America Apron Bus Market Revenue (million) Forecast, by Application 2020 & 2033
- Table 25: Global Apron Bus Market Revenue million Forecast, by Production Analysis 2020 & 2033
- Table 26: Global Apron Bus Market Revenue million Forecast, by Consumption Analysis 2020 & 2033
- Table 27: Global Apron Bus Market Revenue million Forecast, by Import Market Analysis (Value & Volume) 2020 & 2033
- Table 28: Global Apron Bus Market Revenue million Forecast, by Export Market Analysis (Value & Volume) 2020 & 2033
- Table 29: Global Apron Bus Market Revenue million Forecast, by Price Trend Analysis 2020 & 2033
- Table 30: Global Apron Bus Market Revenue million Forecast, by Country 2020 & 2033
- Table 31: United Kingdom Apron Bus Market Revenue (million) Forecast, by Application 2020 & 2033
- Table 32: Germany Apron Bus Market Revenue (million) Forecast, by Application 2020 & 2033
- Table 33: France Apron Bus Market Revenue (million) Forecast, by Application 2020 & 2033
- Table 34: Italy Apron Bus Market Revenue (million) Forecast, by Application 2020 & 2033
- Table 35: Spain Apron Bus Market Revenue (million) Forecast, by Application 2020 & 2033
- Table 36: Russia Apron Bus Market Revenue (million) Forecast, by Application 2020 & 2033
- Table 37: Benelux Apron Bus Market Revenue (million) Forecast, by Application 2020 & 2033
- Table 38: Nordics Apron Bus Market Revenue (million) Forecast, by Application 2020 & 2033
- Table 39: Rest of Europe Apron Bus Market Revenue (million) Forecast, by Application 2020 & 2033
- Table 40: Global Apron Bus Market Revenue million Forecast, by Production Analysis 2020 & 2033
- Table 41: Global Apron Bus Market Revenue million Forecast, by Consumption Analysis 2020 & 2033
- Table 42: Global Apron Bus Market Revenue million Forecast, by Import Market Analysis (Value & Volume) 2020 & 2033
- Table 43: Global Apron Bus Market Revenue million Forecast, by Export Market Analysis (Value & Volume) 2020 & 2033
- Table 44: Global Apron Bus Market Revenue million Forecast, by Price Trend Analysis 2020 & 2033
- Table 45: Global Apron Bus Market Revenue million Forecast, by Country 2020 & 2033
- Table 46: Turkey Apron Bus Market Revenue (million) Forecast, by Application 2020 & 2033
- Table 47: Israel Apron Bus Market Revenue (million) Forecast, by Application 2020 & 2033
- Table 48: GCC Apron Bus Market Revenue (million) Forecast, by Application 2020 & 2033
- Table 49: North Africa Apron Bus Market Revenue (million) Forecast, by Application 2020 & 2033
- Table 50: South Africa Apron Bus Market Revenue (million) Forecast, by Application 2020 & 2033
- Table 51: Rest of Middle East & Africa Apron Bus Market Revenue (million) Forecast, by Application 2020 & 2033
- Table 52: Global Apron Bus Market Revenue million Forecast, by Production Analysis 2020 & 2033
- Table 53: Global Apron Bus Market Revenue million Forecast, by Consumption Analysis 2020 & 2033
- Table 54: Global Apron Bus Market Revenue million Forecast, by Import Market Analysis (Value & Volume) 2020 & 2033
- Table 55: Global Apron Bus Market Revenue million Forecast, by Export Market Analysis (Value & Volume) 2020 & 2033
- Table 56: Global Apron Bus Market Revenue million Forecast, by Price Trend Analysis 2020 & 2033
- Table 57: Global Apron Bus Market Revenue million Forecast, by Country 2020 & 2033
- Table 58: China Apron Bus Market Revenue (million) Forecast, by Application 2020 & 2033
- Table 59: India Apron Bus Market Revenue (million) Forecast, by Application 2020 & 2033
- Table 60: Japan Apron Bus Market Revenue (million) Forecast, by Application 2020 & 2033
- Table 61: South Korea Apron Bus Market Revenue (million) Forecast, by Application 2020 & 2033
- Table 62: ASEAN Apron Bus Market Revenue (million) Forecast, by Application 2020 & 2033
- Table 63: Oceania Apron Bus Market Revenue (million) Forecast, by Application 2020 & 2033
- Table 64: Rest of Asia Pacific Apron Bus Market Revenue (million) Forecast, by Application 2020 & 2033
Frequently Asked Questions
1. What is the projected Compound Annual Growth Rate (CAGR) of the Apron Bus Market?
The projected CAGR is approximately 10.77%.
2. Which companies are prominent players in the Apron Bus Market?
Key companies in the market include Mallaghan (G A ) In, Proterra Inc, Ashok Leyland, Yutong Bus Co Ltd, Solaris Bus & Coach sp z o o, Xiamen King Long International Trading Co Ltd, TAM - EUROPE, AB Volvo (Volvo Group), COBUS Industries GmbH, BYD Company Ltd, Xinfa Airport Equipment Ltd.
3. What are the main segments of the Apron Bus Market?
The market segments include Production Analysis, Consumption Analysis, Import Market Analysis (Value & Volume), Export Market Analysis (Value & Volume), Price Trend Analysis.
4. Can you provide details about the market size?
The market size is estimated to be USD 551.61 million as of 2022.
5. What are some drivers contributing to market growth?
Increase in Internet of Things (IoT) and Autonomous Systems; Rise in Demand for Military and Defense Satellite Communication Solutions.
6. What are the notable trends driving market growth?
Electric Segment is Expected to Show Significant Growth During the Forecast Period.
7. Are there any restraints impacting market growth?
Cybersecurity Threats to Satellite Communication; Interference in Transmission of Data.
8. Can you provide examples of recent developments in the market?
August 2023: LSP Plus Corporation Announced a Five-Year Parking and Shuttle Operations Contract for the management of all public and employee parking facilities and public and employee shuttle service at Eppley Airport (OMA), US.
9. What pricing options are available for accessing the report?
Pricing options include single-user, multi-user, and enterprise licenses priced at USD 4750, USD 5250, and USD 8750 respectively.
10. Is the market size provided in terms of value or volume?
The market size is provided in terms of value, measured in million.
11. Are there any specific market keywords associated with the report?
Yes, the market keyword associated with the report is "Apron Bus Market," which aids in identifying and referencing the specific market segment covered.
12. How do I determine which pricing option suits my needs best?
The pricing options vary based on user requirements and access needs. Individual users may opt for single-user licenses, while businesses requiring broader access may choose multi-user or enterprise licenses for cost-effective access to the report.
13. Are there any additional resources or data provided in the Apron Bus Market report?
While the report offers comprehensive insights, it's advisable to review the specific contents or supplementary materials provided to ascertain if additional resources or data are available.
14. How can I stay updated on further developments or reports in the Apron Bus Market?
To stay informed about further developments, trends, and reports in the Apron Bus Market, consider subscribing to industry newsletters, following relevant companies and organizations, or regularly checking reputable industry news sources and publications.
Methodology
Step 1 - Identification of Relevant Samples Size from Population Database


Step 2 - Approaches for Defining Global Market Size (Value, Volume* & Price*)

Note*: In applicable scenarios
Step 3 - Data Sources
Primary Research
- Web Analytics
- Survey Reports
- Research Institute
- Latest Research Reports
- Opinion Leaders
Secondary Research
- Annual Reports
- White Paper
- Latest Press Release
- Industry Association
- Paid Database
- Investor Presentations

Step 4 - Data Triangulation
Involves using different sources of information in order to increase the validity of a study
These sources are likely to be stakeholders in a program - participants, other researchers, program staff, other community members, and so on.
Then we put all data in single framework & apply various statistical tools to find out the dynamic on the market.
During the analysis stage, feedback from the stakeholder groups would be compared to determine areas of agreement as well as areas of divergence