

Key Insights
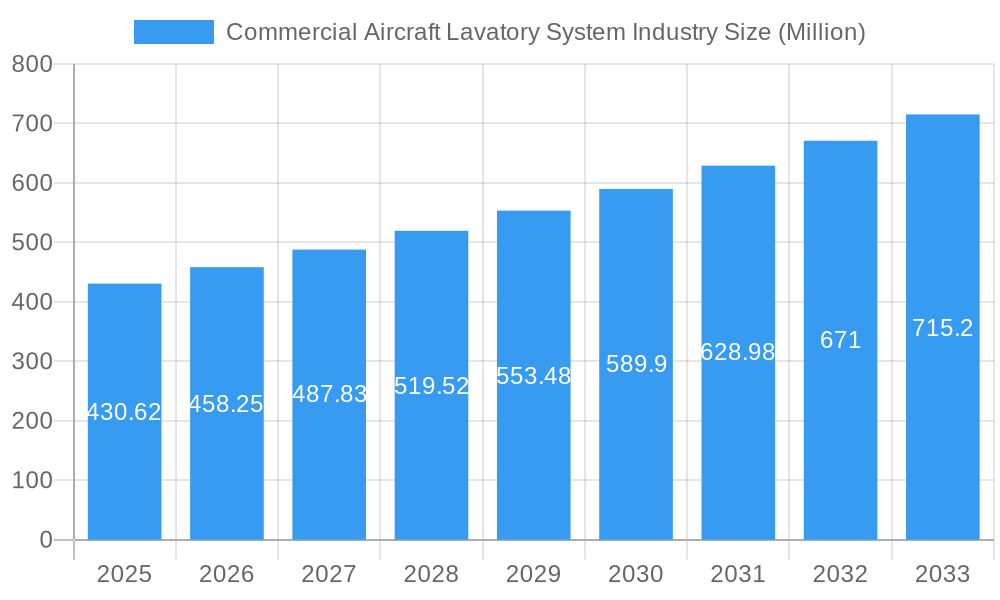
The commercial aircraft lavatory system market, valued at $430.62 million in 2025, is projected to experience robust growth, driven by the increasing demand for air travel and a corresponding rise in the number of commercial aircraft in operation. A Compound Annual Growth Rate (CAGR) of 6.22% from 2025 to 2033 indicates a significant expansion of this market over the forecast period. Key drivers include the ongoing replacement and retrofitting of older lavatory systems in existing aircraft fleets to meet evolving passenger comfort and hygiene standards. Furthermore, advancements in lavatory system technology, such as the integration of sustainable and lightweight materials, waste management solutions, and improved sanitation features, are contributing to market growth. The market is segmented by aircraft type (narrow-body, wide-body, and regional jets), with the narrow-body segment currently holding the largest market share due to the high volume of narrow-body aircraft in operation. The rising preference for improved amenities in all aircraft classes, including enhanced lavatory designs and functionality, further fuels market expansion. Growth is expected across all regions, particularly in Asia-Pacific, driven by burgeoning air travel in rapidly developing economies. However, potential restraints include fluctuations in fuel prices affecting airline budgets and economic downturns impacting air travel demand.
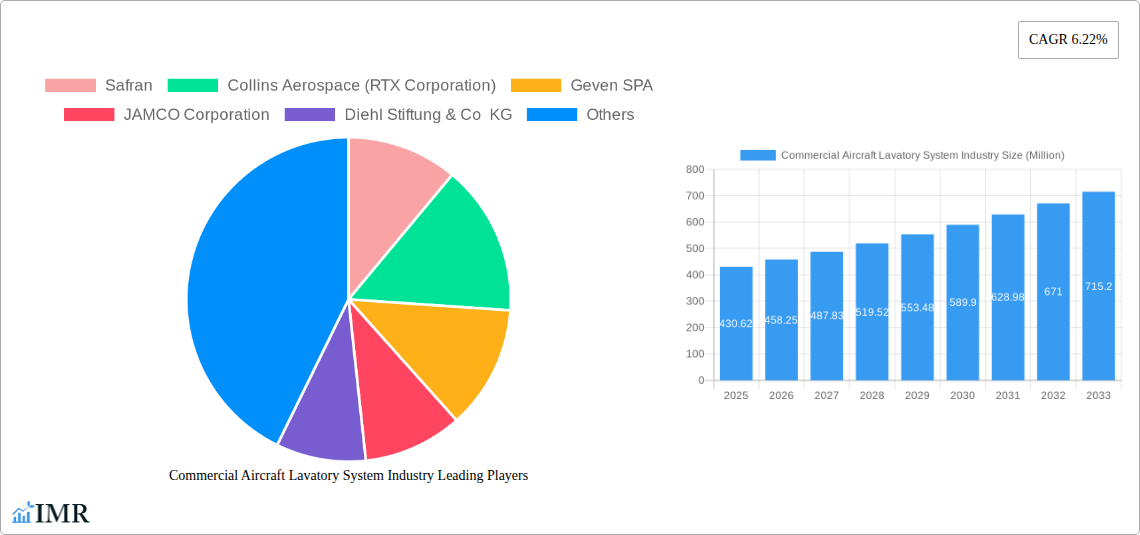
Commercial Aircraft Lavatory System Industry Market Size (In Million)
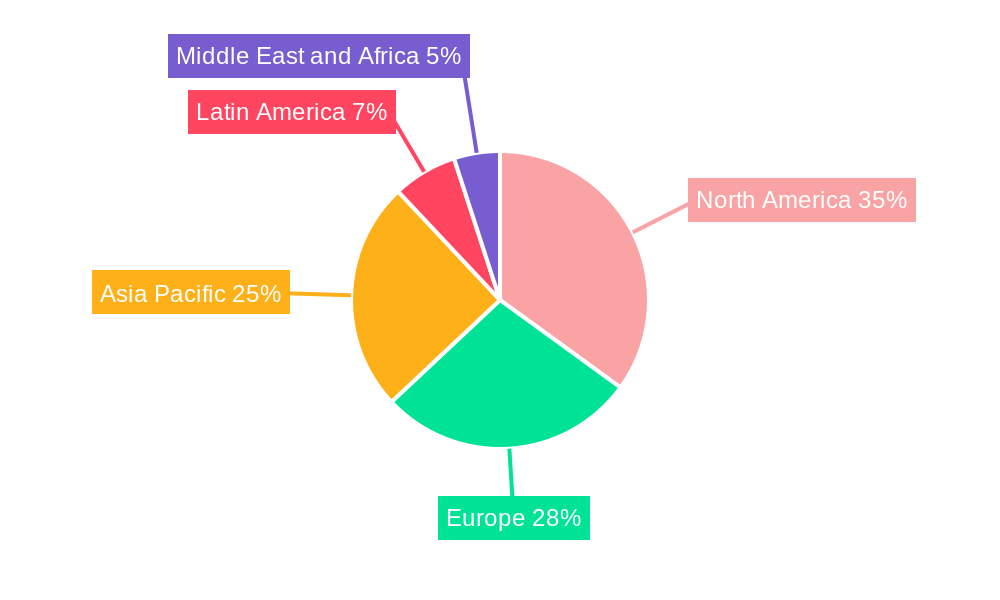
The competitive landscape is characterized by a mix of established players like Safran, Collins Aerospace, and Geven SPA, alongside regional manufacturers. These companies are investing heavily in research and development to enhance their product offerings and cater to the evolving needs of airlines. Strategic partnerships, mergers, and acquisitions are also expected to shape the market dynamics in the coming years. The regional distribution of the market will reflect existing and projected growth in air travel across different geographical regions, with North America and Europe maintaining significant market shares, while Asia-Pacific is anticipated to exhibit the highest growth rate during the forecast period, largely fueled by expansion in the airline industry across countries in that region. This signifies significant opportunities for manufacturers specializing in aircraft lavatory systems.
Commercial Aircraft Lavatory System Industry Company Market Share
Commercial Aircraft Lavatory System Industry Market Report: 2019-2033
This comprehensive report provides an in-depth analysis of the Commercial Aircraft Lavatory System industry, encompassing market dynamics, growth trends, regional performance, and key players. The study period spans 2019-2033, with 2025 serving as the base and estimated year. This report is invaluable for industry professionals, investors, and strategic decision-makers seeking to navigate this dynamic market.
Commercial Aircraft Lavatory System Industry Market Dynamics & Structure
The commercial aircraft lavatory system market is characterized by moderate concentration, with a few dominant players holding significant market share. Technological innovation, driven by increasing demand for lighter weight, more sustainable, and hygienic systems, is a key driver. Stringent regulatory frameworks concerning waste management and passenger safety heavily influence design and manufacturing. The market also faces competition from substitute materials and innovative designs. End-user demographics, particularly the growing preference for enhanced comfort and hygiene in air travel, significantly influence demand. Consolidation through mergers and acquisitions (M&A) is a notable trend, with xx M&A deals recorded between 2019 and 2024, resulting in a market share shift of approximately xx%.
- Market Concentration: Moderately concentrated, with top 5 players holding xx% market share in 2025.
- Technological Innovation: Focus on lightweight materials (e.g., composites), improved waste management systems, and enhanced hygiene features.
- Regulatory Landscape: Stringent safety and environmental regulations impacting design and materials selection.
- Competitive Substitutes: Emerging technologies and alternative materials presenting competitive pressures.
- M&A Activity: xx deals between 2019-2024, leading to market consolidation and shifts in market share.
- Innovation Barriers: High R&D costs, stringent certification processes, and limited access to advanced materials.
Commercial Aircraft Lavatory System Industry Growth Trends & Insights
The global commercial aircraft lavatory system market is projected to experience robust growth, reaching xx million units by 2033, exhibiting a CAGR of xx% during the forecast period (2025-2033). This growth is fueled by the escalating demand for air travel, particularly in emerging economies. The increasing fleet size of both narrow-body and wide-body aircraft significantly contributes to market expansion. Technological advancements, such as the incorporation of smart lavatory systems with improved monitoring capabilities and reduced maintenance requirements, are driving adoption rates. Consumer preferences for enhanced hygiene and comfort standards further stimulate market growth. Market penetration is anticipated to reach xx% by 2033.
Dominant Regions, Countries, or Segments in Commercial Aircraft Lavatory System Industry
North America and Europe currently dominate the commercial aircraft lavatory system market, driven by robust aircraft manufacturing activity and a large installed base of commercial aircraft. However, the Asia-Pacific region exhibits the highest growth potential, fueled by rapid expansion of low-cost carriers and increasing air travel demand. Within aircraft types, narrow-body aircraft segment constitutes the largest share, owing to its higher volume production compared to wide-body and regional jets.
- North America: Strong aircraft manufacturing base and high air travel demand.
- Europe: Significant aircraft manufacturing activity and established aviation infrastructure.
- Asia-Pacific: High growth potential due to rising air travel and expanding airline fleets.
- Aircraft Type: Narrow-body aircraft segment holds the largest market share (xx%) in 2025.
- Market Drivers: Government initiatives promoting air connectivity, rising disposable incomes, and expanding tourism.
Commercial Aircraft Lavatory System Industry Product Landscape
The commercial aircraft lavatory system market offers a range of products, from basic lavatory systems to advanced, integrated systems incorporating smart technologies. Key innovations include lightweight designs, improved waste management systems (e.g., vacuum toilet systems), and advanced hygiene features (e.g., antimicrobial surfaces). Unique selling propositions include reduced weight for improved fuel efficiency, enhanced hygiene to improve passenger experience, and improved system reliability and maintenance accessibility. Technological advancements focus on reducing system complexity, improving sustainability, and enhancing user experience.
Key Drivers, Barriers & Challenges in Commercial Aircraft Lavatory System Industry
Key Drivers:
- Increasing air travel demand globally.
- Growth in aircraft manufacturing and fleet renewal.
- Technological advancements leading to improved efficiency and hygiene.
- Stringent safety and environmental regulations.
Key Challenges:
- High initial investment costs for advanced systems.
- Stringent certification requirements and testing procedures.
- Supply chain disruptions impacting component availability and lead times.
- Intense competition among established players and new entrants. This results in a price war and reduced profit margins for many of the businesses within this field.
Emerging Opportunities in Commercial Aircraft Lavatory System Industry
- Growing demand for sustainable and eco-friendly lavatory systems.
- Integration of smart technologies for improved monitoring and maintenance.
- Expansion into emerging markets with high growth potential.
- Development of advanced hygiene features to enhance passenger comfort and reduce the spread of germs.
Growth Accelerators in the Commercial Aircraft Lavatory System Industry
Technological breakthroughs in materials science and sensor technology offer significant growth opportunities. Strategic partnerships between manufacturers and airlines can foster the adoption of innovative lavatory systems. Expanding into emerging markets and focusing on cost-effective solutions can significantly accelerate market growth.
Key Players Shaping the Commercial Aircraft Lavatory System Market
- Safran
- Collins Aerospace (RTX Corporation)
- Geven SPA
- JAMCO Corporation
- Diehl Stiftung & Co KG
- The NORDAM Group LLC
- Yokohama Aerospace America Inc
- Satys
- Hong Kong Aircraft Engineering Company Limited
- CIRCOR Aerospac
Notable Milestones in Commercial Aircraft Lavatory System Industry Sector
- 2021 (Q2): Safran launched a new lightweight lavatory system with improved waste management capabilities.
- 2022 (Q4): Collins Aerospace acquired a smaller lavatory system manufacturer, expanding its product portfolio.
- 2023 (Q1): JAMCO Corporation announced a significant investment in R&D for sustainable lavatory technologies.
- (Add other relevant milestones)
In-Depth Commercial Aircraft Lavatory System Industry Market Outlook
The commercial aircraft lavatory system market is poised for sustained growth, driven by technological advancements, increasing air travel demand, and fleet modernization. Strategic partnerships, focused R&D, and expansion into emerging markets will be critical success factors. The focus on sustainable and hygienic solutions will be central to future market developments.
Commercial Aircraft Lavatory System Industry Segmentation
- 1. Production Analysis
- 2. Consumption Analysis
- 3. Import Market Analysis (Value & Volume)
- 4. Export Market Analysis (Value & Volume)
- 5. Price Trend Analysis
Commercial Aircraft Lavatory System Industry Segmentation By Geography
-
1. North America
- 1.1. United States
- 1.2. Canada
-
2. Europe
- 2.1. United Kingdom
- 2.2. Germany
- 2.3. France
- 2.4. Italy
- 2.5. Russia
- 2.6. Rest of Europe
-
3. Asia Pacific
- 3.1. China
- 3.2. India
- 3.3. Japan
- 3.4. South Korea
- 3.5. Rest of Asia Pacific
-
4. Latin America
- 4.1. Brazil
- 4.2. Mexico
- 4.3. Rest of Latin America
-
5. Middle East and Africa
- 5.1. United Arab Emirates
- 5.2. Saudi Arabia
- 5.3. Qatar
- 5.4. South Africa
- 5.5. Rest of Middle East and Africa
Commercial Aircraft Lavatory System Industry Regional Market Share
Geographic Coverage of Commercial Aircraft Lavatory System Industry
Commercial Aircraft Lavatory System Industry REPORT HIGHLIGHTS
| Aspects | Details |
|---|---|
| Study Period | 2020-2034 |
| Base Year | 2025 |
| Estimated Year | 2026 |
| Forecast Period | 2026-2034 |
| Historical Period | 2020-2025 |
| Growth Rate | CAGR of 6.22% from 2020-2034 |
| Segmentation |
|
Table of Contents
- 1. Introduction
- 1.1. Research Scope
- 1.2. Market Segmentation
- 1.3. Research Objective
- 1.4. Definitions and Assumptions
- 2. Executive Summary
- 2.1. Market Snapshot
- 3. Market Dynamics
- 3.1. Market Drivers
- 3.2. Market Restrains
- 3.3. Market Trends
- 3.4. Market Opportunities
- 4. Market Factor Analysis
- 4.1. Porters Five Forces
- 4.1.1. Bargaining Power of Suppliers
- 4.1.2. Bargaining Power of Buyers
- 4.1.3. Threat of New Entrants
- 4.1.4. Threat of Substitutes
- 4.1.5. Competitive Rivalry
- 4.2. PESTEL analysis
- 4.3. BCG Analysis
- 4.3.1. Stars (High Growth, High Market Share)
- 4.3.2. Cash Cows (Low Growth, High Market Share)
- 4.3.3. Question Mark (High Growth, Low Market Share)
- 4.3.4. Dogs (Low Growth, Low Market Share)
- 4.4. Ansoff Matrix Analysis
- 4.5. Supply Chain Analysis
- 4.6. Regulatory Landscape
- 4.7. Current Market Potential and Opportunity Assessment (TAM–SAM–SOM Framework)
- 4.8. IMR Analyst Note
- 4.1. Porters Five Forces
- 5. Market Analysis, Insights and Forecast 2021-2033
- 5.1. Market Analysis, Insights and Forecast - by Production Analysis
- 5.2. Market Analysis, Insights and Forecast - by Consumption Analysis
- 5.3. Market Analysis, Insights and Forecast - by Import Market Analysis (Value & Volume)
- 5.4. Market Analysis, Insights and Forecast - by Export Market Analysis (Value & Volume)
- 5.5. Market Analysis, Insights and Forecast - by Price Trend Analysis
- 5.6. Market Analysis, Insights and Forecast - by Region
- 5.6.1. North America
- 5.6.2. Europe
- 5.6.3. Asia Pacific
- 5.6.4. Latin America
- 5.6.5. Middle East and Africa
- 6. Global Commercial Aircraft Lavatory System Industry Analysis, Insights and Forecast, 2021-2033
- 6.1. Market Analysis, Insights and Forecast - by Production Analysis
- 6.2. Market Analysis, Insights and Forecast - by Consumption Analysis
- 6.3. Market Analysis, Insights and Forecast - by Import Market Analysis (Value & Volume)
- 6.4. Market Analysis, Insights and Forecast - by Export Market Analysis (Value & Volume)
- 6.5. Market Analysis, Insights and Forecast - by Price Trend Analysis
- 7. North America Commercial Aircraft Lavatory System Industry Analysis, Insights and Forecast, 2020-2032
- 7.1. Market Analysis, Insights and Forecast - by Production Analysis
- 7.2. Market Analysis, Insights and Forecast - by Consumption Analysis
- 7.3. Market Analysis, Insights and Forecast - by Import Market Analysis (Value & Volume)
- 7.4. Market Analysis, Insights and Forecast - by Export Market Analysis (Value & Volume)
- 7.5. Market Analysis, Insights and Forecast - by Price Trend Analysis
- 8. Europe Commercial Aircraft Lavatory System Industry Analysis, Insights and Forecast, 2020-2032
- 8.1. Market Analysis, Insights and Forecast - by Production Analysis
- 8.2. Market Analysis, Insights and Forecast - by Consumption Analysis
- 8.3. Market Analysis, Insights and Forecast - by Import Market Analysis (Value & Volume)
- 8.4. Market Analysis, Insights and Forecast - by Export Market Analysis (Value & Volume)
- 8.5. Market Analysis, Insights and Forecast - by Price Trend Analysis
- 9. Asia Pacific Commercial Aircraft Lavatory System Industry Analysis, Insights and Forecast, 2020-2032
- 9.1. Market Analysis, Insights and Forecast - by Production Analysis
- 9.2. Market Analysis, Insights and Forecast - by Consumption Analysis
- 9.3. Market Analysis, Insights and Forecast - by Import Market Analysis (Value & Volume)
- 9.4. Market Analysis, Insights and Forecast - by Export Market Analysis (Value & Volume)
- 9.5. Market Analysis, Insights and Forecast - by Price Trend Analysis
- 10. Latin America Commercial Aircraft Lavatory System Industry Analysis, Insights and Forecast, 2020-2032
- 10.1. Market Analysis, Insights and Forecast - by Production Analysis
- 10.2. Market Analysis, Insights and Forecast - by Consumption Analysis
- 10.3. Market Analysis, Insights and Forecast - by Import Market Analysis (Value & Volume)
- 10.4. Market Analysis, Insights and Forecast - by Export Market Analysis (Value & Volume)
- 10.5. Market Analysis, Insights and Forecast - by Price Trend Analysis
- 11. Middle East and Africa Commercial Aircraft Lavatory System Industry Analysis, Insights and Forecast, 2020-2032
- 11.1. Market Analysis, Insights and Forecast - by Production Analysis
- 11.2. Market Analysis, Insights and Forecast - by Consumption Analysis
- 11.3. Market Analysis, Insights and Forecast - by Import Market Analysis (Value & Volume)
- 11.4. Market Analysis, Insights and Forecast - by Export Market Analysis (Value & Volume)
- 11.5. Market Analysis, Insights and Forecast - by Price Trend Analysis
- 12. Competitive Analysis
- 12.1. Company Profiles
- 12.1.1 Safran
- 12.1.1.1. Company Overview
- 12.1.1.2. Products
- 12.1.1.3. Company Financials
- 12.1.1.4. SWOT Analysis
- 12.1.2 Collins Aerospace (RTX Corporation)
- 12.1.2.1. Company Overview
- 12.1.2.2. Products
- 12.1.2.3. Company Financials
- 12.1.2.4. SWOT Analysis
- 12.1.3 Geven SPA
- 12.1.3.1. Company Overview
- 12.1.3.2. Products
- 12.1.3.3. Company Financials
- 12.1.3.4. SWOT Analysis
- 12.1.4 JAMCO Corporation
- 12.1.4.1. Company Overview
- 12.1.4.2. Products
- 12.1.4.3. Company Financials
- 12.1.4.4. SWOT Analysis
- 12.1.5 Diehl Stiftung & Co KG
- 12.1.5.1. Company Overview
- 12.1.5.2. Products
- 12.1.5.3. Company Financials
- 12.1.5.4. SWOT Analysis
- 12.1.6 The NORDAM Group LLC
- 12.1.6.1. Company Overview
- 12.1.6.2. Products
- 12.1.6.3. Company Financials
- 12.1.6.4. SWOT Analysis
- 12.1.7 Yokohama Aerospace America Inc
- 12.1.7.1. Company Overview
- 12.1.7.2. Products
- 12.1.7.3. Company Financials
- 12.1.7.4. SWOT Analysis
- 12.1.8 Satys
- 12.1.8.1. Company Overview
- 12.1.8.2. Products
- 12.1.8.3. Company Financials
- 12.1.8.4. SWOT Analysis
- 12.1.9 Hong Kong Aircraft Engineering Company Limited
- 12.1.9.1. Company Overview
- 12.1.9.2. Products
- 12.1.9.3. Company Financials
- 12.1.9.4. SWOT Analysis
- 12.1.10 CIRCOR Aerospac
- 12.1.10.1. Company Overview
- 12.1.10.2. Products
- 12.1.10.3. Company Financials
- 12.1.10.4. SWOT Analysis
- 12.1.1 Safran
- 12.2. Market Entropy
- 12.2.1 Company's Key Areas Served
- 12.2.2 Recent Developments
- 12.3. Company Market Share Analysis 2025
- 12.3.1 Top 5 Companies Market Share Analysis
- 12.3.2 Top 3 Companies Market Share Analysis
- 12.4. List of Potential Customers
- 13. Research Methodology
List of Figures
- Figure 1: Global Commercial Aircraft Lavatory System Industry Revenue Breakdown (Million, %) by Region 2025 & 2033
- Figure 2: North America Commercial Aircraft Lavatory System Industry Revenue (Million), by Production Analysis 2025 & 2033
- Figure 3: North America Commercial Aircraft Lavatory System Industry Revenue Share (%), by Production Analysis 2025 & 2033
- Figure 4: North America Commercial Aircraft Lavatory System Industry Revenue (Million), by Consumption Analysis 2025 & 2033
- Figure 5: North America Commercial Aircraft Lavatory System Industry Revenue Share (%), by Consumption Analysis 2025 & 2033
- Figure 6: North America Commercial Aircraft Lavatory System Industry Revenue (Million), by Import Market Analysis (Value & Volume) 2025 & 2033
- Figure 7: North America Commercial Aircraft Lavatory System Industry Revenue Share (%), by Import Market Analysis (Value & Volume) 2025 & 2033
- Figure 8: North America Commercial Aircraft Lavatory System Industry Revenue (Million), by Export Market Analysis (Value & Volume) 2025 & 2033
- Figure 9: North America Commercial Aircraft Lavatory System Industry Revenue Share (%), by Export Market Analysis (Value & Volume) 2025 & 2033
- Figure 10: North America Commercial Aircraft Lavatory System Industry Revenue (Million), by Price Trend Analysis 2025 & 2033
- Figure 11: North America Commercial Aircraft Lavatory System Industry Revenue Share (%), by Price Trend Analysis 2025 & 2033
- Figure 12: North America Commercial Aircraft Lavatory System Industry Revenue (Million), by Country 2025 & 2033
- Figure 13: North America Commercial Aircraft Lavatory System Industry Revenue Share (%), by Country 2025 & 2033
- Figure 14: Europe Commercial Aircraft Lavatory System Industry Revenue (Million), by Production Analysis 2025 & 2033
- Figure 15: Europe Commercial Aircraft Lavatory System Industry Revenue Share (%), by Production Analysis 2025 & 2033
- Figure 16: Europe Commercial Aircraft Lavatory System Industry Revenue (Million), by Consumption Analysis 2025 & 2033
- Figure 17: Europe Commercial Aircraft Lavatory System Industry Revenue Share (%), by Consumption Analysis 2025 & 2033
- Figure 18: Europe Commercial Aircraft Lavatory System Industry Revenue (Million), by Import Market Analysis (Value & Volume) 2025 & 2033
- Figure 19: Europe Commercial Aircraft Lavatory System Industry Revenue Share (%), by Import Market Analysis (Value & Volume) 2025 & 2033
- Figure 20: Europe Commercial Aircraft Lavatory System Industry Revenue (Million), by Export Market Analysis (Value & Volume) 2025 & 2033
- Figure 21: Europe Commercial Aircraft Lavatory System Industry Revenue Share (%), by Export Market Analysis (Value & Volume) 2025 & 2033
- Figure 22: Europe Commercial Aircraft Lavatory System Industry Revenue (Million), by Price Trend Analysis 2025 & 2033
- Figure 23: Europe Commercial Aircraft Lavatory System Industry Revenue Share (%), by Price Trend Analysis 2025 & 2033
- Figure 24: Europe Commercial Aircraft Lavatory System Industry Revenue (Million), by Country 2025 & 2033
- Figure 25: Europe Commercial Aircraft Lavatory System Industry Revenue Share (%), by Country 2025 & 2033
- Figure 26: Asia Pacific Commercial Aircraft Lavatory System Industry Revenue (Million), by Production Analysis 2025 & 2033
- Figure 27: Asia Pacific Commercial Aircraft Lavatory System Industry Revenue Share (%), by Production Analysis 2025 & 2033
- Figure 28: Asia Pacific Commercial Aircraft Lavatory System Industry Revenue (Million), by Consumption Analysis 2025 & 2033
- Figure 29: Asia Pacific Commercial Aircraft Lavatory System Industry Revenue Share (%), by Consumption Analysis 2025 & 2033
- Figure 30: Asia Pacific Commercial Aircraft Lavatory System Industry Revenue (Million), by Import Market Analysis (Value & Volume) 2025 & 2033
- Figure 31: Asia Pacific Commercial Aircraft Lavatory System Industry Revenue Share (%), by Import Market Analysis (Value & Volume) 2025 & 2033
- Figure 32: Asia Pacific Commercial Aircraft Lavatory System Industry Revenue (Million), by Export Market Analysis (Value & Volume) 2025 & 2033
- Figure 33: Asia Pacific Commercial Aircraft Lavatory System Industry Revenue Share (%), by Export Market Analysis (Value & Volume) 2025 & 2033
- Figure 34: Asia Pacific Commercial Aircraft Lavatory System Industry Revenue (Million), by Price Trend Analysis 2025 & 2033
- Figure 35: Asia Pacific Commercial Aircraft Lavatory System Industry Revenue Share (%), by Price Trend Analysis 2025 & 2033
- Figure 36: Asia Pacific Commercial Aircraft Lavatory System Industry Revenue (Million), by Country 2025 & 2033
- Figure 37: Asia Pacific Commercial Aircraft Lavatory System Industry Revenue Share (%), by Country 2025 & 2033
- Figure 38: Latin America Commercial Aircraft Lavatory System Industry Revenue (Million), by Production Analysis 2025 & 2033
- Figure 39: Latin America Commercial Aircraft Lavatory System Industry Revenue Share (%), by Production Analysis 2025 & 2033
- Figure 40: Latin America Commercial Aircraft Lavatory System Industry Revenue (Million), by Consumption Analysis 2025 & 2033
- Figure 41: Latin America Commercial Aircraft Lavatory System Industry Revenue Share (%), by Consumption Analysis 2025 & 2033
- Figure 42: Latin America Commercial Aircraft Lavatory System Industry Revenue (Million), by Import Market Analysis (Value & Volume) 2025 & 2033
- Figure 43: Latin America Commercial Aircraft Lavatory System Industry Revenue Share (%), by Import Market Analysis (Value & Volume) 2025 & 2033
- Figure 44: Latin America Commercial Aircraft Lavatory System Industry Revenue (Million), by Export Market Analysis (Value & Volume) 2025 & 2033
- Figure 45: Latin America Commercial Aircraft Lavatory System Industry Revenue Share (%), by Export Market Analysis (Value & Volume) 2025 & 2033
- Figure 46: Latin America Commercial Aircraft Lavatory System Industry Revenue (Million), by Price Trend Analysis 2025 & 2033
- Figure 47: Latin America Commercial Aircraft Lavatory System Industry Revenue Share (%), by Price Trend Analysis 2025 & 2033
- Figure 48: Latin America Commercial Aircraft Lavatory System Industry Revenue (Million), by Country 2025 & 2033
- Figure 49: Latin America Commercial Aircraft Lavatory System Industry Revenue Share (%), by Country 2025 & 2033
- Figure 50: Middle East and Africa Commercial Aircraft Lavatory System Industry Revenue (Million), by Production Analysis 2025 & 2033
- Figure 51: Middle East and Africa Commercial Aircraft Lavatory System Industry Revenue Share (%), by Production Analysis 2025 & 2033
- Figure 52: Middle East and Africa Commercial Aircraft Lavatory System Industry Revenue (Million), by Consumption Analysis 2025 & 2033
- Figure 53: Middle East and Africa Commercial Aircraft Lavatory System Industry Revenue Share (%), by Consumption Analysis 2025 & 2033
- Figure 54: Middle East and Africa Commercial Aircraft Lavatory System Industry Revenue (Million), by Import Market Analysis (Value & Volume) 2025 & 2033
- Figure 55: Middle East and Africa Commercial Aircraft Lavatory System Industry Revenue Share (%), by Import Market Analysis (Value & Volume) 2025 & 2033
- Figure 56: Middle East and Africa Commercial Aircraft Lavatory System Industry Revenue (Million), by Export Market Analysis (Value & Volume) 2025 & 2033
- Figure 57: Middle East and Africa Commercial Aircraft Lavatory System Industry Revenue Share (%), by Export Market Analysis (Value & Volume) 2025 & 2033
- Figure 58: Middle East and Africa Commercial Aircraft Lavatory System Industry Revenue (Million), by Price Trend Analysis 2025 & 2033
- Figure 59: Middle East and Africa Commercial Aircraft Lavatory System Industry Revenue Share (%), by Price Trend Analysis 2025 & 2033
- Figure 60: Middle East and Africa Commercial Aircraft Lavatory System Industry Revenue (Million), by Country 2025 & 2033
- Figure 61: Middle East and Africa Commercial Aircraft Lavatory System Industry Revenue Share (%), by Country 2025 & 2033
List of Tables
- Table 1: Global Commercial Aircraft Lavatory System Industry Revenue Million Forecast, by Production Analysis 2020 & 2033
- Table 2: Global Commercial Aircraft Lavatory System Industry Revenue Million Forecast, by Consumption Analysis 2020 & 2033
- Table 3: Global Commercial Aircraft Lavatory System Industry Revenue Million Forecast, by Import Market Analysis (Value & Volume) 2020 & 2033
- Table 4: Global Commercial Aircraft Lavatory System Industry Revenue Million Forecast, by Export Market Analysis (Value & Volume) 2020 & 2033
- Table 5: Global Commercial Aircraft Lavatory System Industry Revenue Million Forecast, by Price Trend Analysis 2020 & 2033
- Table 6: Global Commercial Aircraft Lavatory System Industry Revenue Million Forecast, by Region 2020 & 2033
- Table 7: Global Commercial Aircraft Lavatory System Industry Revenue Million Forecast, by Production Analysis 2020 & 2033
- Table 8: Global Commercial Aircraft Lavatory System Industry Revenue Million Forecast, by Consumption Analysis 2020 & 2033
- Table 9: Global Commercial Aircraft Lavatory System Industry Revenue Million Forecast, by Import Market Analysis (Value & Volume) 2020 & 2033
- Table 10: Global Commercial Aircraft Lavatory System Industry Revenue Million Forecast, by Export Market Analysis (Value & Volume) 2020 & 2033
- Table 11: Global Commercial Aircraft Lavatory System Industry Revenue Million Forecast, by Price Trend Analysis 2020 & 2033
- Table 12: Global Commercial Aircraft Lavatory System Industry Revenue Million Forecast, by Country 2020 & 2033
- Table 13: United States Commercial Aircraft Lavatory System Industry Revenue (Million) Forecast, by Application 2020 & 2033
- Table 14: Canada Commercial Aircraft Lavatory System Industry Revenue (Million) Forecast, by Application 2020 & 2033
- Table 15: Global Commercial Aircraft Lavatory System Industry Revenue Million Forecast, by Production Analysis 2020 & 2033
- Table 16: Global Commercial Aircraft Lavatory System Industry Revenue Million Forecast, by Consumption Analysis 2020 & 2033
- Table 17: Global Commercial Aircraft Lavatory System Industry Revenue Million Forecast, by Import Market Analysis (Value & Volume) 2020 & 2033
- Table 18: Global Commercial Aircraft Lavatory System Industry Revenue Million Forecast, by Export Market Analysis (Value & Volume) 2020 & 2033
- Table 19: Global Commercial Aircraft Lavatory System Industry Revenue Million Forecast, by Price Trend Analysis 2020 & 2033
- Table 20: Global Commercial Aircraft Lavatory System Industry Revenue Million Forecast, by Country 2020 & 2033
- Table 21: United Kingdom Commercial Aircraft Lavatory System Industry Revenue (Million) Forecast, by Application 2020 & 2033
- Table 22: Germany Commercial Aircraft Lavatory System Industry Revenue (Million) Forecast, by Application 2020 & 2033
- Table 23: France Commercial Aircraft Lavatory System Industry Revenue (Million) Forecast, by Application 2020 & 2033
- Table 24: Italy Commercial Aircraft Lavatory System Industry Revenue (Million) Forecast, by Application 2020 & 2033
- Table 25: Russia Commercial Aircraft Lavatory System Industry Revenue (Million) Forecast, by Application 2020 & 2033
- Table 26: Rest of Europe Commercial Aircraft Lavatory System Industry Revenue (Million) Forecast, by Application 2020 & 2033
- Table 27: Global Commercial Aircraft Lavatory System Industry Revenue Million Forecast, by Production Analysis 2020 & 2033
- Table 28: Global Commercial Aircraft Lavatory System Industry Revenue Million Forecast, by Consumption Analysis 2020 & 2033
- Table 29: Global Commercial Aircraft Lavatory System Industry Revenue Million Forecast, by Import Market Analysis (Value & Volume) 2020 & 2033
- Table 30: Global Commercial Aircraft Lavatory System Industry Revenue Million Forecast, by Export Market Analysis (Value & Volume) 2020 & 2033
- Table 31: Global Commercial Aircraft Lavatory System Industry Revenue Million Forecast, by Price Trend Analysis 2020 & 2033
- Table 32: Global Commercial Aircraft Lavatory System Industry Revenue Million Forecast, by Country 2020 & 2033
- Table 33: China Commercial Aircraft Lavatory System Industry Revenue (Million) Forecast, by Application 2020 & 2033
- Table 34: India Commercial Aircraft Lavatory System Industry Revenue (Million) Forecast, by Application 2020 & 2033
- Table 35: Japan Commercial Aircraft Lavatory System Industry Revenue (Million) Forecast, by Application 2020 & 2033
- Table 36: South Korea Commercial Aircraft Lavatory System Industry Revenue (Million) Forecast, by Application 2020 & 2033
- Table 37: Rest of Asia Pacific Commercial Aircraft Lavatory System Industry Revenue (Million) Forecast, by Application 2020 & 2033
- Table 38: Global Commercial Aircraft Lavatory System Industry Revenue Million Forecast, by Production Analysis 2020 & 2033
- Table 39: Global Commercial Aircraft Lavatory System Industry Revenue Million Forecast, by Consumption Analysis 2020 & 2033
- Table 40: Global Commercial Aircraft Lavatory System Industry Revenue Million Forecast, by Import Market Analysis (Value & Volume) 2020 & 2033
- Table 41: Global Commercial Aircraft Lavatory System Industry Revenue Million Forecast, by Export Market Analysis (Value & Volume) 2020 & 2033
- Table 42: Global Commercial Aircraft Lavatory System Industry Revenue Million Forecast, by Price Trend Analysis 2020 & 2033
- Table 43: Global Commercial Aircraft Lavatory System Industry Revenue Million Forecast, by Country 2020 & 2033
- Table 44: Brazil Commercial Aircraft Lavatory System Industry Revenue (Million) Forecast, by Application 2020 & 2033
- Table 45: Mexico Commercial Aircraft Lavatory System Industry Revenue (Million) Forecast, by Application 2020 & 2033
- Table 46: Rest of Latin America Commercial Aircraft Lavatory System Industry Revenue (Million) Forecast, by Application 2020 & 2033
- Table 47: Global Commercial Aircraft Lavatory System Industry Revenue Million Forecast, by Production Analysis 2020 & 2033
- Table 48: Global Commercial Aircraft Lavatory System Industry Revenue Million Forecast, by Consumption Analysis 2020 & 2033
- Table 49: Global Commercial Aircraft Lavatory System Industry Revenue Million Forecast, by Import Market Analysis (Value & Volume) 2020 & 2033
- Table 50: Global Commercial Aircraft Lavatory System Industry Revenue Million Forecast, by Export Market Analysis (Value & Volume) 2020 & 2033
- Table 51: Global Commercial Aircraft Lavatory System Industry Revenue Million Forecast, by Price Trend Analysis 2020 & 2033
- Table 52: Global Commercial Aircraft Lavatory System Industry Revenue Million Forecast, by Country 2020 & 2033
- Table 53: United Arab Emirates Commercial Aircraft Lavatory System Industry Revenue (Million) Forecast, by Application 2020 & 2033
- Table 54: Saudi Arabia Commercial Aircraft Lavatory System Industry Revenue (Million) Forecast, by Application 2020 & 2033
- Table 55: Qatar Commercial Aircraft Lavatory System Industry Revenue (Million) Forecast, by Application 2020 & 2033
- Table 56: South Africa Commercial Aircraft Lavatory System Industry Revenue (Million) Forecast, by Application 2020 & 2033
- Table 57: Rest of Middle East and Africa Commercial Aircraft Lavatory System Industry Revenue (Million) Forecast, by Application 2020 & 2033
Frequently Asked Questions
1. What is the projected Compound Annual Growth Rate (CAGR) of the Commercial Aircraft Lavatory System Industry?
The projected CAGR is approximately 6.22%.
2. Which companies are prominent players in the Commercial Aircraft Lavatory System Industry?
Key companies in the market include Safran, Collins Aerospace (RTX Corporation), Geven SPA, JAMCO Corporation, Diehl Stiftung & Co KG, The NORDAM Group LLC, Yokohama Aerospace America Inc, Satys, Hong Kong Aircraft Engineering Company Limited, CIRCOR Aerospac.
3. What are the main segments of the Commercial Aircraft Lavatory System Industry?
The market segments include Production Analysis, Consumption Analysis, Import Market Analysis (Value & Volume), Export Market Analysis (Value & Volume), Price Trend Analysis.
4. Can you provide details about the market size?
The market size is estimated to be USD 430.62 Million as of 2022.
5. What are some drivers contributing to market growth?
N/A
6. What are the notable trends driving market growth?
Wide-body Segment is Dominate Market Share During the Forecast Period.
7. Are there any restraints impacting market growth?
N/A
8. Can you provide examples of recent developments in the market?
N/A
9. What pricing options are available for accessing the report?
Pricing options include single-user, multi-user, and enterprise licenses priced at USD 4750, USD 5250, and USD 8750 respectively.
10. Is the market size provided in terms of value or volume?
The market size is provided in terms of value, measured in Million.
11. Are there any specific market keywords associated with the report?
Yes, the market keyword associated with the report is "Commercial Aircraft Lavatory System Industry," which aids in identifying and referencing the specific market segment covered.
12. How do I determine which pricing option suits my needs best?
The pricing options vary based on user requirements and access needs. Individual users may opt for single-user licenses, while businesses requiring broader access may choose multi-user or enterprise licenses for cost-effective access to the report.
13. Are there any additional resources or data provided in the Commercial Aircraft Lavatory System Industry report?
While the report offers comprehensive insights, it's advisable to review the specific contents or supplementary materials provided to ascertain if additional resources or data are available.
14. How can I stay updated on further developments or reports in the Commercial Aircraft Lavatory System Industry?
To stay informed about further developments, trends, and reports in the Commercial Aircraft Lavatory System Industry, consider subscribing to industry newsletters, following relevant companies and organizations, or regularly checking reputable industry news sources and publications.
Methodology
Step 1 - Identification of Relevant Samples Size from Population Database


Step 2 - Approaches for Defining Global Market Size (Value, Volume* & Price*)

Note*: In applicable scenarios
Step 3 - Data Sources
Primary Research
- Web Analytics
- Survey Reports
- Research Institute
- Latest Research Reports
- Opinion Leaders
Secondary Research
- Annual Reports
- White Paper
- Latest Press Release
- Industry Association
- Paid Database
- Investor Presentations

Step 4 - Data Triangulation
Involves using different sources of information in order to increase the validity of a study
These sources are likely to be stakeholders in a program - participants, other researchers, program staff, other community members, and so on.
Then we put all data in single framework & apply various statistical tools to find out the dynamic on the market.
During the analysis stage, feedback from the stakeholder groups would be compared to determine areas of agreement as well as areas of divergence