

Key Insights
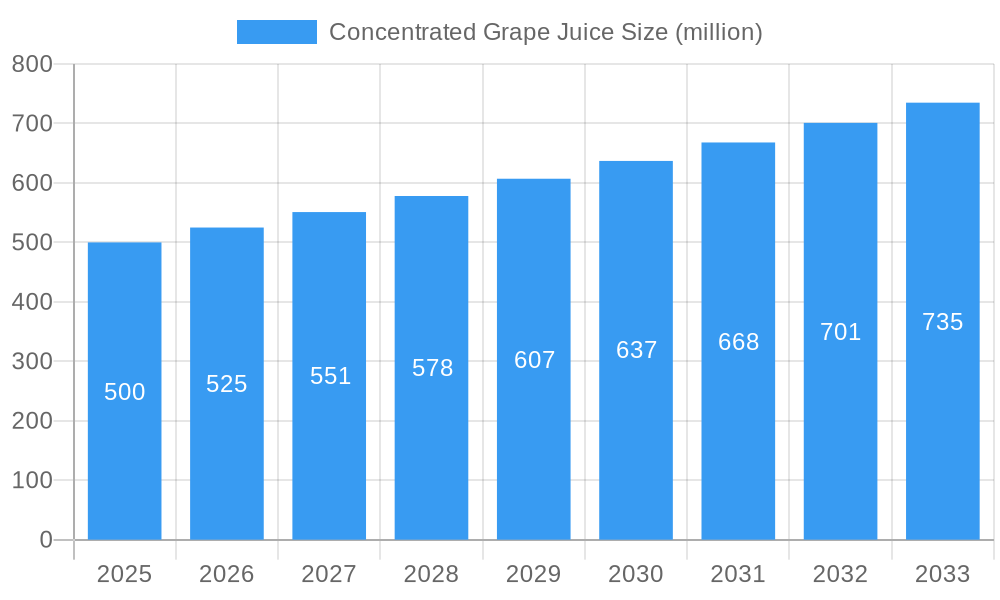
The concentrated grape juice market is poised for significant expansion, driven by escalating demand for convenient and health-conscious beverage choices. Key growth drivers include the rising popularity of functional beverages and heightened consumer awareness of grape juice's health advantages, particularly its rich antioxidant content. The versatile application of concentrated grape juice as a key ingredient in diverse food and beverage products, such as jams, jellies, and wines, further amplifies market reach beyond direct consumption. Continuous innovation in packaging and product formulations, including organic and low-sugar variants, effectively addresses evolving consumer preferences and propels market momentum. The market is projected to reach a size of $975 million by 2025, with an estimated CAGR of 6.2% from 2025 to 2033. This growth trajectory reflects the market's maturity, balanced by the active participation of both leading and emerging industry players.
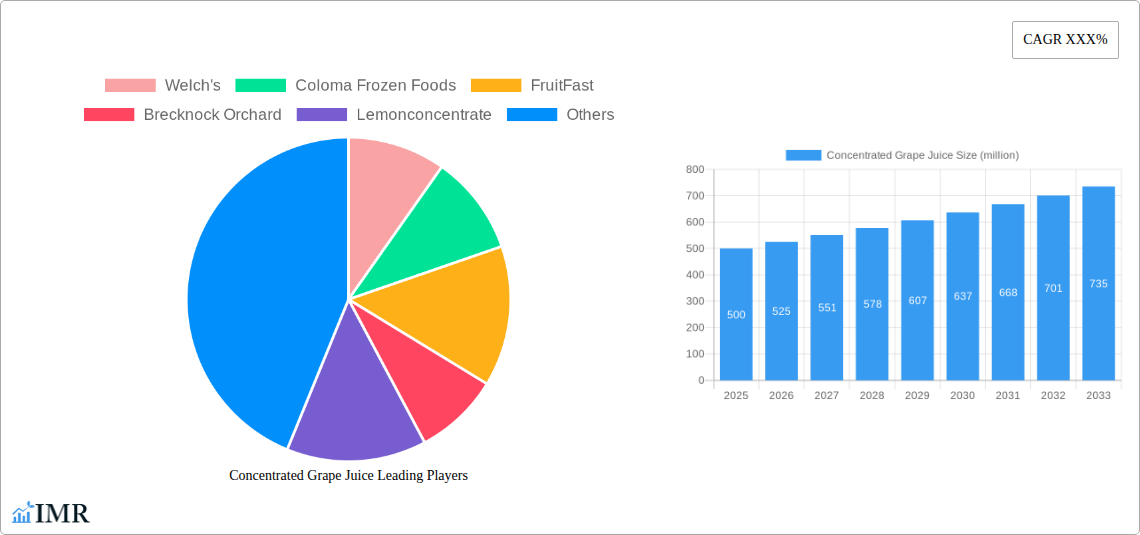
Concentrated Grape Juice Market Size (In Million)
Nevertheless, the market encounters obstacles, including potential restraints stemming from fluctuating grape harvests influenced by climatic conditions and the possibility of increased raw material costs. Intense competition from alternative fruit juice concentrates and beverage options mandates ongoing innovation and product differentiation for sustained competitive advantage. Future growth strategies will likely prioritize expansion into new geographic markets, diversification of product portfolios, and reinforcement of supply chains to counter external volaticals. Enhanced marketing initiatives emphasizing the health benefits and versatility of concentrated grape juice are anticipated to attract a broader consumer base. Market segmentation is expected to align with product types (organic, conventional), packaging formats (bottles, pouches), and distribution channels (retail, food service).
Concentrated Grape Juice Company Market Share
Concentrated Grape Juice Market Report: 2019-2033
This comprehensive report provides a detailed analysis of the global concentrated grape juice market, encompassing market dynamics, growth trends, regional insights, competitive landscape, and future outlook. The study period covers 2019-2033, with 2025 serving as the base and estimated year. This report is invaluable for industry professionals, investors, and businesses seeking to understand and capitalize on the opportunities within this dynamic sector.
Concentrated Grape Juice Market Dynamics & Structure
The concentrated grape juice market is characterized by moderate concentration, with a few major players holding significant market share. Welch's, Old Orchard Juices, and Coloma Frozen Foods are prominent examples. The market is driven by technological advancements in juice processing and preservation, leading to improved product quality and shelf life. Stringent regulatory frameworks concerning food safety and labeling influence production practices. Competitive substitutes include other fruit juices and juice blends, posing a challenge to market growth. End-user demographics primarily comprise food and beverage manufacturers, with increasing demand from the health and wellness sectors. M&A activity in the concentrated grape juice industry has been moderate, with an estimated xx million units in deal volume during the historical period (2019-2024).
- Market Concentration: Moderately concentrated, with top 5 players holding approximately xx% market share in 2025.
- Technological Innovation: Focus on improved extraction techniques, preservation methods, and aseptic packaging to enhance quality and extend shelf life.
- Regulatory Framework: Stringent food safety regulations and labeling requirements influence production and marketing strategies.
- Competitive Substitutes: Other fruit juices (apple, orange), juice blends, and other beverage options present competitive pressures.
- End-User Demographics: Primarily food and beverage manufacturers, with growing demand from the health and wellness segment.
- M&A Trends: Moderate activity during 2019-2024, with an estimated xx million units in deal value. Innovation barriers include high R&D costs and stringent regulatory approvals.
Concentrated Grape Juice Growth Trends & Insights
The global concentrated grape juice market experienced a steady growth trajectory during the historical period (2019-2024), with a CAGR of xx%. This growth is attributed to rising consumer demand for healthier beverages, increasing use in processed foods, and expansion in emerging markets. Technological advancements in extraction and preservation technologies have further contributed to market expansion. However, fluctuating raw material prices and changing consumer preferences towards other beverage options pose challenges. Market penetration in developed regions is relatively high, while emerging markets present significant growth opportunities. The forecast period (2025-2033) anticipates continued growth, driven by factors such as increasing health consciousness, product diversification, and targeted marketing strategies. The projected CAGR for the forecast period is xx%.
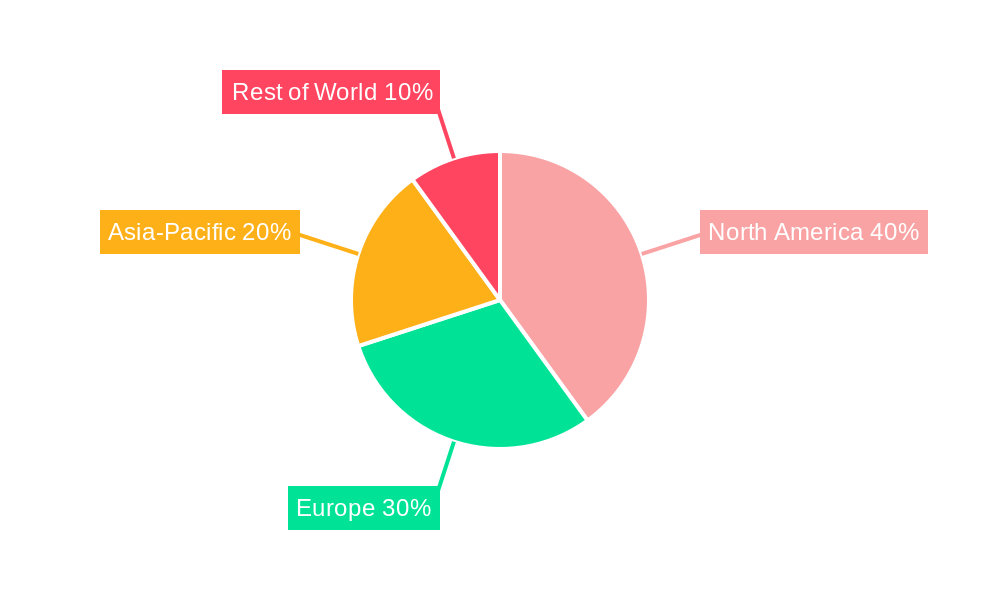
Dominant Regions, Countries, or Segments in Concentrated Grape Juice
North America and Europe currently dominate the concentrated grape juice market, driven by established processing infrastructure, strong consumer demand, and a well-developed food and beverage industry. The high per capita consumption of juices and processed foods in these regions fuels significant growth. However, Asia-Pacific is poised for significant expansion, driven by rising disposable incomes, changing dietary habits, and a growing demand for convenient and ready-to-consume beverages.
- North America: High consumption rates, established infrastructure, and a large processed food sector contribute to its dominant position.
- Europe: Strong consumer preference for fruit juices and a well-established juice processing industry contribute to its market share.
- Asia-Pacific: Rapid economic growth, increasing disposable incomes, and a burgeoning food and beverage industry are driving significant market expansion.
- Key Drivers: Favorable economic policies supporting the food and beverage industry, efficient logistics and distribution networks, and consumer preference for convenient and healthy beverages are key drivers.
Concentrated Grape Juice Product Landscape
The concentrated grape juice market offers a variety of products, ranging from standard concentrated juice to specialty blends with added functional ingredients. Innovation focuses on enhancing flavor profiles, extending shelf life, and improving nutritional content. Technological advancements, such as improved extraction techniques and aseptic packaging, enhance product quality and consumer appeal. Unique selling propositions include organic certifications, reduced sugar content, and the incorporation of functional ingredients that cater to specific health needs.
Key Drivers, Barriers & Challenges in Concentrated Grape Juice
Key Drivers:
- Growing demand for healthy and convenient beverages.
- Increasing use in processed foods and beverages.
- Expansion into emerging markets with rising disposable incomes.
- Technological advancements in juice extraction and preservation.
Key Challenges:
- Fluctuations in raw material prices (grapes).
- Intense competition from other fruit juices and beverage options.
- Stringent food safety regulations and labeling requirements.
- Potential supply chain disruptions due to climate change or geopolitical instability. These factors could lead to a xx% increase in production costs.
Emerging Opportunities in Concentrated Grape Juice
- Expanding into untapped markets in developing countries.
- Developing innovative product formulations, such as functional juices with added vitamins or antioxidants.
- Catering to evolving consumer preferences towards organic and sustainably sourced products.
- Utilizing digital marketing and e-commerce channels to reach a wider consumer base.
Growth Accelerators in the Concentrated Grape Juice Industry
Strategic partnerships between juice processors and food manufacturers to develop innovative product lines will accelerate growth. Technological advancements in processing, packaging, and preservation, coupled with targeted marketing and expansion into emerging markets, create significant opportunities for long-term growth. Investment in research and development to create new functional and convenient products will further fuel expansion.
Key Players Shaping the Concentrated Grape Juice Market
- Welch's
- Coloma Frozen Foods
- FruitFast
- Brecknock Orchard
- Lemonconcentrate
- Love Brewing
- Old Orchard Juices
- CK Natural Fruit Juice
- Melkkobrew
- Nature's Flavors
- Bigger Jugs
- OIV
- Country Pure Foods
- Jiucheng All Rights Reserved
Notable Milestones in Concentrated Grape Juice Sector
- 2020: Introduction of aseptic packaging technology by a major player, extending shelf life and improving product quality.
- 2022: Acquisition of a smaller juice producer by a multinational food and beverage company, expanding market reach.
- 2023: Launch of a new line of organic concentrated grape juice targeting health-conscious consumers.
In-Depth Concentrated Grape Juice Market Outlook
The concentrated grape juice market is poised for continued growth over the forecast period (2025-2033), driven by the factors discussed above. Strategic partnerships, technological advancements, and expansion into emerging markets will play a crucial role in shaping future market dynamics. Companies that prioritize innovation, sustainability, and consumer preferences are expected to thrive in this competitive landscape. The long-term outlook is optimistic, with significant potential for market expansion and profitability.
Concentrated Grape Juice Segmentation
-
1. Application
- 1.1. Wine Making
- 1.2. Beverage
- 1.3. Food
- 1.4. Other
-
2. Type
- 2.1. Purple Grape Juice Concentrate
- 2.2. White Grape Juice Concentrate
Concentrated Grape Juice Segmentation By Geography
-
1. North America
- 1.1. United States
- 1.2. Canada
- 1.3. Mexico
-
2. South America
- 2.1. Brazil
- 2.2. Argentina
- 2.3. Rest of South America
-
3. Europe
- 3.1. United Kingdom
- 3.2. Germany
- 3.3. France
- 3.4. Italy
- 3.5. Spain
- 3.6. Russia
- 3.7. Benelux
- 3.8. Nordics
- 3.9. Rest of Europe
-
4. Middle East & Africa
- 4.1. Turkey
- 4.2. Israel
- 4.3. GCC
- 4.4. North Africa
- 4.5. South Africa
- 4.6. Rest of Middle East & Africa
-
5. Asia Pacific
- 5.1. China
- 5.2. India
- 5.3. Japan
- 5.4. South Korea
- 5.5. ASEAN
- 5.6. Oceania
- 5.7. Rest of Asia Pacific
Concentrated Grape Juice Regional Market Share
Geographic Coverage of Concentrated Grape Juice
Concentrated Grape Juice REPORT HIGHLIGHTS
| Aspects | Details |
|---|---|
| Study Period | 2020-2034 |
| Base Year | 2025 |
| Estimated Year | 2026 |
| Forecast Period | 2026-2034 |
| Historical Period | 2020-2025 |
| Growth Rate | CAGR of 6.2% from 2020-2034 |
| Segmentation |
|
Table of Contents
- 1. Introduction
- 1.1. Research Scope
- 1.2. Market Segmentation
- 1.3. Research Methodology
- 1.4. Definitions and Assumptions
- 2. Executive Summary
- 2.1. Introduction
- 3. Market Dynamics
- 3.1. Introduction
- 3.2. Market Drivers
- 3.3. Market Restrains
- 3.4. Market Trends
- 4. Market Factor Analysis
- 4.1. Porters Five Forces
- 4.2. Supply/Value Chain
- 4.3. PESTEL analysis
- 4.4. Market Entropy
- 4.5. Patent/Trademark Analysis
- 5. Global Concentrated Grape Juice Analysis, Insights and Forecast, 2020-2032
- 5.1. Market Analysis, Insights and Forecast - by Application
- 5.1.1. Wine Making
- 5.1.2. Beverage
- 5.1.3. Food
- 5.1.4. Other
- 5.2. Market Analysis, Insights and Forecast - by Type
- 5.2.1. Purple Grape Juice Concentrate
- 5.2.2. White Grape Juice Concentrate
- 5.3. Market Analysis, Insights and Forecast - by Region
- 5.3.1. North America
- 5.3.2. South America
- 5.3.3. Europe
- 5.3.4. Middle East & Africa
- 5.3.5. Asia Pacific
- 5.1. Market Analysis, Insights and Forecast - by Application
- 6. North America Concentrated Grape Juice Analysis, Insights and Forecast, 2020-2032
- 6.1. Market Analysis, Insights and Forecast - by Application
- 6.1.1. Wine Making
- 6.1.2. Beverage
- 6.1.3. Food
- 6.1.4. Other
- 6.2. Market Analysis, Insights and Forecast - by Type
- 6.2.1. Purple Grape Juice Concentrate
- 6.2.2. White Grape Juice Concentrate
- 6.1. Market Analysis, Insights and Forecast - by Application
- 7. South America Concentrated Grape Juice Analysis, Insights and Forecast, 2020-2032
- 7.1. Market Analysis, Insights and Forecast - by Application
- 7.1.1. Wine Making
- 7.1.2. Beverage
- 7.1.3. Food
- 7.1.4. Other
- 7.2. Market Analysis, Insights and Forecast - by Type
- 7.2.1. Purple Grape Juice Concentrate
- 7.2.2. White Grape Juice Concentrate
- 7.1. Market Analysis, Insights and Forecast - by Application
- 8. Europe Concentrated Grape Juice Analysis, Insights and Forecast, 2020-2032
- 8.1. Market Analysis, Insights and Forecast - by Application
- 8.1.1. Wine Making
- 8.1.2. Beverage
- 8.1.3. Food
- 8.1.4. Other
- 8.2. Market Analysis, Insights and Forecast - by Type
- 8.2.1. Purple Grape Juice Concentrate
- 8.2.2. White Grape Juice Concentrate
- 8.1. Market Analysis, Insights and Forecast - by Application
- 9. Middle East & Africa Concentrated Grape Juice Analysis, Insights and Forecast, 2020-2032
- 9.1. Market Analysis, Insights and Forecast - by Application
- 9.1.1. Wine Making
- 9.1.2. Beverage
- 9.1.3. Food
- 9.1.4. Other
- 9.2. Market Analysis, Insights and Forecast - by Type
- 9.2.1. Purple Grape Juice Concentrate
- 9.2.2. White Grape Juice Concentrate
- 9.1. Market Analysis, Insights and Forecast - by Application
- 10. Asia Pacific Concentrated Grape Juice Analysis, Insights and Forecast, 2020-2032
- 10.1. Market Analysis, Insights and Forecast - by Application
- 10.1.1. Wine Making
- 10.1.2. Beverage
- 10.1.3. Food
- 10.1.4. Other
- 10.2. Market Analysis, Insights and Forecast - by Type
- 10.2.1. Purple Grape Juice Concentrate
- 10.2.2. White Grape Juice Concentrate
- 10.1. Market Analysis, Insights and Forecast - by Application
- 11. Competitive Analysis
- 11.1. Global Market Share Analysis 2025
- 11.2. Company Profiles
- 11.2.1 Welch's
- 11.2.1.1. Overview
- 11.2.1.2. Products
- 11.2.1.3. SWOT Analysis
- 11.2.1.4. Recent Developments
- 11.2.1.5. Financials (Based on Availability)
- 11.2.2 Coloma Frozen Foods
- 11.2.2.1. Overview
- 11.2.2.2. Products
- 11.2.2.3. SWOT Analysis
- 11.2.2.4. Recent Developments
- 11.2.2.5. Financials (Based on Availability)
- 11.2.3 FruitFast
- 11.2.3.1. Overview
- 11.2.3.2. Products
- 11.2.3.3. SWOT Analysis
- 11.2.3.4. Recent Developments
- 11.2.3.5. Financials (Based on Availability)
- 11.2.4 Brecknock Orchard
- 11.2.4.1. Overview
- 11.2.4.2. Products
- 11.2.4.3. SWOT Analysis
- 11.2.4.4. Recent Developments
- 11.2.4.5. Financials (Based on Availability)
- 11.2.5 Lemonconcentrate
- 11.2.5.1. Overview
- 11.2.5.2. Products
- 11.2.5.3. SWOT Analysis
- 11.2.5.4. Recent Developments
- 11.2.5.5. Financials (Based on Availability)
- 11.2.6 Love Brewing
- 11.2.6.1. Overview
- 11.2.6.2. Products
- 11.2.6.3. SWOT Analysis
- 11.2.6.4. Recent Developments
- 11.2.6.5. Financials (Based on Availability)
- 11.2.7 Old Orchard Juices
- 11.2.7.1. Overview
- 11.2.7.2. Products
- 11.2.7.3. SWOT Analysis
- 11.2.7.4. Recent Developments
- 11.2.7.5. Financials (Based on Availability)
- 11.2.8 CK Natural Fruit Juice
- 11.2.8.1. Overview
- 11.2.8.2. Products
- 11.2.8.3. SWOT Analysis
- 11.2.8.4. Recent Developments
- 11.2.8.5. Financials (Based on Availability)
- 11.2.9 Melkkobrew
- 11.2.9.1. Overview
- 11.2.9.2. Products
- 11.2.9.3. SWOT Analysis
- 11.2.9.4. Recent Developments
- 11.2.9.5. Financials (Based on Availability)
- 11.2.10 Nature's Flavors
- 11.2.10.1. Overview
- 11.2.10.2. Products
- 11.2.10.3. SWOT Analysis
- 11.2.10.4. Recent Developments
- 11.2.10.5. Financials (Based on Availability)
- 11.2.11 Bigger Jugs
- 11.2.11.1. Overview
- 11.2.11.2. Products
- 11.2.11.3. SWOT Analysis
- 11.2.11.4. Recent Developments
- 11.2.11.5. Financials (Based on Availability)
- 11.2.12 OIV
- 11.2.12.1. Overview
- 11.2.12.2. Products
- 11.2.12.3. SWOT Analysis
- 11.2.12.4. Recent Developments
- 11.2.12.5. Financials (Based on Availability)
- 11.2.13 Country Pure Foods
- 11.2.13.1. Overview
- 11.2.13.2. Products
- 11.2.13.3. SWOT Analysis
- 11.2.13.4. Recent Developments
- 11.2.13.5. Financials (Based on Availability)
- 11.2.14 Jiucheng All Rights Reserved
- 11.2.14.1. Overview
- 11.2.14.2. Products
- 11.2.14.3. SWOT Analysis
- 11.2.14.4. Recent Developments
- 11.2.14.5. Financials (Based on Availability)
- 11.2.1 Welch's
List of Figures
- Figure 1: Global Concentrated Grape Juice Revenue Breakdown (million, %) by Region 2025 & 2033
- Figure 2: Global Concentrated Grape Juice Volume Breakdown (K, %) by Region 2025 & 2033
- Figure 3: North America Concentrated Grape Juice Revenue (million), by Application 2025 & 2033
- Figure 4: North America Concentrated Grape Juice Volume (K), by Application 2025 & 2033
- Figure 5: North America Concentrated Grape Juice Revenue Share (%), by Application 2025 & 2033
- Figure 6: North America Concentrated Grape Juice Volume Share (%), by Application 2025 & 2033
- Figure 7: North America Concentrated Grape Juice Revenue (million), by Type 2025 & 2033
- Figure 8: North America Concentrated Grape Juice Volume (K), by Type 2025 & 2033
- Figure 9: North America Concentrated Grape Juice Revenue Share (%), by Type 2025 & 2033
- Figure 10: North America Concentrated Grape Juice Volume Share (%), by Type 2025 & 2033
- Figure 11: North America Concentrated Grape Juice Revenue (million), by Country 2025 & 2033
- Figure 12: North America Concentrated Grape Juice Volume (K), by Country 2025 & 2033
- Figure 13: North America Concentrated Grape Juice Revenue Share (%), by Country 2025 & 2033
- Figure 14: North America Concentrated Grape Juice Volume Share (%), by Country 2025 & 2033
- Figure 15: South America Concentrated Grape Juice Revenue (million), by Application 2025 & 2033
- Figure 16: South America Concentrated Grape Juice Volume (K), by Application 2025 & 2033
- Figure 17: South America Concentrated Grape Juice Revenue Share (%), by Application 2025 & 2033
- Figure 18: South America Concentrated Grape Juice Volume Share (%), by Application 2025 & 2033
- Figure 19: South America Concentrated Grape Juice Revenue (million), by Type 2025 & 2033
- Figure 20: South America Concentrated Grape Juice Volume (K), by Type 2025 & 2033
- Figure 21: South America Concentrated Grape Juice Revenue Share (%), by Type 2025 & 2033
- Figure 22: South America Concentrated Grape Juice Volume Share (%), by Type 2025 & 2033
- Figure 23: South America Concentrated Grape Juice Revenue (million), by Country 2025 & 2033
- Figure 24: South America Concentrated Grape Juice Volume (K), by Country 2025 & 2033
- Figure 25: South America Concentrated Grape Juice Revenue Share (%), by Country 2025 & 2033
- Figure 26: South America Concentrated Grape Juice Volume Share (%), by Country 2025 & 2033
- Figure 27: Europe Concentrated Grape Juice Revenue (million), by Application 2025 & 2033
- Figure 28: Europe Concentrated Grape Juice Volume (K), by Application 2025 & 2033
- Figure 29: Europe Concentrated Grape Juice Revenue Share (%), by Application 2025 & 2033
- Figure 30: Europe Concentrated Grape Juice Volume Share (%), by Application 2025 & 2033
- Figure 31: Europe Concentrated Grape Juice Revenue (million), by Type 2025 & 2033
- Figure 32: Europe Concentrated Grape Juice Volume (K), by Type 2025 & 2033
- Figure 33: Europe Concentrated Grape Juice Revenue Share (%), by Type 2025 & 2033
- Figure 34: Europe Concentrated Grape Juice Volume Share (%), by Type 2025 & 2033
- Figure 35: Europe Concentrated Grape Juice Revenue (million), by Country 2025 & 2033
- Figure 36: Europe Concentrated Grape Juice Volume (K), by Country 2025 & 2033
- Figure 37: Europe Concentrated Grape Juice Revenue Share (%), by Country 2025 & 2033
- Figure 38: Europe Concentrated Grape Juice Volume Share (%), by Country 2025 & 2033
- Figure 39: Middle East & Africa Concentrated Grape Juice Revenue (million), by Application 2025 & 2033
- Figure 40: Middle East & Africa Concentrated Grape Juice Volume (K), by Application 2025 & 2033
- Figure 41: Middle East & Africa Concentrated Grape Juice Revenue Share (%), by Application 2025 & 2033
- Figure 42: Middle East & Africa Concentrated Grape Juice Volume Share (%), by Application 2025 & 2033
- Figure 43: Middle East & Africa Concentrated Grape Juice Revenue (million), by Type 2025 & 2033
- Figure 44: Middle East & Africa Concentrated Grape Juice Volume (K), by Type 2025 & 2033
- Figure 45: Middle East & Africa Concentrated Grape Juice Revenue Share (%), by Type 2025 & 2033
- Figure 46: Middle East & Africa Concentrated Grape Juice Volume Share (%), by Type 2025 & 2033
- Figure 47: Middle East & Africa Concentrated Grape Juice Revenue (million), by Country 2025 & 2033
- Figure 48: Middle East & Africa Concentrated Grape Juice Volume (K), by Country 2025 & 2033
- Figure 49: Middle East & Africa Concentrated Grape Juice Revenue Share (%), by Country 2025 & 2033
- Figure 50: Middle East & Africa Concentrated Grape Juice Volume Share (%), by Country 2025 & 2033
- Figure 51: Asia Pacific Concentrated Grape Juice Revenue (million), by Application 2025 & 2033
- Figure 52: Asia Pacific Concentrated Grape Juice Volume (K), by Application 2025 & 2033
- Figure 53: Asia Pacific Concentrated Grape Juice Revenue Share (%), by Application 2025 & 2033
- Figure 54: Asia Pacific Concentrated Grape Juice Volume Share (%), by Application 2025 & 2033
- Figure 55: Asia Pacific Concentrated Grape Juice Revenue (million), by Type 2025 & 2033
- Figure 56: Asia Pacific Concentrated Grape Juice Volume (K), by Type 2025 & 2033
- Figure 57: Asia Pacific Concentrated Grape Juice Revenue Share (%), by Type 2025 & 2033
- Figure 58: Asia Pacific Concentrated Grape Juice Volume Share (%), by Type 2025 & 2033
- Figure 59: Asia Pacific Concentrated Grape Juice Revenue (million), by Country 2025 & 2033
- Figure 60: Asia Pacific Concentrated Grape Juice Volume (K), by Country 2025 & 2033
- Figure 61: Asia Pacific Concentrated Grape Juice Revenue Share (%), by Country 2025 & 2033
- Figure 62: Asia Pacific Concentrated Grape Juice Volume Share (%), by Country 2025 & 2033
List of Tables
- Table 1: Global Concentrated Grape Juice Revenue million Forecast, by Application 2020 & 2033
- Table 2: Global Concentrated Grape Juice Volume K Forecast, by Application 2020 & 2033
- Table 3: Global Concentrated Grape Juice Revenue million Forecast, by Type 2020 & 2033
- Table 4: Global Concentrated Grape Juice Volume K Forecast, by Type 2020 & 2033
- Table 5: Global Concentrated Grape Juice Revenue million Forecast, by Region 2020 & 2033
- Table 6: Global Concentrated Grape Juice Volume K Forecast, by Region 2020 & 2033
- Table 7: Global Concentrated Grape Juice Revenue million Forecast, by Application 2020 & 2033
- Table 8: Global Concentrated Grape Juice Volume K Forecast, by Application 2020 & 2033
- Table 9: Global Concentrated Grape Juice Revenue million Forecast, by Type 2020 & 2033
- Table 10: Global Concentrated Grape Juice Volume K Forecast, by Type 2020 & 2033
- Table 11: Global Concentrated Grape Juice Revenue million Forecast, by Country 2020 & 2033
- Table 12: Global Concentrated Grape Juice Volume K Forecast, by Country 2020 & 2033
- Table 13: United States Concentrated Grape Juice Revenue (million) Forecast, by Application 2020 & 2033
- Table 14: United States Concentrated Grape Juice Volume (K) Forecast, by Application 2020 & 2033
- Table 15: Canada Concentrated Grape Juice Revenue (million) Forecast, by Application 2020 & 2033
- Table 16: Canada Concentrated Grape Juice Volume (K) Forecast, by Application 2020 & 2033
- Table 17: Mexico Concentrated Grape Juice Revenue (million) Forecast, by Application 2020 & 2033
- Table 18: Mexico Concentrated Grape Juice Volume (K) Forecast, by Application 2020 & 2033
- Table 19: Global Concentrated Grape Juice Revenue million Forecast, by Application 2020 & 2033
- Table 20: Global Concentrated Grape Juice Volume K Forecast, by Application 2020 & 2033
- Table 21: Global Concentrated Grape Juice Revenue million Forecast, by Type 2020 & 2033
- Table 22: Global Concentrated Grape Juice Volume K Forecast, by Type 2020 & 2033
- Table 23: Global Concentrated Grape Juice Revenue million Forecast, by Country 2020 & 2033
- Table 24: Global Concentrated Grape Juice Volume K Forecast, by Country 2020 & 2033
- Table 25: Brazil Concentrated Grape Juice Revenue (million) Forecast, by Application 2020 & 2033
- Table 26: Brazil Concentrated Grape Juice Volume (K) Forecast, by Application 2020 & 2033
- Table 27: Argentina Concentrated Grape Juice Revenue (million) Forecast, by Application 2020 & 2033
- Table 28: Argentina Concentrated Grape Juice Volume (K) Forecast, by Application 2020 & 2033
- Table 29: Rest of South America Concentrated Grape Juice Revenue (million) Forecast, by Application 2020 & 2033
- Table 30: Rest of South America Concentrated Grape Juice Volume (K) Forecast, by Application 2020 & 2033
- Table 31: Global Concentrated Grape Juice Revenue million Forecast, by Application 2020 & 2033
- Table 32: Global Concentrated Grape Juice Volume K Forecast, by Application 2020 & 2033
- Table 33: Global Concentrated Grape Juice Revenue million Forecast, by Type 2020 & 2033
- Table 34: Global Concentrated Grape Juice Volume K Forecast, by Type 2020 & 2033
- Table 35: Global Concentrated Grape Juice Revenue million Forecast, by Country 2020 & 2033
- Table 36: Global Concentrated Grape Juice Volume K Forecast, by Country 2020 & 2033
- Table 37: United Kingdom Concentrated Grape Juice Revenue (million) Forecast, by Application 2020 & 2033
- Table 38: United Kingdom Concentrated Grape Juice Volume (K) Forecast, by Application 2020 & 2033
- Table 39: Germany Concentrated Grape Juice Revenue (million) Forecast, by Application 2020 & 2033
- Table 40: Germany Concentrated Grape Juice Volume (K) Forecast, by Application 2020 & 2033
- Table 41: France Concentrated Grape Juice Revenue (million) Forecast, by Application 2020 & 2033
- Table 42: France Concentrated Grape Juice Volume (K) Forecast, by Application 2020 & 2033
- Table 43: Italy Concentrated Grape Juice Revenue (million) Forecast, by Application 2020 & 2033
- Table 44: Italy Concentrated Grape Juice Volume (K) Forecast, by Application 2020 & 2033
- Table 45: Spain Concentrated Grape Juice Revenue (million) Forecast, by Application 2020 & 2033
- Table 46: Spain Concentrated Grape Juice Volume (K) Forecast, by Application 2020 & 2033
- Table 47: Russia Concentrated Grape Juice Revenue (million) Forecast, by Application 2020 & 2033
- Table 48: Russia Concentrated Grape Juice Volume (K) Forecast, by Application 2020 & 2033
- Table 49: Benelux Concentrated Grape Juice Revenue (million) Forecast, by Application 2020 & 2033
- Table 50: Benelux Concentrated Grape Juice Volume (K) Forecast, by Application 2020 & 2033
- Table 51: Nordics Concentrated Grape Juice Revenue (million) Forecast, by Application 2020 & 2033
- Table 52: Nordics Concentrated Grape Juice Volume (K) Forecast, by Application 2020 & 2033
- Table 53: Rest of Europe Concentrated Grape Juice Revenue (million) Forecast, by Application 2020 & 2033
- Table 54: Rest of Europe Concentrated Grape Juice Volume (K) Forecast, by Application 2020 & 2033
- Table 55: Global Concentrated Grape Juice Revenue million Forecast, by Application 2020 & 2033
- Table 56: Global Concentrated Grape Juice Volume K Forecast, by Application 2020 & 2033
- Table 57: Global Concentrated Grape Juice Revenue million Forecast, by Type 2020 & 2033
- Table 58: Global Concentrated Grape Juice Volume K Forecast, by Type 2020 & 2033
- Table 59: Global Concentrated Grape Juice Revenue million Forecast, by Country 2020 & 2033
- Table 60: Global Concentrated Grape Juice Volume K Forecast, by Country 2020 & 2033
- Table 61: Turkey Concentrated Grape Juice Revenue (million) Forecast, by Application 2020 & 2033
- Table 62: Turkey Concentrated Grape Juice Volume (K) Forecast, by Application 2020 & 2033
- Table 63: Israel Concentrated Grape Juice Revenue (million) Forecast, by Application 2020 & 2033
- Table 64: Israel Concentrated Grape Juice Volume (K) Forecast, by Application 2020 & 2033
- Table 65: GCC Concentrated Grape Juice Revenue (million) Forecast, by Application 2020 & 2033
- Table 66: GCC Concentrated Grape Juice Volume (K) Forecast, by Application 2020 & 2033
- Table 67: North Africa Concentrated Grape Juice Revenue (million) Forecast, by Application 2020 & 2033
- Table 68: North Africa Concentrated Grape Juice Volume (K) Forecast, by Application 2020 & 2033
- Table 69: South Africa Concentrated Grape Juice Revenue (million) Forecast, by Application 2020 & 2033
- Table 70: South Africa Concentrated Grape Juice Volume (K) Forecast, by Application 2020 & 2033
- Table 71: Rest of Middle East & Africa Concentrated Grape Juice Revenue (million) Forecast, by Application 2020 & 2033
- Table 72: Rest of Middle East & Africa Concentrated Grape Juice Volume (K) Forecast, by Application 2020 & 2033
- Table 73: Global Concentrated Grape Juice Revenue million Forecast, by Application 2020 & 2033
- Table 74: Global Concentrated Grape Juice Volume K Forecast, by Application 2020 & 2033
- Table 75: Global Concentrated Grape Juice Revenue million Forecast, by Type 2020 & 2033
- Table 76: Global Concentrated Grape Juice Volume K Forecast, by Type 2020 & 2033
- Table 77: Global Concentrated Grape Juice Revenue million Forecast, by Country 2020 & 2033
- Table 78: Global Concentrated Grape Juice Volume K Forecast, by Country 2020 & 2033
- Table 79: China Concentrated Grape Juice Revenue (million) Forecast, by Application 2020 & 2033
- Table 80: China Concentrated Grape Juice Volume (K) Forecast, by Application 2020 & 2033
- Table 81: India Concentrated Grape Juice Revenue (million) Forecast, by Application 2020 & 2033
- Table 82: India Concentrated Grape Juice Volume (K) Forecast, by Application 2020 & 2033
- Table 83: Japan Concentrated Grape Juice Revenue (million) Forecast, by Application 2020 & 2033
- Table 84: Japan Concentrated Grape Juice Volume (K) Forecast, by Application 2020 & 2033
- Table 85: South Korea Concentrated Grape Juice Revenue (million) Forecast, by Application 2020 & 2033
- Table 86: South Korea Concentrated Grape Juice Volume (K) Forecast, by Application 2020 & 2033
- Table 87: ASEAN Concentrated Grape Juice Revenue (million) Forecast, by Application 2020 & 2033
- Table 88: ASEAN Concentrated Grape Juice Volume (K) Forecast, by Application 2020 & 2033
- Table 89: Oceania Concentrated Grape Juice Revenue (million) Forecast, by Application 2020 & 2033
- Table 90: Oceania Concentrated Grape Juice Volume (K) Forecast, by Application 2020 & 2033
- Table 91: Rest of Asia Pacific Concentrated Grape Juice Revenue (million) Forecast, by Application 2020 & 2033
- Table 92: Rest of Asia Pacific Concentrated Grape Juice Volume (K) Forecast, by Application 2020 & 2033
Frequently Asked Questions
1. What is the projected Compound Annual Growth Rate (CAGR) of the Concentrated Grape Juice?
The projected CAGR is approximately 6.2%.
2. Which companies are prominent players in the Concentrated Grape Juice?
Key companies in the market include Welch's, Coloma Frozen Foods, FruitFast, Brecknock Orchard, Lemonconcentrate, Love Brewing, Old Orchard Juices, CK Natural Fruit Juice, Melkkobrew, Nature's Flavors, Bigger Jugs, OIV, Country Pure Foods, Jiucheng All Rights Reserved.
3. What are the main segments of the Concentrated Grape Juice?
The market segments include Application, Type.
4. Can you provide details about the market size?
The market size is estimated to be USD 975 million as of 2022.
5. What are some drivers contributing to market growth?
N/A
6. What are the notable trends driving market growth?
N/A
7. Are there any restraints impacting market growth?
N/A
8. Can you provide examples of recent developments in the market?
N/A
9. What pricing options are available for accessing the report?
Pricing options include single-user, multi-user, and enterprise licenses priced at USD 3950.00, USD 5925.00, and USD 7900.00 respectively.
10. Is the market size provided in terms of value or volume?
The market size is provided in terms of value, measured in million and volume, measured in K.
11. Are there any specific market keywords associated with the report?
Yes, the market keyword associated with the report is "Concentrated Grape Juice," which aids in identifying and referencing the specific market segment covered.
12. How do I determine which pricing option suits my needs best?
The pricing options vary based on user requirements and access needs. Individual users may opt for single-user licenses, while businesses requiring broader access may choose multi-user or enterprise licenses for cost-effective access to the report.
13. Are there any additional resources or data provided in the Concentrated Grape Juice report?
While the report offers comprehensive insights, it's advisable to review the specific contents or supplementary materials provided to ascertain if additional resources or data are available.
14. How can I stay updated on further developments or reports in the Concentrated Grape Juice?
To stay informed about further developments, trends, and reports in the Concentrated Grape Juice, consider subscribing to industry newsletters, following relevant companies and organizations, or regularly checking reputable industry news sources and publications.
Methodology
Step 1 - Identification of Relevant Samples Size from Population Database


Step 2 - Approaches for Defining Global Market Size (Value, Volume* & Price*)

Note*: In applicable scenarios
Step 3 - Data Sources
Primary Research
- Web Analytics
- Survey Reports
- Research Institute
- Latest Research Reports
- Opinion Leaders
Secondary Research
- Annual Reports
- White Paper
- Latest Press Release
- Industry Association
- Paid Database
- Investor Presentations

Step 4 - Data Triangulation
Involves using different sources of information in order to increase the validity of a study
These sources are likely to be stakeholders in a program - participants, other researchers, program staff, other community members, and so on.
Then we put all data in single framework & apply various statistical tools to find out the dynamic on the market.
During the analysis stage, feedback from the stakeholder groups would be compared to determine areas of agreement as well as areas of divergence