

Key Insights
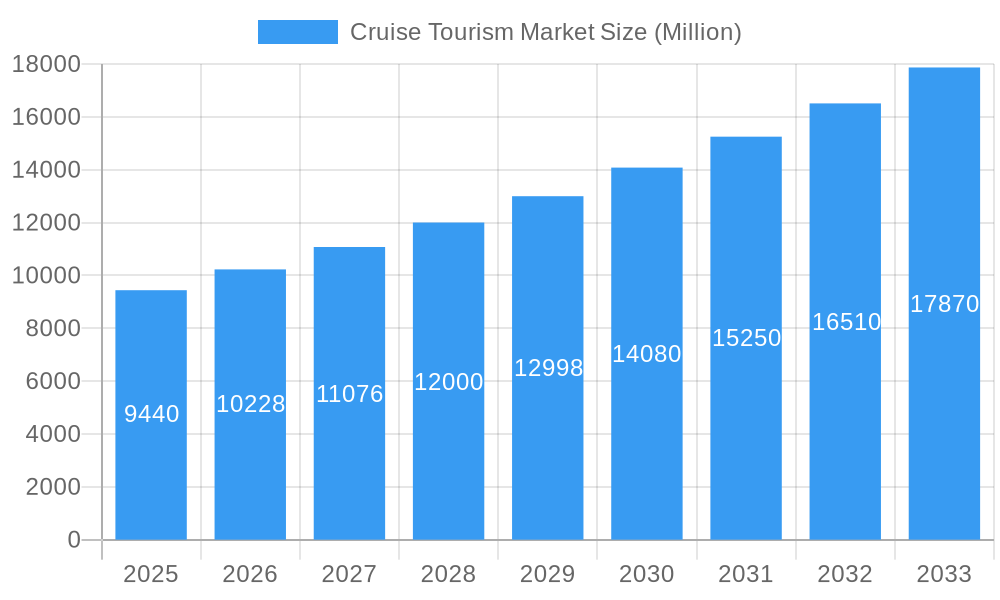
The global cruise tourism market, valued at $9.44 billion in 2025, is projected to experience robust growth, exhibiting a compound annual growth rate (CAGR) of 8.67% from 2025 to 2033. This expansion is driven by several key factors. Rising disposable incomes, particularly in emerging economies, are fueling increased demand for leisure travel and luxury experiences. The growing popularity of unique cruise itineraries, such as expedition cruises and themed cruises catering to specific interests (e.g., culinary, historical, or adventure-focused voyages), contributes significantly to market growth. Furthermore, advancements in cruise ship technology and infrastructure, including larger vessels with enhanced amenities and improved sustainability initiatives, are attracting a broader range of travelers. The market is segmented by passenger age, cruise type (river, ocean, expedition, theme, adventure), and duration, allowing cruise lines to tailor offerings to diverse preferences. The North American market currently holds a significant share, but Asia-Pacific is anticipated to demonstrate substantial growth potential driven by increasing tourism infrastructure and a rising middle class. Challenges include fluctuating fuel prices, environmental concerns regarding cruise ship emissions, and the potential impact of geopolitical instability on travel patterns. However, the industry's ongoing efforts to address environmental sustainability and enhance passenger safety will mitigate some of these risks.
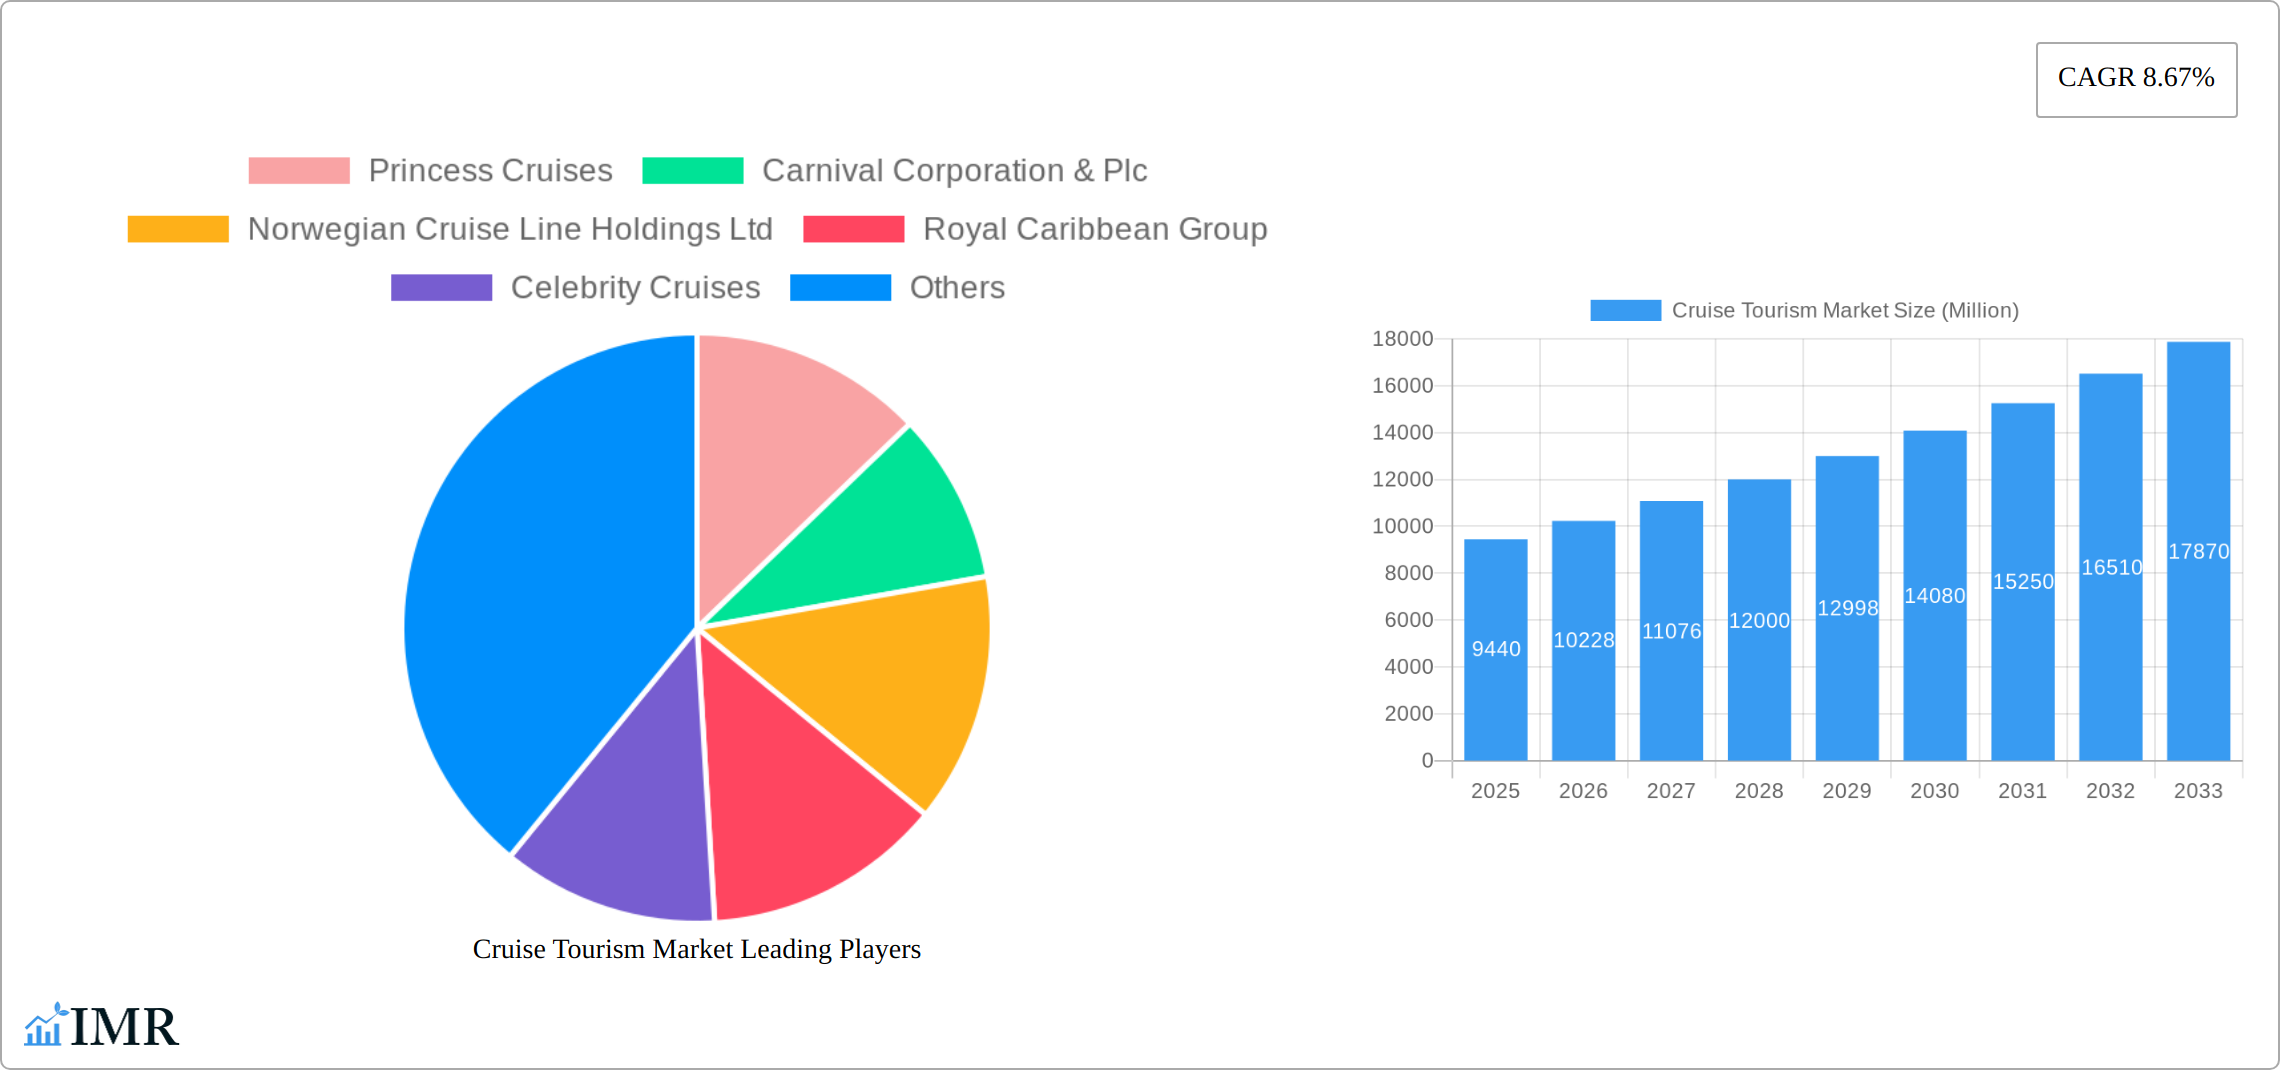
Cruise Tourism Market Market Size (In Billion)
The competitive landscape is characterized by both large global players like Carnival Corporation & Plc, Royal Caribbean Group, and MSC Cruises, and smaller, niche operators focusing on specialized itineraries. These companies are continuously investing in fleet expansion, innovative marketing strategies, and partnerships to gain a competitive edge. Market segmentation allows for targeted marketing and product development, maximizing revenue generation across diverse traveler demographics. Growth is expected to be most pronounced in the Asia-Pacific and South America regions, reflecting the rising popularity of cruising in these regions. The longer duration cruises (15-20 days and beyond) are also anticipated to see increased demand as travelers seek more immersive and in-depth experiences. Continued innovation and adaptability within the industry will be crucial in sustaining this positive trajectory and navigating emerging challenges.
Cruise Tourism Market Company Market Share
Cruise Tourism Market: A Comprehensive Market Report (2019-2033)
This in-depth report provides a comprehensive analysis of the global cruise tourism market, encompassing historical data (2019-2024), current estimates (2025), and future forecasts (2025-2033). It delves into market dynamics, growth trends, regional dominance, product landscapes, and key players, offering valuable insights for industry professionals, investors, and stakeholders. The report segments the market by passenger age, cruise type, and duration, providing granular data for informed decision-making. The market size is projected at xx Million in 2025.
Cruise Tourism Market Dynamics & Structure
The cruise tourism market is characterized by moderate concentration, with a few major players dominating the landscape. Market share is influenced by brand recognition, fleet size, itinerary diversity, and customer service. Technological innovations, particularly in digital booking platforms and onboard experiences, are crucial drivers of growth. Stringent safety regulations and environmental concerns form a key part of the regulatory framework. While land-based tourism and alternative vacation options serve as competitive substitutes, the cruise industry leverages its unique offerings – all-inclusive packages, diverse itineraries, and entertainment – to maintain market appeal. End-user demographics are significant, with growth influenced by shifts in disposable income, travel preferences, and aging populations. M&A activity, though not rampant, shapes market dynamics, leading to consolidation and increased market power for some players. For example, strategic alliances and acquisitions contribute to economies of scale and improved service offerings.
- Market Concentration: Moderately concentrated, with top five players controlling approximately xx% of the market in 2025.
- Technological Innovation: Focus on digitalization of booking, enhanced onboard technology, and sustainable practices.
- Regulatory Framework: Stringent safety, environmental, and security regulations influence operational costs.
- Competitive Substitutes: Land-based tourism, adventure travel, and staycations pose competitive threats.
- End-User Demographics: Aging population and rising middle class contribute to market growth; specific age segments are analyzed in detail.
- M&A Trends: xx number of M&A deals recorded between 2019 and 2024; consolidation expected to continue.
Cruise Tourism Market Growth Trends & Insights
The global cruise tourism market, significantly impacted by the COVID-19 pandemic between 2019 and 2024, is poised for robust recovery and sustained growth from 2025 to 2033. This resurgence is driven by pent-up demand, rising disposable incomes in key demographics, and the industry's proactive adoption of enhanced safety protocols. Technological advancements, including streamlined online booking systems and personalized onboard experiences, are boosting adoption rates and elevating customer satisfaction. Evolving consumer preferences, emphasizing unique and sustainable travel options, are shaping cruise line strategies and product development. The market is projected to achieve a CAGR of xx% during 2025-2033, with market penetration increasing from xx% in 2025 to xx% by 2033, reaching a projected market size of xx million by 2033. Key growth catalysts include the increasing popularity of luxury cruise experiences and the burgeoning demand for eco-conscious and experiential travel.
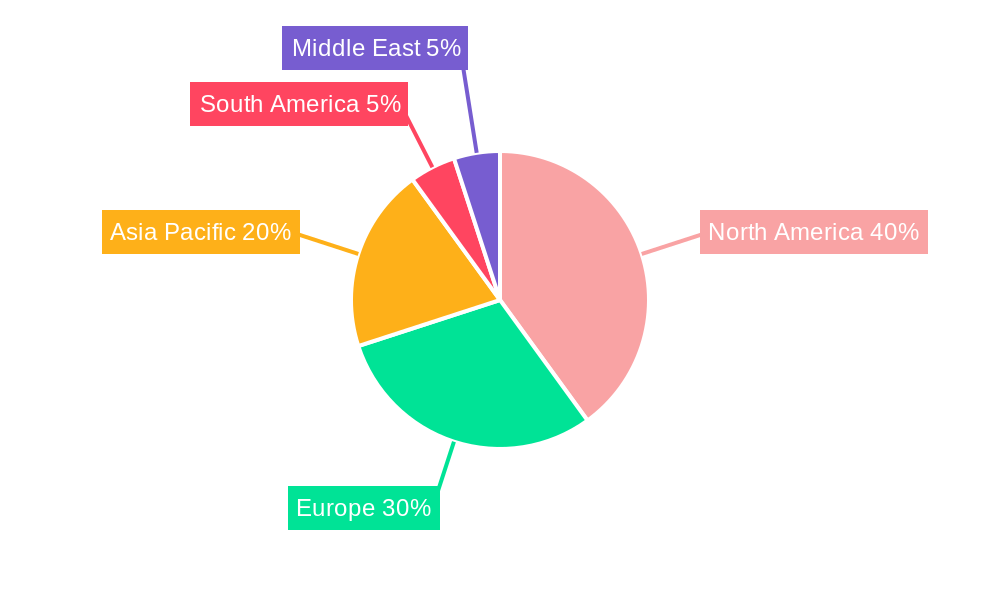
Dominant Regions, Countries, or Segments in Cruise Tourism Market
North America consistently holds the largest market share in the global cruise tourism market, driven by strong domestic demand and a large base of affluent travelers. Europe follows closely, with significant contributions from the Mediterranean region. Within the segment analysis, the 20-39 age group shows the highest growth potential, followed by the 40-59 age group. Ocean cruises remain the dominant type, yet expedition and theme cruises showcase significant growth opportunities. Cruises lasting 8-14 days are popular, offering a balance between experience and time commitment. Several factors contribute to regional and segmental dominance:
- North America: Large middle-class population, high disposable income, and established cruise infrastructure.
- Europe: Strong tourism infrastructure, diverse destinations, and popularity of Mediterranean cruises.
- Asia-Pacific: Emerging market with high growth potential driven by increasing disposable income and tourism development.
- Passenger Age: 20-39 years age group shows the highest growth potential due to increased disposable income.
- Cruise Type: Ocean cruises remain dominant, with expedition and theme cruises emerging rapidly.
- Cruise Duration: 8-14 days cruises maintain popularity.
Cruise Tourism Market Product Landscape
The cruise tourism market offers a diverse range of products, from budget-friendly options to luxurious mega-ships catering to various traveler preferences. Product innovations focus on enhancing onboard experiences, incorporating sustainable technologies, and offering unique itineraries. These innovations include virtual reality experiences, enhanced dining options, and exclusive shore excursions. Performance metrics center around customer satisfaction, occupancy rates, and operational efficiency. Unique selling propositions often revolve around themed cruises, destination-specific experiences, and personalized service. Technological advancements lead to improvements in navigation, safety, and environmental sustainability.
Key Drivers, Barriers & Challenges in Cruise Tourism Market
Key Drivers: The market's expansion is fueled by several factors: rising disposable incomes and increased leisure time, a growing desire for unique and immersive travel experiences, and continuous technological innovation within the cruise industry. Supportive government initiatives promoting tourism in various regions further contribute to positive market momentum.
Challenges & Restraints: The cruise tourism market faces several headwinds. Fluctuating fuel prices and geopolitical instability impacting travel routes pose significant operational challenges. Environmental concerns, including pollution from cruise ships and waste management, are increasingly prominent, leading to stricter regulations and higher operational costs. The lingering effects of the COVID-19 pandemic and potential economic downturns present ongoing operational risks. Intense competition also puts pressure on profit margins. The negative environmental impact of cruises can deter environmentally conscious travelers, further emphasizing the need for sustainable practices.
Emerging Opportunities in Cruise Tourism Market
Untapped markets in emerging economies, particularly in Asia-Pacific, present significant growth potential. The increasing demand for sustainable and eco-friendly cruise options creates opportunities for companies investing in green technologies. Personalized travel experiences, incorporating augmented reality and artificial intelligence, cater to individual preferences and create unique travel encounters. Niche cruise offerings, like adventure cruises and wellness-focused itineraries, tap into specific traveler segments.
Growth Accelerators in the Cruise Tourism Market Industry
Strategic collaborations, exemplified by partnerships like the one between TravClan and Resorts World Cruises, are expanding market reach and diversifying service offerings. Technological breakthroughs in ship design, automation, and onboard services are enhancing operational efficiency and the overall passenger experience. Expansion into new, untapped markets and the diversification of cruise itineraries and offerings are crucial for long-term, sustainable growth within the industry.
Key Players Shaping the Cruise Tourism Market Market
- Princess Cruises
- Carnival Corporation & Plc
- Norwegian Cruise Line Holdings Ltd
- Royal Caribbean Group
- Celebrity Cruises
- Costa Cruises
- Holland America Line
- MSC Cruises
- Disney Cruise Line
- Cunard Line
- …List Not Exhaustive
Notable Milestones in Cruise Tourism Market Sector
- November 2023: TravClan and Resorts World Cruises partnered to revolutionize cruise tourism in India, focusing on accessibility and affordability.
- October 2023: Traveltek and Cruise Planners formed a strategic alliance to enhance cruise booking technology nationally.
In-Depth Cruise Tourism Market Market Outlook
The future of the cruise tourism market is promising, driven by sustained growth in key regions, increasing adoption of innovative technologies, and the emergence of new travel trends. Strategic partnerships and investments in sustainable practices will shape the industry's future. The market is projected to expand significantly by 2033, presenting numerous investment opportunities for businesses with a focus on innovation, sustainability, and customer experience.
Cruise Tourism Market Segmentation
-
1. Type
- 1.1. River Cruise
- 1.2. Ocean Cruise
- 1.3. Expedition Cruise
- 1.4. Theme Cruise
- 1.5. Adventure Cruise
- 1.6. Others
-
2. Duration
- 2.1. 1-7Days
- 2.2. 8-14 Days
- 2.3. 15-20 Days
- 2.4. More than 21 Days
-
3. Passenger Age
- 3.1. Less than 12 years
- 3.2. 13-19 Years
- 3.3. 20-39 Years
- 3.4. 40-59 Years
- 3.5. Above 60 Years
Cruise Tourism Market Segmentation By Geography
-
1. North America
- 1.1. US
- 1.2. Canada
- 1.3. Mexico
- 1.4. Rest of North America
-
2. Europe
- 2.1. Germany
- 2.2. UK
- 2.3. France
- 2.4. Russia
- 2.5. Spain
- 2.6. Rest of Europe
-
3. Asia Pacific
- 3.1. India
- 3.2. China
- 3.3. Japan
- 3.4. Rest of Asia Pacific
-
4. South America
- 4.1. Brazil
- 4.2. Argentina
- 4.3. Rest of South America
-
5. Middle East
- 5.1. UAE
- 5.2. Saudi Arabia
- 5.3. Rest of Middle East
Cruise Tourism Market Regional Market Share
Geographic Coverage of Cruise Tourism Market
Cruise Tourism Market REPORT HIGHLIGHTS
| Aspects | Details |
|---|---|
| Study Period | 2020-2034 |
| Base Year | 2025 |
| Estimated Year | 2026 |
| Forecast Period | 2026-2034 |
| Historical Period | 2020-2025 |
| Growth Rate | CAGR of 8.67% from 2020-2034 |
| Segmentation |
|
Table of Contents
- 1. Introduction
- 1.1. Research Scope
- 1.2. Market Segmentation
- 1.3. Research Objective
- 1.4. Definitions and Assumptions
- 2. Executive Summary
- 2.1. Market Snapshot
- 3. Market Dynamics
- 3.1. Market Drivers
- 3.2. Market Restrains
- 3.3. Market Trends
- 3.4. Market Opportunities
- 4. Market Factor Analysis
- 4.1. Porters Five Forces
- 4.1.1. Bargaining Power of Suppliers
- 4.1.2. Bargaining Power of Buyers
- 4.1.3. Threat of New Entrants
- 4.1.4. Threat of Substitutes
- 4.1.5. Competitive Rivalry
- 4.2. PESTEL analysis
- 4.3. BCG Analysis
- 4.3.1. Stars (High Growth, High Market Share)
- 4.3.2. Cash Cows (Low Growth, High Market Share)
- 4.3.3. Question Mark (High Growth, Low Market Share)
- 4.3.4. Dogs (Low Growth, Low Market Share)
- 4.4. Ansoff Matrix Analysis
- 4.5. Supply Chain Analysis
- 4.6. Regulatory Landscape
- 4.7. Current Market Potential and Opportunity Assessment (TAM–SAM–SOM Framework)
- 4.8. IMR Analyst Note
- 4.1. Porters Five Forces
- 5. Market Analysis, Insights and Forecast 2021-2033
- 5.1. Market Analysis, Insights and Forecast - by Type
- 5.1.1. River Cruise
- 5.1.2. Ocean Cruise
- 5.1.3. Expedition Cruise
- 5.1.4. Theme Cruise
- 5.1.5. Adventure Cruise
- 5.1.6. Others
- 5.2. Market Analysis, Insights and Forecast - by Duration
- 5.2.1. 1-7Days
- 5.2.2. 8-14 Days
- 5.2.3. 15-20 Days
- 5.2.4. More than 21 Days
- 5.3. Market Analysis, Insights and Forecast - by Passenger Age
- 5.3.1. Less than 12 years
- 5.3.2. 13-19 Years
- 5.3.3. 20-39 Years
- 5.3.4. 40-59 Years
- 5.3.5. Above 60 Years
- 5.4. Market Analysis, Insights and Forecast - by Region
- 5.4.1. North America
- 5.4.2. Europe
- 5.4.3. Asia Pacific
- 5.4.4. South America
- 5.4.5. Middle East
- 5.1. Market Analysis, Insights and Forecast - by Type
- 6. Global Cruise Tourism Market Analysis, Insights and Forecast, 2021-2033
- 6.1. Market Analysis, Insights and Forecast - by Type
- 6.1.1. River Cruise
- 6.1.2. Ocean Cruise
- 6.1.3. Expedition Cruise
- 6.1.4. Theme Cruise
- 6.1.5. Adventure Cruise
- 6.1.6. Others
- 6.2. Market Analysis, Insights and Forecast - by Duration
- 6.2.1. 1-7Days
- 6.2.2. 8-14 Days
- 6.2.3. 15-20 Days
- 6.2.4. More than 21 Days
- 6.3. Market Analysis, Insights and Forecast - by Passenger Age
- 6.3.1. Less than 12 years
- 6.3.2. 13-19 Years
- 6.3.3. 20-39 Years
- 6.3.4. 40-59 Years
- 6.3.5. Above 60 Years
- 6.1. Market Analysis, Insights and Forecast - by Type
- 7. North America Cruise Tourism Market Analysis, Insights and Forecast, 2020-2032
- 7.1. Market Analysis, Insights and Forecast - by Type
- 7.1.1. River Cruise
- 7.1.2. Ocean Cruise
- 7.1.3. Expedition Cruise
- 7.1.4. Theme Cruise
- 7.1.5. Adventure Cruise
- 7.1.6. Others
- 7.2. Market Analysis, Insights and Forecast - by Duration
- 7.2.1. 1-7Days
- 7.2.2. 8-14 Days
- 7.2.3. 15-20 Days
- 7.2.4. More than 21 Days
- 7.3. Market Analysis, Insights and Forecast - by Passenger Age
- 7.3.1. Less than 12 years
- 7.3.2. 13-19 Years
- 7.3.3. 20-39 Years
- 7.3.4. 40-59 Years
- 7.3.5. Above 60 Years
- 7.1. Market Analysis, Insights and Forecast - by Type
- 8. Europe Cruise Tourism Market Analysis, Insights and Forecast, 2020-2032
- 8.1. Market Analysis, Insights and Forecast - by Type
- 8.1.1. River Cruise
- 8.1.2. Ocean Cruise
- 8.1.3. Expedition Cruise
- 8.1.4. Theme Cruise
- 8.1.5. Adventure Cruise
- 8.1.6. Others
- 8.2. Market Analysis, Insights and Forecast - by Duration
- 8.2.1. 1-7Days
- 8.2.2. 8-14 Days
- 8.2.3. 15-20 Days
- 8.2.4. More than 21 Days
- 8.3. Market Analysis, Insights and Forecast - by Passenger Age
- 8.3.1. Less than 12 years
- 8.3.2. 13-19 Years
- 8.3.3. 20-39 Years
- 8.3.4. 40-59 Years
- 8.3.5. Above 60 Years
- 8.1. Market Analysis, Insights and Forecast - by Type
- 9. Asia Pacific Cruise Tourism Market Analysis, Insights and Forecast, 2020-2032
- 9.1. Market Analysis, Insights and Forecast - by Type
- 9.1.1. River Cruise
- 9.1.2. Ocean Cruise
- 9.1.3. Expedition Cruise
- 9.1.4. Theme Cruise
- 9.1.5. Adventure Cruise
- 9.1.6. Others
- 9.2. Market Analysis, Insights and Forecast - by Duration
- 9.2.1. 1-7Days
- 9.2.2. 8-14 Days
- 9.2.3. 15-20 Days
- 9.2.4. More than 21 Days
- 9.3. Market Analysis, Insights and Forecast - by Passenger Age
- 9.3.1. Less than 12 years
- 9.3.2. 13-19 Years
- 9.3.3. 20-39 Years
- 9.3.4. 40-59 Years
- 9.3.5. Above 60 Years
- 9.1. Market Analysis, Insights and Forecast - by Type
- 10. South America Cruise Tourism Market Analysis, Insights and Forecast, 2020-2032
- 10.1. Market Analysis, Insights and Forecast - by Type
- 10.1.1. River Cruise
- 10.1.2. Ocean Cruise
- 10.1.3. Expedition Cruise
- 10.1.4. Theme Cruise
- 10.1.5. Adventure Cruise
- 10.1.6. Others
- 10.2. Market Analysis, Insights and Forecast - by Duration
- 10.2.1. 1-7Days
- 10.2.2. 8-14 Days
- 10.2.3. 15-20 Days
- 10.2.4. More than 21 Days
- 10.3. Market Analysis, Insights and Forecast - by Passenger Age
- 10.3.1. Less than 12 years
- 10.3.2. 13-19 Years
- 10.3.3. 20-39 Years
- 10.3.4. 40-59 Years
- 10.3.5. Above 60 Years
- 10.1. Market Analysis, Insights and Forecast - by Type
- 11. Middle East Cruise Tourism Market Analysis, Insights and Forecast, 2020-2032
- 11.1. Market Analysis, Insights and Forecast - by Type
- 11.1.1. River Cruise
- 11.1.2. Ocean Cruise
- 11.1.3. Expedition Cruise
- 11.1.4. Theme Cruise
- 11.1.5. Adventure Cruise
- 11.1.6. Others
- 11.2. Market Analysis, Insights and Forecast - by Duration
- 11.2.1. 1-7Days
- 11.2.2. 8-14 Days
- 11.2.3. 15-20 Days
- 11.2.4. More than 21 Days
- 11.3. Market Analysis, Insights and Forecast - by Passenger Age
- 11.3.1. Less than 12 years
- 11.3.2. 13-19 Years
- 11.3.3. 20-39 Years
- 11.3.4. 40-59 Years
- 11.3.5. Above 60 Years
- 11.1. Market Analysis, Insights and Forecast - by Type
- 12. Competitive Analysis
- 12.1. Company Profiles
- 12.1.1 Princess Cruises
- 12.1.1.1. Company Overview
- 12.1.1.2. Products
- 12.1.1.3. Company Financials
- 12.1.1.4. SWOT Analysis
- 12.1.2 Carnival Corporation & Plc
- 12.1.2.1. Company Overview
- 12.1.2.2. Products
- 12.1.2.3. Company Financials
- 12.1.2.4. SWOT Analysis
- 12.1.3 Norwegian Cruise Line Holdings Ltd
- 12.1.3.1. Company Overview
- 12.1.3.2. Products
- 12.1.3.3. Company Financials
- 12.1.3.4. SWOT Analysis
- 12.1.4 Royal Caribbean Group
- 12.1.4.1. Company Overview
- 12.1.4.2. Products
- 12.1.4.3. Company Financials
- 12.1.4.4. SWOT Analysis
- 12.1.5 Celebrity Cruises
- 12.1.5.1. Company Overview
- 12.1.5.2. Products
- 12.1.5.3. Company Financials
- 12.1.5.4. SWOT Analysis
- 12.1.6 Costa Cruises
- 12.1.6.1. Company Overview
- 12.1.6.2. Products
- 12.1.6.3. Company Financials
- 12.1.6.4. SWOT Analysis
- 12.1.7 Holland America Line
- 12.1.7.1. Company Overview
- 12.1.7.2. Products
- 12.1.7.3. Company Financials
- 12.1.7.4. SWOT Analysis
- 12.1.8 MSC Cruises
- 12.1.8.1. Company Overview
- 12.1.8.2. Products
- 12.1.8.3. Company Financials
- 12.1.8.4. SWOT Analysis
- 12.1.9 Disney Cruise Line
- 12.1.9.1. Company Overview
- 12.1.9.2. Products
- 12.1.9.3. Company Financials
- 12.1.9.4. SWOT Analysis
- 12.1.10 Cunard Line**List Not Exhaustive
- 12.1.10.1. Company Overview
- 12.1.10.2. Products
- 12.1.10.3. Company Financials
- 12.1.10.4. SWOT Analysis
- 12.1.1 Princess Cruises
- 12.2. Market Entropy
- 12.2.1 Company's Key Areas Served
- 12.2.2 Recent Developments
- 12.3. Company Market Share Analysis 2025
- 12.3.1 Top 5 Companies Market Share Analysis
- 12.3.2 Top 3 Companies Market Share Analysis
- 12.4. List of Potential Customers
- 13. Research Methodology
List of Figures
- Figure 1: Global Cruise Tourism Market Revenue Breakdown (Million, %) by Region 2025 & 2033
- Figure 2: North America Cruise Tourism Market Revenue (Million), by Type 2025 & 2033
- Figure 3: North America Cruise Tourism Market Revenue Share (%), by Type 2025 & 2033
- Figure 4: North America Cruise Tourism Market Revenue (Million), by Duration 2025 & 2033
- Figure 5: North America Cruise Tourism Market Revenue Share (%), by Duration 2025 & 2033
- Figure 6: North America Cruise Tourism Market Revenue (Million), by Passenger Age 2025 & 2033
- Figure 7: North America Cruise Tourism Market Revenue Share (%), by Passenger Age 2025 & 2033
- Figure 8: North America Cruise Tourism Market Revenue (Million), by Country 2025 & 2033
- Figure 9: North America Cruise Tourism Market Revenue Share (%), by Country 2025 & 2033
- Figure 10: Europe Cruise Tourism Market Revenue (Million), by Type 2025 & 2033
- Figure 11: Europe Cruise Tourism Market Revenue Share (%), by Type 2025 & 2033
- Figure 12: Europe Cruise Tourism Market Revenue (Million), by Duration 2025 & 2033
- Figure 13: Europe Cruise Tourism Market Revenue Share (%), by Duration 2025 & 2033
- Figure 14: Europe Cruise Tourism Market Revenue (Million), by Passenger Age 2025 & 2033
- Figure 15: Europe Cruise Tourism Market Revenue Share (%), by Passenger Age 2025 & 2033
- Figure 16: Europe Cruise Tourism Market Revenue (Million), by Country 2025 & 2033
- Figure 17: Europe Cruise Tourism Market Revenue Share (%), by Country 2025 & 2033
- Figure 18: Asia Pacific Cruise Tourism Market Revenue (Million), by Type 2025 & 2033
- Figure 19: Asia Pacific Cruise Tourism Market Revenue Share (%), by Type 2025 & 2033
- Figure 20: Asia Pacific Cruise Tourism Market Revenue (Million), by Duration 2025 & 2033
- Figure 21: Asia Pacific Cruise Tourism Market Revenue Share (%), by Duration 2025 & 2033
- Figure 22: Asia Pacific Cruise Tourism Market Revenue (Million), by Passenger Age 2025 & 2033
- Figure 23: Asia Pacific Cruise Tourism Market Revenue Share (%), by Passenger Age 2025 & 2033
- Figure 24: Asia Pacific Cruise Tourism Market Revenue (Million), by Country 2025 & 2033
- Figure 25: Asia Pacific Cruise Tourism Market Revenue Share (%), by Country 2025 & 2033
- Figure 26: South America Cruise Tourism Market Revenue (Million), by Type 2025 & 2033
- Figure 27: South America Cruise Tourism Market Revenue Share (%), by Type 2025 & 2033
- Figure 28: South America Cruise Tourism Market Revenue (Million), by Duration 2025 & 2033
- Figure 29: South America Cruise Tourism Market Revenue Share (%), by Duration 2025 & 2033
- Figure 30: South America Cruise Tourism Market Revenue (Million), by Passenger Age 2025 & 2033
- Figure 31: South America Cruise Tourism Market Revenue Share (%), by Passenger Age 2025 & 2033
- Figure 32: South America Cruise Tourism Market Revenue (Million), by Country 2025 & 2033
- Figure 33: South America Cruise Tourism Market Revenue Share (%), by Country 2025 & 2033
- Figure 34: Middle East Cruise Tourism Market Revenue (Million), by Type 2025 & 2033
- Figure 35: Middle East Cruise Tourism Market Revenue Share (%), by Type 2025 & 2033
- Figure 36: Middle East Cruise Tourism Market Revenue (Million), by Duration 2025 & 2033
- Figure 37: Middle East Cruise Tourism Market Revenue Share (%), by Duration 2025 & 2033
- Figure 38: Middle East Cruise Tourism Market Revenue (Million), by Passenger Age 2025 & 2033
- Figure 39: Middle East Cruise Tourism Market Revenue Share (%), by Passenger Age 2025 & 2033
- Figure 40: Middle East Cruise Tourism Market Revenue (Million), by Country 2025 & 2033
- Figure 41: Middle East Cruise Tourism Market Revenue Share (%), by Country 2025 & 2033
List of Tables
- Table 1: Global Cruise Tourism Market Revenue Million Forecast, by Type 2020 & 2033
- Table 2: Global Cruise Tourism Market Revenue Million Forecast, by Duration 2020 & 2033
- Table 3: Global Cruise Tourism Market Revenue Million Forecast, by Passenger Age 2020 & 2033
- Table 4: Global Cruise Tourism Market Revenue Million Forecast, by Region 2020 & 2033
- Table 5: Global Cruise Tourism Market Revenue Million Forecast, by Type 2020 & 2033
- Table 6: Global Cruise Tourism Market Revenue Million Forecast, by Duration 2020 & 2033
- Table 7: Global Cruise Tourism Market Revenue Million Forecast, by Passenger Age 2020 & 2033
- Table 8: Global Cruise Tourism Market Revenue Million Forecast, by Country 2020 & 2033
- Table 9: US Cruise Tourism Market Revenue (Million) Forecast, by Application 2020 & 2033
- Table 10: Canada Cruise Tourism Market Revenue (Million) Forecast, by Application 2020 & 2033
- Table 11: Mexico Cruise Tourism Market Revenue (Million) Forecast, by Application 2020 & 2033
- Table 12: Rest of North America Cruise Tourism Market Revenue (Million) Forecast, by Application 2020 & 2033
- Table 13: Global Cruise Tourism Market Revenue Million Forecast, by Type 2020 & 2033
- Table 14: Global Cruise Tourism Market Revenue Million Forecast, by Duration 2020 & 2033
- Table 15: Global Cruise Tourism Market Revenue Million Forecast, by Passenger Age 2020 & 2033
- Table 16: Global Cruise Tourism Market Revenue Million Forecast, by Country 2020 & 2033
- Table 17: Germany Cruise Tourism Market Revenue (Million) Forecast, by Application 2020 & 2033
- Table 18: UK Cruise Tourism Market Revenue (Million) Forecast, by Application 2020 & 2033
- Table 19: France Cruise Tourism Market Revenue (Million) Forecast, by Application 2020 & 2033
- Table 20: Russia Cruise Tourism Market Revenue (Million) Forecast, by Application 2020 & 2033
- Table 21: Spain Cruise Tourism Market Revenue (Million) Forecast, by Application 2020 & 2033
- Table 22: Rest of Europe Cruise Tourism Market Revenue (Million) Forecast, by Application 2020 & 2033
- Table 23: Global Cruise Tourism Market Revenue Million Forecast, by Type 2020 & 2033
- Table 24: Global Cruise Tourism Market Revenue Million Forecast, by Duration 2020 & 2033
- Table 25: Global Cruise Tourism Market Revenue Million Forecast, by Passenger Age 2020 & 2033
- Table 26: Global Cruise Tourism Market Revenue Million Forecast, by Country 2020 & 2033
- Table 27: India Cruise Tourism Market Revenue (Million) Forecast, by Application 2020 & 2033
- Table 28: China Cruise Tourism Market Revenue (Million) Forecast, by Application 2020 & 2033
- Table 29: Japan Cruise Tourism Market Revenue (Million) Forecast, by Application 2020 & 2033
- Table 30: Rest of Asia Pacific Cruise Tourism Market Revenue (Million) Forecast, by Application 2020 & 2033
- Table 31: Global Cruise Tourism Market Revenue Million Forecast, by Type 2020 & 2033
- Table 32: Global Cruise Tourism Market Revenue Million Forecast, by Duration 2020 & 2033
- Table 33: Global Cruise Tourism Market Revenue Million Forecast, by Passenger Age 2020 & 2033
- Table 34: Global Cruise Tourism Market Revenue Million Forecast, by Country 2020 & 2033
- Table 35: Brazil Cruise Tourism Market Revenue (Million) Forecast, by Application 2020 & 2033
- Table 36: Argentina Cruise Tourism Market Revenue (Million) Forecast, by Application 2020 & 2033
- Table 37: Rest of South America Cruise Tourism Market Revenue (Million) Forecast, by Application 2020 & 2033
- Table 38: Global Cruise Tourism Market Revenue Million Forecast, by Type 2020 & 2033
- Table 39: Global Cruise Tourism Market Revenue Million Forecast, by Duration 2020 & 2033
- Table 40: Global Cruise Tourism Market Revenue Million Forecast, by Passenger Age 2020 & 2033
- Table 41: Global Cruise Tourism Market Revenue Million Forecast, by Country 2020 & 2033
- Table 42: UAE Cruise Tourism Market Revenue (Million) Forecast, by Application 2020 & 2033
- Table 43: Saudi Arabia Cruise Tourism Market Revenue (Million) Forecast, by Application 2020 & 2033
- Table 44: Rest of Middle East Cruise Tourism Market Revenue (Million) Forecast, by Application 2020 & 2033
Frequently Asked Questions
1. What is the projected Compound Annual Growth Rate (CAGR) of the Cruise Tourism Market?
The projected CAGR is approximately 8.67%.
2. Which companies are prominent players in the Cruise Tourism Market?
Key companies in the market include Princess Cruises, Carnival Corporation & Plc, Norwegian Cruise Line Holdings Ltd, Royal Caribbean Group, Celebrity Cruises, Costa Cruises, Holland America Line, MSC Cruises, Disney Cruise Line, Cunard Line**List Not Exhaustive.
3. What are the main segments of the Cruise Tourism Market?
The market segments include Type, Duration, Passenger Age.
4. Can you provide details about the market size?
The market size is estimated to be USD 9.44 Million as of 2022.
5. What are some drivers contributing to market growth?
Increasing Disposable Income is Driving the Market.
6. What are the notable trends driving market growth?
Increase in Number of Ocean Cruise Passengers in North America.
7. Are there any restraints impacting market growth?
High Costs is Restraining the Market.
8. Can you provide examples of recent developments in the market?
November 2023: TravClan and Resorts World Cruises joined forces in a groundbreaking partnership aimed at revolutionizing cruise tourism in India. Through this collaboration, TravClan embarks on a transformative journey that promises to redefine the landscape of cruise vacations in India, ensuring accessibility and affordability for all.
9. What pricing options are available for accessing the report?
Pricing options include single-user, multi-user, and enterprise licenses priced at USD 4750, USD 5250, and USD 8750 respectively.
10. Is the market size provided in terms of value or volume?
The market size is provided in terms of value, measured in Million.
11. Are there any specific market keywords associated with the report?
Yes, the market keyword associated with the report is "Cruise Tourism Market," which aids in identifying and referencing the specific market segment covered.
12. How do I determine which pricing option suits my needs best?
The pricing options vary based on user requirements and access needs. Individual users may opt for single-user licenses, while businesses requiring broader access may choose multi-user or enterprise licenses for cost-effective access to the report.
13. Are there any additional resources or data provided in the Cruise Tourism Market report?
While the report offers comprehensive insights, it's advisable to review the specific contents or supplementary materials provided to ascertain if additional resources or data are available.
14. How can I stay updated on further developments or reports in the Cruise Tourism Market?
To stay informed about further developments, trends, and reports in the Cruise Tourism Market, consider subscribing to industry newsletters, following relevant companies and organizations, or regularly checking reputable industry news sources and publications.
Methodology
Step 1 - Identification of Relevant Samples Size from Population Database


Step 2 - Approaches for Defining Global Market Size (Value, Volume* & Price*)

Note*: In applicable scenarios
Step 3 - Data Sources
Primary Research
- Web Analytics
- Survey Reports
- Research Institute
- Latest Research Reports
- Opinion Leaders
Secondary Research
- Annual Reports
- White Paper
- Latest Press Release
- Industry Association
- Paid Database
- Investor Presentations

Step 4 - Data Triangulation
Involves using different sources of information in order to increase the validity of a study
These sources are likely to be stakeholders in a program - participants, other researchers, program staff, other community members, and so on.
Then we put all data in single framework & apply various statistical tools to find out the dynamic on the market.
During the analysis stage, feedback from the stakeholder groups would be compared to determine areas of agreement as well as areas of divergence