

Key Insights
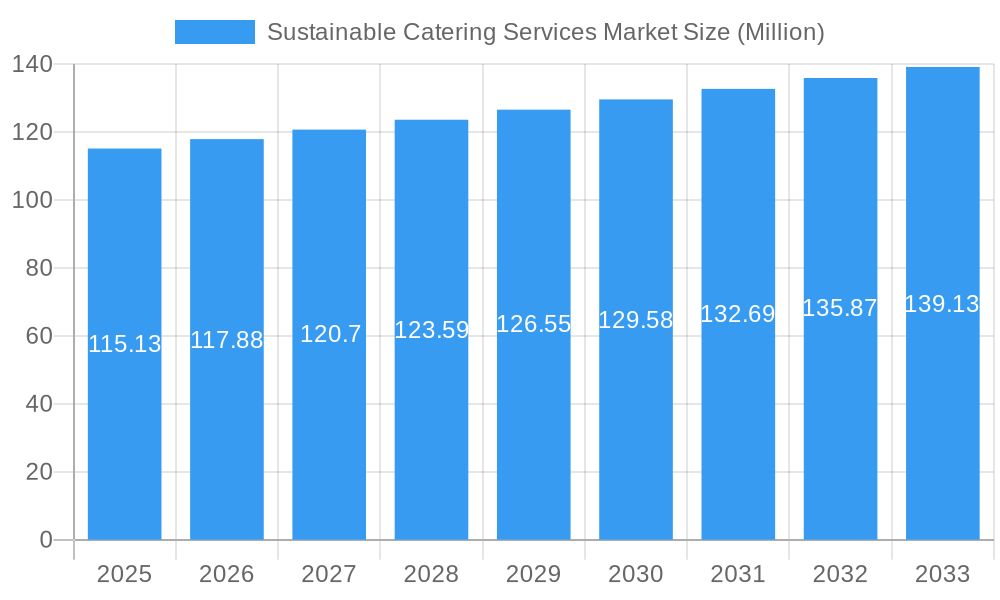
The global sustainable catering services market, valued at $115.13 million in 2025, is projected to experience steady growth, driven by increasing consumer demand for eco-friendly and ethically sourced food. A compound annual growth rate (CAGR) of 2.33% from 2025 to 2033 indicates a market poised for consistent expansion. Key drivers include rising environmental awareness among consumers and businesses, stricter regulations on food waste and sourcing, and a growing preference for plant-based and locally sourced ingredients. The market is segmented by service type (contractual, non-contractual, other), event type (corporate, wedding, social, other), and end-user (individuals, hospitality, educational, healthcare, in-flight, other). The contractual catering segment is expected to dominate due to the increasing adoption of sustainable practices by large corporations and institutions. The growth within the hospitality and corporate event sectors will be particularly significant, driven by the desire to enhance brand image and attract environmentally conscious clients. Geographic expansion is also anticipated, with North America and Europe currently holding significant market shares, while Asia Pacific is expected to witness robust growth fueled by increasing disposable incomes and changing dietary habits. Challenges include the higher costs associated with sustainable sourcing and the need for greater transparency and traceability throughout the supply chain.
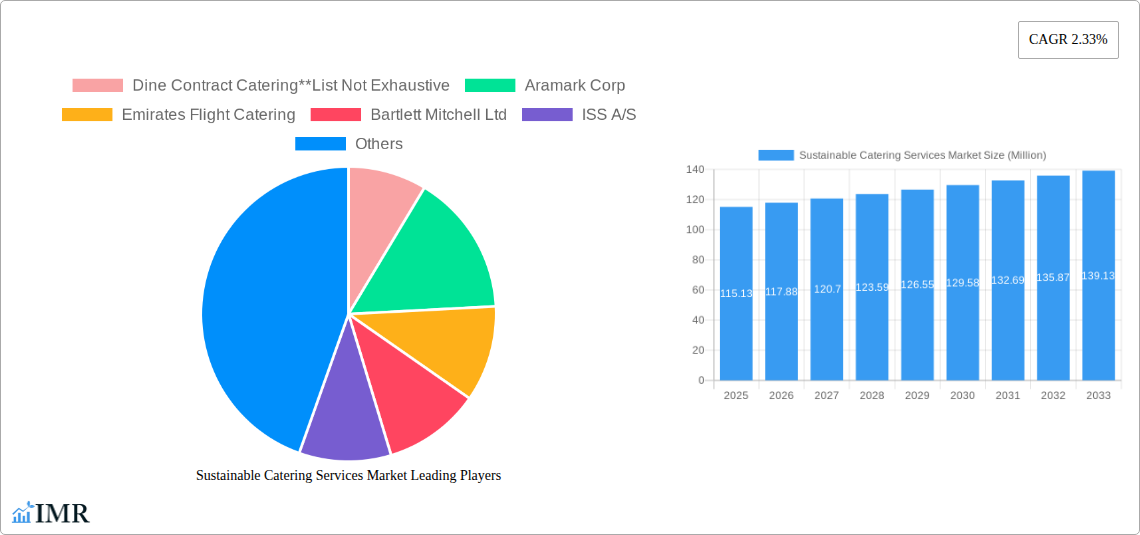
Sustainable Catering Services Market Market Size (In Million)
The competitive landscape comprises both large multinational corporations like Compass Group PLC and Aramark Corp, and smaller, specialized catering companies focusing on sustainable practices. These companies are constantly innovating to meet evolving consumer demands, focusing on reducing carbon footprints, minimizing waste, and promoting ethical labor practices. Successful players will be those that can effectively balance sustainability goals with cost-effectiveness and operational efficiency. Future market growth hinges on continued consumer demand for sustainable options, technological advancements in food waste management and supply chain tracking, and the implementation of supportive government policies and regulations. The market’s expansion will likely see a broadening of service offerings, such as incorporating zero-waste initiatives and incorporating locally sourced, seasonal menus that minimize environmental impact.
Sustainable Catering Services Market Company Market Share
Sustainable Catering Services Market: A Comprehensive Report (2019-2033)
This comprehensive report provides an in-depth analysis of the Sustainable Catering Services Market, encompassing market dynamics, growth trends, regional dominance, product landscape, key players, and future outlook. The study period covers 2019-2033, with 2025 as the base and estimated year. The forecast period spans 2025-2033, and the historical period is 2019-2024. The market is segmented by service type (contractual, non-contractual, other), event type (corporate, wedding, social, others), and end-user (individuals, hospitality, educational, healthcare, in-flight, others). Key players include Dine Contract Catering, Aramark Corp, Emirates Flight Catering, Bartlett Mitchell Ltd, ISS A/S, Elior Group, Entier Limited, Compass Group PLC, DO & CO Aktiengesellschaft, and CH and Co Catering Group Ltd.
Sustainable Catering Services Market Dynamics & Structure
The Sustainable Catering Services Market is characterized by moderate concentration, with a few large players dominating the contractual catering segment. Technological innovations, particularly in food waste reduction and sustainable sourcing, are key drivers. Stringent environmental regulations are shaping market practices, while the rise of plant-based diets and consumer demand for ethical sourcing are impacting product offerings. Competitive substitutes include in-house catering and ready-to-eat meals, presenting challenges. The market demonstrates significant M&A activity, reflecting consolidation and expansion strategies within the sector. The end-user demographic is expanding, fueled by growing awareness of sustainability and corporate social responsibility.
- Market Concentration: Moderately concentrated, with top 5 players holding approximately xx% market share (2024).
- Technological Innovation: Focus on waste reduction technologies, sustainable packaging, and locally sourced ingredients. Barriers include high initial investment costs and limited technological expertise.
- Regulatory Framework: Increasingly stringent environmental regulations driving adoption of sustainable practices. Compliance costs represent a challenge for smaller players.
- Competitive Substitutes: In-house catering and ready-to-eat meals pose a significant challenge.
- M&A Trends: Significant activity in the last 5 years, with an average of xx deals annually, largely driven by consolidation and expansion into new markets. For instance, Compass Group PLC's acquisition of CH&CO in 2024 highlights this trend.
- End-User Demographics: Growing demand from environmentally conscious consumers, corporations with CSR initiatives, and institutions prioritizing sustainability.
Sustainable Catering Services Market Growth Trends & Insights
The Sustainable Catering Services Market experienced robust growth during the historical period (2019-2024), with a CAGR of xx%. This growth is primarily attributable to increasing consumer awareness of environmental issues, stricter regulations, and the rising popularity of plant-based diets. Technological disruptions, such as innovative food waste management systems and sustainable packaging solutions, are further accelerating market expansion. Changing consumer behavior, including a preference for locally sourced and ethically produced food, is also a significant driver. Market penetration is expected to reach xx% by 2033, driven by continued growth across all segments. Adoption rates are highest in the corporate and hospitality sectors, with significant growth potential in the educational and healthcare sectors.
Dominant Regions, Countries, or Segments in Sustainable Catering Services Market
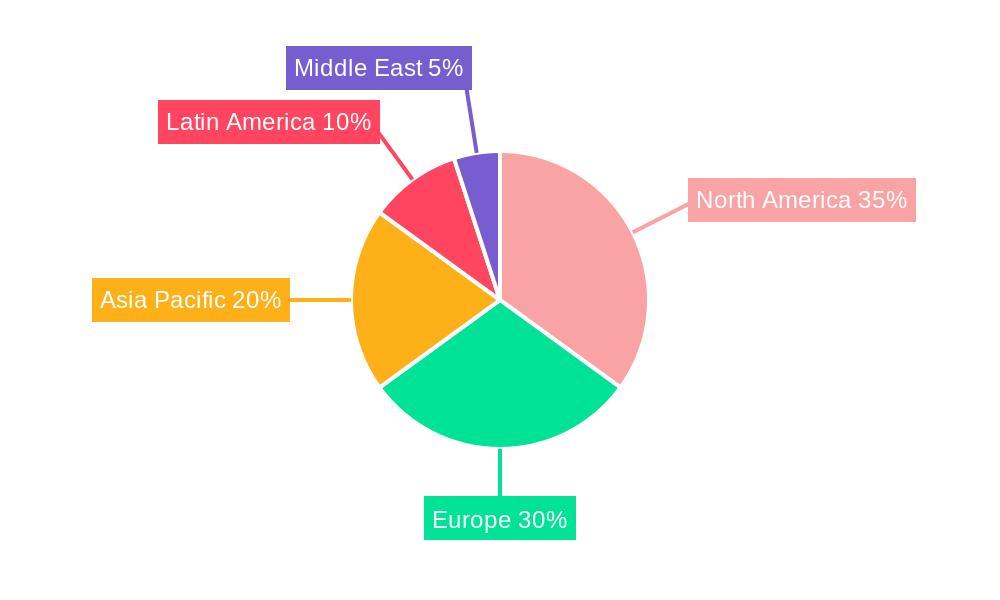
North America and Europe currently dominate the Sustainable Catering Services Market, driven by high consumer awareness and stringent regulations. Within these regions, the contractual catering segment is the largest, followed by the non-contractual segment. The corporate event type exhibits the highest growth, reflecting the increasing focus on sustainability within the corporate sector.
- Leading Region: North America, followed by Europe.
- Key Drivers: Stringent environmental regulations in North America and Europe, high consumer demand for sustainable options, and robust corporate social responsibility initiatives.
- Market Share: North America holds an estimated xx% market share in 2025, while Europe accounts for approximately xx%.
- Growth Potential: Significant potential in Asia-Pacific driven by rising disposable incomes and increasing awareness of sustainable practices. The in-flight catering segment shows the largest future growth.
Sustainable Catering Services Market Product Landscape
The market offers a range of sustainable catering services, focusing on locally sourced ingredients, reduced food waste, compostable packaging, and plant-based options. Product innovations include advanced food waste management systems, smart catering solutions that optimize resource utilization, and the development of sustainable menus tailored to specific dietary needs and preferences. The emphasis is on creating unique selling propositions that highlight environmental responsibility and enhance the customer experience.
Key Drivers, Barriers & Challenges in Sustainable Catering Services Market
Key Drivers:
- Growing consumer demand for sustainable and ethical food options.
- Increasing regulatory pressure to reduce environmental impact.
- Corporate social responsibility initiatives promoting sustainable practices.
Key Challenges:
- Higher costs associated with sustainable ingredients and practices. This impact is estimated to increase prices by xx% compared to traditional catering.
- Difficulty in ensuring consistent supply chain sustainability. Issues include securing reliable sources of certified organic produce and managing transportation logistics.
- Competition from traditional catering companies that do not prioritize sustainability.
Emerging Opportunities in Sustainable Catering Services Market
- Untapped potential in emerging markets with growing demand for sustainable food.
- Expansion into new event types, such as festivals and conferences, that align with sustainable values.
- Development of innovative technologies, such as AI-powered meal planning to minimize waste.
Growth Accelerators in the Sustainable Catering Services Market Industry
Technological advancements in areas such as food waste management, sustainable packaging, and ingredient sourcing are accelerating market growth. Strategic partnerships with sustainable food producers and suppliers are creating new opportunities. Expansion into untapped market segments, such as the healthcare and educational sectors, is contributing to market expansion.
Key Players Shaping the Sustainable Catering Services Market Market
- Dine Contract Catering (if link available, otherwise use list element)
- Aramark Corp
- Emirates Flight Catering
- Bartlett Mitchell Ltd
- ISS A/S
- Elior Group
- Entier Limited
- Compass Group PLC
- DO & CO Aktiengesellschaft
- CH and Co Catering Group Ltd
Notable Milestones in Sustainable Catering Services Market Sector
- January 2024: Compass Group PLC acquired CH&CO for USD 600 Million, expanding its sustainable offerings.
- May 2023: Aramark partnered with Bean Sprouts, enhancing its child-focused sustainable menu options.
In-Depth Sustainable Catering Services Market Market Outlook
The Sustainable Catering Services Market is poised for significant growth over the forecast period (2025-2033), driven by continued consumer demand, technological innovations, and supportive government policies. Strategic opportunities lie in expanding into new market segments, developing innovative products and services, and establishing strong supply chain partnerships that ensure sustainability throughout the value chain. The market is expected to reach a value of xx Million by 2033.
Sustainable Catering Services Market Segmentation
-
1. Service Type
- 1.1. Contractual Catering Services
- 1.2. Non-Contractual Catering Services
- 1.3. Other Catering Services
-
2. Event Type
- 2.1. Corporate
- 2.2. Wedding
- 2.3. Social Events
- 2.4. Others
-
3. End-User
- 3.1. Individuals
- 3.2. Hospitality
- 3.3. Educational
- 3.4. Healthcare
- 3.5. In-Flight
- 3.6. Other End Users
- 4. Geography
-
5. North America
- 5.1. United States
- 5.2. Canada
- 5.3. Mexico
- 5.4. Rest of North America
-
6. Europe
- 6.1. United Kingdom
- 6.2. Germany
- 6.3. France
- 6.4. Russia
- 6.5. Italy
- 6.6. Spain
- 6.7. Rest of Europe
-
7. Asia-Pacific
- 7.1. India
- 7.2. China
- 7.3. Japan
- 7.4. Australia
- 7.5. Rest of Asia-Pacific
-
8. South America
- 8.1. Brazil
- 8.2. Argentina
- 8.3. Rest of South America
-
9. Middle-East and Africa
- 9.1. United Arab Emirates
- 9.2. South Africa
- 9.3. Rest of Middle-East and Africa
Sustainable Catering Services Market Segmentation By Geography
-
1. North America
- 1.1. United States
- 1.2. Canada
- 1.3. Mexico
-
2. South America
- 2.1. Brazil
- 2.2. Argentina
- 2.3. Rest of South America
-
3. Europe
- 3.1. United Kingdom
- 3.2. Germany
- 3.3. France
- 3.4. Italy
- 3.5. Spain
- 3.6. Russia
- 3.7. Benelux
- 3.8. Nordics
- 3.9. Rest of Europe
-
4. Middle East & Africa
- 4.1. Turkey
- 4.2. Israel
- 4.3. GCC
- 4.4. North Africa
- 4.5. South Africa
- 4.6. Rest of Middle East & Africa
-
5. Asia Pacific
- 5.1. China
- 5.2. India
- 5.3. Japan
- 5.4. South Korea
- 5.5. ASEAN
- 5.6. Oceania
- 5.7. Rest of Asia Pacific
Sustainable Catering Services Market Regional Market Share
Geographic Coverage of Sustainable Catering Services Market
Sustainable Catering Services Market REPORT HIGHLIGHTS
| Aspects | Details |
|---|---|
| Study Period | 2020-2034 |
| Base Year | 2025 |
| Estimated Year | 2026 |
| Forecast Period | 2026-2034 |
| Historical Period | 2020-2025 |
| Growth Rate | CAGR of 2.33% from 2020-2034 |
| Segmentation |
|
Table of Contents
- 1. Introduction
- 1.1. Research Scope
- 1.2. Market Segmentation
- 1.3. Research Objective
- 1.4. Definitions and Assumptions
- 2. Executive Summary
- 2.1. Market Snapshot
- 3. Market Dynamics
- 3.1. Market Drivers
- 3.2. Market Restrains
- 3.3. Market Trends
- 3.4. Market Opportunities
- 4. Market Factor Analysis
- 4.1. Porters Five Forces
- 4.1.1. Bargaining Power of Suppliers
- 4.1.2. Bargaining Power of Buyers
- 4.1.3. Threat of New Entrants
- 4.1.4. Threat of Substitutes
- 4.1.5. Competitive Rivalry
- 4.2. PESTEL analysis
- 4.3. BCG Analysis
- 4.3.1. Stars (High Growth, High Market Share)
- 4.3.2. Cash Cows (Low Growth, High Market Share)
- 4.3.3. Question Mark (High Growth, Low Market Share)
- 4.3.4. Dogs (Low Growth, Low Market Share)
- 4.4. Ansoff Matrix Analysis
- 4.5. Supply Chain Analysis
- 4.6. Regulatory Landscape
- 4.7. Current Market Potential and Opportunity Assessment (TAM–SAM–SOM Framework)
- 4.8. IMR Analyst Note
- 4.1. Porters Five Forces
- 5. Market Analysis, Insights and Forecast 2021-2033
- 5.1. Market Analysis, Insights and Forecast - by Service Type
- 5.1.1. Contractual Catering Services
- 5.1.2. Non-Contractual Catering Services
- 5.1.3. Other Catering Services
- 5.2. Market Analysis, Insights and Forecast - by Event Type
- 5.2.1. Corporate
- 5.2.2. Wedding
- 5.2.3. Social Events
- 5.2.4. Others
- 5.3. Market Analysis, Insights and Forecast - by End-User
- 5.3.1. Individuals
- 5.3.2. Hospitality
- 5.3.3. Educational
- 5.3.4. Healthcare
- 5.3.5. In-Flight
- 5.3.6. Other End Users
- 5.4. Market Analysis, Insights and Forecast - by Geography
- 5.5. Market Analysis, Insights and Forecast - by North America
- 5.5.1. United States
- 5.5.2. Canada
- 5.5.3. Mexico
- 5.5.4. Rest of North America
- 5.6. Market Analysis, Insights and Forecast - by Europe
- 5.6.1. United Kingdom
- 5.6.2. Germany
- 5.6.3. France
- 5.6.4. Russia
- 5.6.5. Italy
- 5.6.6. Spain
- 5.6.7. Rest of Europe
- 5.7. Market Analysis, Insights and Forecast - by Asia-Pacific
- 5.7.1. India
- 5.7.2. China
- 5.7.3. Japan
- 5.7.4. Australia
- 5.7.5. Rest of Asia-Pacific
- 5.8. Market Analysis, Insights and Forecast - by South America
- 5.8.1. Brazil
- 5.8.2. Argentina
- 5.8.3. Rest of South America
- 5.9. Market Analysis, Insights and Forecast - by Middle-East and Africa
- 5.9.1. United Arab Emirates
- 5.9.2. South Africa
- 5.9.3. Rest of Middle-East and Africa
- 5.10. Market Analysis, Insights and Forecast - by Region
- 5.10.1. North America
- 5.10.2. South America
- 5.10.3. Europe
- 5.10.4. Middle East & Africa
- 5.10.5. Asia Pacific
- 5.1. Market Analysis, Insights and Forecast - by Service Type
- 6. Global Sustainable Catering Services Market Analysis, Insights and Forecast, 2021-2033
- 6.1. Market Analysis, Insights and Forecast - by Service Type
- 6.1.1. Contractual Catering Services
- 6.1.2. Non-Contractual Catering Services
- 6.1.3. Other Catering Services
- 6.2. Market Analysis, Insights and Forecast - by Event Type
- 6.2.1. Corporate
- 6.2.2. Wedding
- 6.2.3. Social Events
- 6.2.4. Others
- 6.3. Market Analysis, Insights and Forecast - by End-User
- 6.3.1. Individuals
- 6.3.2. Hospitality
- 6.3.3. Educational
- 6.3.4. Healthcare
- 6.3.5. In-Flight
- 6.3.6. Other End Users
- 6.4. Market Analysis, Insights and Forecast - by Geography
- 6.5. Market Analysis, Insights and Forecast - by North America
- 6.5.1. United States
- 6.5.2. Canada
- 6.5.3. Mexico
- 6.5.4. Rest of North America
- 6.6. Market Analysis, Insights and Forecast - by Europe
- 6.6.1. United Kingdom
- 6.6.2. Germany
- 6.6.3. France
- 6.6.4. Russia
- 6.6.5. Italy
- 6.6.6. Spain
- 6.6.7. Rest of Europe
- 6.7. Market Analysis, Insights and Forecast - by Asia-Pacific
- 6.7.1. India
- 6.7.2. China
- 6.7.3. Japan
- 6.7.4. Australia
- 6.7.5. Rest of Asia-Pacific
- 6.8. Market Analysis, Insights and Forecast - by South America
- 6.8.1. Brazil
- 6.8.2. Argentina
- 6.8.3. Rest of South America
- 6.9. Market Analysis, Insights and Forecast - by Middle-East and Africa
- 6.9.1. United Arab Emirates
- 6.9.2. South Africa
- 6.9.3. Rest of Middle-East and Africa
- 6.1. Market Analysis, Insights and Forecast - by Service Type
- 7. North America Sustainable Catering Services Market Analysis, Insights and Forecast, 2020-2032
- 7.1. Market Analysis, Insights and Forecast - by Service Type
- 7.1.1. Contractual Catering Services
- 7.1.2. Non-Contractual Catering Services
- 7.1.3. Other Catering Services
- 7.2. Market Analysis, Insights and Forecast - by Event Type
- 7.2.1. Corporate
- 7.2.2. Wedding
- 7.2.3. Social Events
- 7.2.4. Others
- 7.3. Market Analysis, Insights and Forecast - by End-User
- 7.3.1. Individuals
- 7.3.2. Hospitality
- 7.3.3. Educational
- 7.3.4. Healthcare
- 7.3.5. In-Flight
- 7.3.6. Other End Users
- 7.4. Market Analysis, Insights and Forecast - by Geography
- 7.5. Market Analysis, Insights and Forecast - by North America
- 7.5.1. United States
- 7.5.2. Canada
- 7.5.3. Mexico
- 7.5.4. Rest of North America
- 7.6. Market Analysis, Insights and Forecast - by Europe
- 7.6.1. United Kingdom
- 7.6.2. Germany
- 7.6.3. France
- 7.6.4. Russia
- 7.6.5. Italy
- 7.6.6. Spain
- 7.6.7. Rest of Europe
- 7.7. Market Analysis, Insights and Forecast - by Asia-Pacific
- 7.7.1. India
- 7.7.2. China
- 7.7.3. Japan
- 7.7.4. Australia
- 7.7.5. Rest of Asia-Pacific
- 7.8. Market Analysis, Insights and Forecast - by South America
- 7.8.1. Brazil
- 7.8.2. Argentina
- 7.8.3. Rest of South America
- 7.9. Market Analysis, Insights and Forecast - by Middle-East and Africa
- 7.9.1. United Arab Emirates
- 7.9.2. South Africa
- 7.9.3. Rest of Middle-East and Africa
- 7.1. Market Analysis, Insights and Forecast - by Service Type
- 8. South America Sustainable Catering Services Market Analysis, Insights and Forecast, 2020-2032
- 8.1. Market Analysis, Insights and Forecast - by Service Type
- 8.1.1. Contractual Catering Services
- 8.1.2. Non-Contractual Catering Services
- 8.1.3. Other Catering Services
- 8.2. Market Analysis, Insights and Forecast - by Event Type
- 8.2.1. Corporate
- 8.2.2. Wedding
- 8.2.3. Social Events
- 8.2.4. Others
- 8.3. Market Analysis, Insights and Forecast - by End-User
- 8.3.1. Individuals
- 8.3.2. Hospitality
- 8.3.3. Educational
- 8.3.4. Healthcare
- 8.3.5. In-Flight
- 8.3.6. Other End Users
- 8.4. Market Analysis, Insights and Forecast - by Geography
- 8.5. Market Analysis, Insights and Forecast - by North America
- 8.5.1. United States
- 8.5.2. Canada
- 8.5.3. Mexico
- 8.5.4. Rest of North America
- 8.6. Market Analysis, Insights and Forecast - by Europe
- 8.6.1. United Kingdom
- 8.6.2. Germany
- 8.6.3. France
- 8.6.4. Russia
- 8.6.5. Italy
- 8.6.6. Spain
- 8.6.7. Rest of Europe
- 8.7. Market Analysis, Insights and Forecast - by Asia-Pacific
- 8.7.1. India
- 8.7.2. China
- 8.7.3. Japan
- 8.7.4. Australia
- 8.7.5. Rest of Asia-Pacific
- 8.8. Market Analysis, Insights and Forecast - by South America
- 8.8.1. Brazil
- 8.8.2. Argentina
- 8.8.3. Rest of South America
- 8.9. Market Analysis, Insights and Forecast - by Middle-East and Africa
- 8.9.1. United Arab Emirates
- 8.9.2. South Africa
- 8.9.3. Rest of Middle-East and Africa
- 8.1. Market Analysis, Insights and Forecast - by Service Type
- 9. Europe Sustainable Catering Services Market Analysis, Insights and Forecast, 2020-2032
- 9.1. Market Analysis, Insights and Forecast - by Service Type
- 9.1.1. Contractual Catering Services
- 9.1.2. Non-Contractual Catering Services
- 9.1.3. Other Catering Services
- 9.2. Market Analysis, Insights and Forecast - by Event Type
- 9.2.1. Corporate
- 9.2.2. Wedding
- 9.2.3. Social Events
- 9.2.4. Others
- 9.3. Market Analysis, Insights and Forecast - by End-User
- 9.3.1. Individuals
- 9.3.2. Hospitality
- 9.3.3. Educational
- 9.3.4. Healthcare
- 9.3.5. In-Flight
- 9.3.6. Other End Users
- 9.4. Market Analysis, Insights and Forecast - by Geography
- 9.5. Market Analysis, Insights and Forecast - by North America
- 9.5.1. United States
- 9.5.2. Canada
- 9.5.3. Mexico
- 9.5.4. Rest of North America
- 9.6. Market Analysis, Insights and Forecast - by Europe
- 9.6.1. United Kingdom
- 9.6.2. Germany
- 9.6.3. France
- 9.6.4. Russia
- 9.6.5. Italy
- 9.6.6. Spain
- 9.6.7. Rest of Europe
- 9.7. Market Analysis, Insights and Forecast - by Asia-Pacific
- 9.7.1. India
- 9.7.2. China
- 9.7.3. Japan
- 9.7.4. Australia
- 9.7.5. Rest of Asia-Pacific
- 9.8. Market Analysis, Insights and Forecast - by South America
- 9.8.1. Brazil
- 9.8.2. Argentina
- 9.8.3. Rest of South America
- 9.9. Market Analysis, Insights and Forecast - by Middle-East and Africa
- 9.9.1. United Arab Emirates
- 9.9.2. South Africa
- 9.9.3. Rest of Middle-East and Africa
- 9.1. Market Analysis, Insights and Forecast - by Service Type
- 10. Middle East & Africa Sustainable Catering Services Market Analysis, Insights and Forecast, 2020-2032
- 10.1. Market Analysis, Insights and Forecast - by Service Type
- 10.1.1. Contractual Catering Services
- 10.1.2. Non-Contractual Catering Services
- 10.1.3. Other Catering Services
- 10.2. Market Analysis, Insights and Forecast - by Event Type
- 10.2.1. Corporate
- 10.2.2. Wedding
- 10.2.3. Social Events
- 10.2.4. Others
- 10.3. Market Analysis, Insights and Forecast - by End-User
- 10.3.1. Individuals
- 10.3.2. Hospitality
- 10.3.3. Educational
- 10.3.4. Healthcare
- 10.3.5. In-Flight
- 10.3.6. Other End Users
- 10.4. Market Analysis, Insights and Forecast - by Geography
- 10.5. Market Analysis, Insights and Forecast - by North America
- 10.5.1. United States
- 10.5.2. Canada
- 10.5.3. Mexico
- 10.5.4. Rest of North America
- 10.6. Market Analysis, Insights and Forecast - by Europe
- 10.6.1. United Kingdom
- 10.6.2. Germany
- 10.6.3. France
- 10.6.4. Russia
- 10.6.5. Italy
- 10.6.6. Spain
- 10.6.7. Rest of Europe
- 10.7. Market Analysis, Insights and Forecast - by Asia-Pacific
- 10.7.1. India
- 10.7.2. China
- 10.7.3. Japan
- 10.7.4. Australia
- 10.7.5. Rest of Asia-Pacific
- 10.8. Market Analysis, Insights and Forecast - by South America
- 10.8.1. Brazil
- 10.8.2. Argentina
- 10.8.3. Rest of South America
- 10.9. Market Analysis, Insights and Forecast - by Middle-East and Africa
- 10.9.1. United Arab Emirates
- 10.9.2. South Africa
- 10.9.3. Rest of Middle-East and Africa
- 10.1. Market Analysis, Insights and Forecast - by Service Type
- 11. Asia Pacific Sustainable Catering Services Market Analysis, Insights and Forecast, 2020-2032
- 11.1. Market Analysis, Insights and Forecast - by Service Type
- 11.1.1. Contractual Catering Services
- 11.1.2. Non-Contractual Catering Services
- 11.1.3. Other Catering Services
- 11.2. Market Analysis, Insights and Forecast - by Event Type
- 11.2.1. Corporate
- 11.2.2. Wedding
- 11.2.3. Social Events
- 11.2.4. Others
- 11.3. Market Analysis, Insights and Forecast - by End-User
- 11.3.1. Individuals
- 11.3.2. Hospitality
- 11.3.3. Educational
- 11.3.4. Healthcare
- 11.3.5. In-Flight
- 11.3.6. Other End Users
- 11.4. Market Analysis, Insights and Forecast - by Geography
- 11.5. Market Analysis, Insights and Forecast - by North America
- 11.5.1. United States
- 11.5.2. Canada
- 11.5.3. Mexico
- 11.5.4. Rest of North America
- 11.6. Market Analysis, Insights and Forecast - by Europe
- 11.6.1. United Kingdom
- 11.6.2. Germany
- 11.6.3. France
- 11.6.4. Russia
- 11.6.5. Italy
- 11.6.6. Spain
- 11.6.7. Rest of Europe
- 11.7. Market Analysis, Insights and Forecast - by Asia-Pacific
- 11.7.1. India
- 11.7.2. China
- 11.7.3. Japan
- 11.7.4. Australia
- 11.7.5. Rest of Asia-Pacific
- 11.8. Market Analysis, Insights and Forecast - by South America
- 11.8.1. Brazil
- 11.8.2. Argentina
- 11.8.3. Rest of South America
- 11.9. Market Analysis, Insights and Forecast - by Middle-East and Africa
- 11.9.1. United Arab Emirates
- 11.9.2. South Africa
- 11.9.3. Rest of Middle-East and Africa
- 11.1. Market Analysis, Insights and Forecast - by Service Type
- 12. Competitive Analysis
- 12.1. Company Profiles
- 12.1.1 Dine Contract Catering**List Not Exhaustive
- 12.1.1.1. Company Overview
- 12.1.1.2. Products
- 12.1.1.3. Company Financials
- 12.1.1.4. SWOT Analysis
- 12.1.2 Aramark Corp
- 12.1.2.1. Company Overview
- 12.1.2.2. Products
- 12.1.2.3. Company Financials
- 12.1.2.4. SWOT Analysis
- 12.1.3 Emirates Flight Catering
- 12.1.3.1. Company Overview
- 12.1.3.2. Products
- 12.1.3.3. Company Financials
- 12.1.3.4. SWOT Analysis
- 12.1.4 Bartlett Mitchell Ltd
- 12.1.4.1. Company Overview
- 12.1.4.2. Products
- 12.1.4.3. Company Financials
- 12.1.4.4. SWOT Analysis
- 12.1.5 ISS A/S
- 12.1.5.1. Company Overview
- 12.1.5.2. Products
- 12.1.5.3. Company Financials
- 12.1.5.4. SWOT Analysis
- 12.1.6 Elior Group
- 12.1.6.1. Company Overview
- 12.1.6.2. Products
- 12.1.6.3. Company Financials
- 12.1.6.4. SWOT Analysis
- 12.1.7 Entier Limited
- 12.1.7.1. Company Overview
- 12.1.7.2. Products
- 12.1.7.3. Company Financials
- 12.1.7.4. SWOT Analysis
- 12.1.8 Compass Group PLC
- 12.1.8.1. Company Overview
- 12.1.8.2. Products
- 12.1.8.3. Company Financials
- 12.1.8.4. SWOT Analysis
- 12.1.9 DO & CO Aktiengesellschaft
- 12.1.9.1. Company Overview
- 12.1.9.2. Products
- 12.1.9.3. Company Financials
- 12.1.9.4. SWOT Analysis
- 12.1.10 CH and Co Catering Group Ltd
- 12.1.10.1. Company Overview
- 12.1.10.2. Products
- 12.1.10.3. Company Financials
- 12.1.10.4. SWOT Analysis
- 12.1.1 Dine Contract Catering**List Not Exhaustive
- 12.2. Market Entropy
- 12.2.1 Company's Key Areas Served
- 12.2.2 Recent Developments
- 12.3. Company Market Share Analysis 2025
- 12.3.1 Top 5 Companies Market Share Analysis
- 12.3.2 Top 3 Companies Market Share Analysis
- 12.4. List of Potential Customers
- 13. Research Methodology
List of Figures
- Figure 1: Global Sustainable Catering Services Market Revenue Breakdown (Million, %) by Region 2025 & 2033
- Figure 2: North America Sustainable Catering Services Market Revenue (Million), by Service Type 2025 & 2033
- Figure 3: North America Sustainable Catering Services Market Revenue Share (%), by Service Type 2025 & 2033
- Figure 4: North America Sustainable Catering Services Market Revenue (Million), by Event Type 2025 & 2033
- Figure 5: North America Sustainable Catering Services Market Revenue Share (%), by Event Type 2025 & 2033
- Figure 6: North America Sustainable Catering Services Market Revenue (Million), by End-User 2025 & 2033
- Figure 7: North America Sustainable Catering Services Market Revenue Share (%), by End-User 2025 & 2033
- Figure 8: North America Sustainable Catering Services Market Revenue (Million), by Geography 2025 & 2033
- Figure 9: North America Sustainable Catering Services Market Revenue Share (%), by Geography 2025 & 2033
- Figure 10: North America Sustainable Catering Services Market Revenue (Million), by North America 2025 & 2033
- Figure 11: North America Sustainable Catering Services Market Revenue Share (%), by North America 2025 & 2033
- Figure 12: North America Sustainable Catering Services Market Revenue (Million), by Europe 2025 & 2033
- Figure 13: North America Sustainable Catering Services Market Revenue Share (%), by Europe 2025 & 2033
- Figure 14: North America Sustainable Catering Services Market Revenue (Million), by Asia-Pacific 2025 & 2033
- Figure 15: North America Sustainable Catering Services Market Revenue Share (%), by Asia-Pacific 2025 & 2033
- Figure 16: North America Sustainable Catering Services Market Revenue (Million), by South America 2025 & 2033
- Figure 17: North America Sustainable Catering Services Market Revenue Share (%), by South America 2025 & 2033
- Figure 18: North America Sustainable Catering Services Market Revenue (Million), by Middle-East and Africa 2025 & 2033
- Figure 19: North America Sustainable Catering Services Market Revenue Share (%), by Middle-East and Africa 2025 & 2033
- Figure 20: North America Sustainable Catering Services Market Revenue (Million), by Country 2025 & 2033
- Figure 21: North America Sustainable Catering Services Market Revenue Share (%), by Country 2025 & 2033
- Figure 22: South America Sustainable Catering Services Market Revenue (Million), by Service Type 2025 & 2033
- Figure 23: South America Sustainable Catering Services Market Revenue Share (%), by Service Type 2025 & 2033
- Figure 24: South America Sustainable Catering Services Market Revenue (Million), by Event Type 2025 & 2033
- Figure 25: South America Sustainable Catering Services Market Revenue Share (%), by Event Type 2025 & 2033
- Figure 26: South America Sustainable Catering Services Market Revenue (Million), by End-User 2025 & 2033
- Figure 27: South America Sustainable Catering Services Market Revenue Share (%), by End-User 2025 & 2033
- Figure 28: South America Sustainable Catering Services Market Revenue (Million), by Geography 2025 & 2033
- Figure 29: South America Sustainable Catering Services Market Revenue Share (%), by Geography 2025 & 2033
- Figure 30: South America Sustainable Catering Services Market Revenue (Million), by North America 2025 & 2033
- Figure 31: South America Sustainable Catering Services Market Revenue Share (%), by North America 2025 & 2033
- Figure 32: South America Sustainable Catering Services Market Revenue (Million), by Europe 2025 & 2033
- Figure 33: South America Sustainable Catering Services Market Revenue Share (%), by Europe 2025 & 2033
- Figure 34: South America Sustainable Catering Services Market Revenue (Million), by Asia-Pacific 2025 & 2033
- Figure 35: South America Sustainable Catering Services Market Revenue Share (%), by Asia-Pacific 2025 & 2033
- Figure 36: South America Sustainable Catering Services Market Revenue (Million), by South America 2025 & 2033
- Figure 37: South America Sustainable Catering Services Market Revenue Share (%), by South America 2025 & 2033
- Figure 38: South America Sustainable Catering Services Market Revenue (Million), by Middle-East and Africa 2025 & 2033
- Figure 39: South America Sustainable Catering Services Market Revenue Share (%), by Middle-East and Africa 2025 & 2033
- Figure 40: South America Sustainable Catering Services Market Revenue (Million), by Country 2025 & 2033
- Figure 41: South America Sustainable Catering Services Market Revenue Share (%), by Country 2025 & 2033
- Figure 42: Europe Sustainable Catering Services Market Revenue (Million), by Service Type 2025 & 2033
- Figure 43: Europe Sustainable Catering Services Market Revenue Share (%), by Service Type 2025 & 2033
- Figure 44: Europe Sustainable Catering Services Market Revenue (Million), by Event Type 2025 & 2033
- Figure 45: Europe Sustainable Catering Services Market Revenue Share (%), by Event Type 2025 & 2033
- Figure 46: Europe Sustainable Catering Services Market Revenue (Million), by End-User 2025 & 2033
- Figure 47: Europe Sustainable Catering Services Market Revenue Share (%), by End-User 2025 & 2033
- Figure 48: Europe Sustainable Catering Services Market Revenue (Million), by Geography 2025 & 2033
- Figure 49: Europe Sustainable Catering Services Market Revenue Share (%), by Geography 2025 & 2033
- Figure 50: Europe Sustainable Catering Services Market Revenue (Million), by North America 2025 & 2033
- Figure 51: Europe Sustainable Catering Services Market Revenue Share (%), by North America 2025 & 2033
- Figure 52: Europe Sustainable Catering Services Market Revenue (Million), by Europe 2025 & 2033
- Figure 53: Europe Sustainable Catering Services Market Revenue Share (%), by Europe 2025 & 2033
- Figure 54: Europe Sustainable Catering Services Market Revenue (Million), by Asia-Pacific 2025 & 2033
- Figure 55: Europe Sustainable Catering Services Market Revenue Share (%), by Asia-Pacific 2025 & 2033
- Figure 56: Europe Sustainable Catering Services Market Revenue (Million), by South America 2025 & 2033
- Figure 57: Europe Sustainable Catering Services Market Revenue Share (%), by South America 2025 & 2033
- Figure 58: Europe Sustainable Catering Services Market Revenue (Million), by Middle-East and Africa 2025 & 2033
- Figure 59: Europe Sustainable Catering Services Market Revenue Share (%), by Middle-East and Africa 2025 & 2033
- Figure 60: Europe Sustainable Catering Services Market Revenue (Million), by Country 2025 & 2033
- Figure 61: Europe Sustainable Catering Services Market Revenue Share (%), by Country 2025 & 2033
- Figure 62: Middle East & Africa Sustainable Catering Services Market Revenue (Million), by Service Type 2025 & 2033
- Figure 63: Middle East & Africa Sustainable Catering Services Market Revenue Share (%), by Service Type 2025 & 2033
- Figure 64: Middle East & Africa Sustainable Catering Services Market Revenue (Million), by Event Type 2025 & 2033
- Figure 65: Middle East & Africa Sustainable Catering Services Market Revenue Share (%), by Event Type 2025 & 2033
- Figure 66: Middle East & Africa Sustainable Catering Services Market Revenue (Million), by End-User 2025 & 2033
- Figure 67: Middle East & Africa Sustainable Catering Services Market Revenue Share (%), by End-User 2025 & 2033
- Figure 68: Middle East & Africa Sustainable Catering Services Market Revenue (Million), by Geography 2025 & 2033
- Figure 69: Middle East & Africa Sustainable Catering Services Market Revenue Share (%), by Geography 2025 & 2033
- Figure 70: Middle East & Africa Sustainable Catering Services Market Revenue (Million), by North America 2025 & 2033
- Figure 71: Middle East & Africa Sustainable Catering Services Market Revenue Share (%), by North America 2025 & 2033
- Figure 72: Middle East & Africa Sustainable Catering Services Market Revenue (Million), by Europe 2025 & 2033
- Figure 73: Middle East & Africa Sustainable Catering Services Market Revenue Share (%), by Europe 2025 & 2033
- Figure 74: Middle East & Africa Sustainable Catering Services Market Revenue (Million), by Asia-Pacific 2025 & 2033
- Figure 75: Middle East & Africa Sustainable Catering Services Market Revenue Share (%), by Asia-Pacific 2025 & 2033
- Figure 76: Middle East & Africa Sustainable Catering Services Market Revenue (Million), by South America 2025 & 2033
- Figure 77: Middle East & Africa Sustainable Catering Services Market Revenue Share (%), by South America 2025 & 2033
- Figure 78: Middle East & Africa Sustainable Catering Services Market Revenue (Million), by Middle-East and Africa 2025 & 2033
- Figure 79: Middle East & Africa Sustainable Catering Services Market Revenue Share (%), by Middle-East and Africa 2025 & 2033
- Figure 80: Middle East & Africa Sustainable Catering Services Market Revenue (Million), by Country 2025 & 2033
- Figure 81: Middle East & Africa Sustainable Catering Services Market Revenue Share (%), by Country 2025 & 2033
- Figure 82: Asia Pacific Sustainable Catering Services Market Revenue (Million), by Service Type 2025 & 2033
- Figure 83: Asia Pacific Sustainable Catering Services Market Revenue Share (%), by Service Type 2025 & 2033
- Figure 84: Asia Pacific Sustainable Catering Services Market Revenue (Million), by Event Type 2025 & 2033
- Figure 85: Asia Pacific Sustainable Catering Services Market Revenue Share (%), by Event Type 2025 & 2033
- Figure 86: Asia Pacific Sustainable Catering Services Market Revenue (Million), by End-User 2025 & 2033
- Figure 87: Asia Pacific Sustainable Catering Services Market Revenue Share (%), by End-User 2025 & 2033
- Figure 88: Asia Pacific Sustainable Catering Services Market Revenue (Million), by Geography 2025 & 2033
- Figure 89: Asia Pacific Sustainable Catering Services Market Revenue Share (%), by Geography 2025 & 2033
- Figure 90: Asia Pacific Sustainable Catering Services Market Revenue (Million), by North America 2025 & 2033
- Figure 91: Asia Pacific Sustainable Catering Services Market Revenue Share (%), by North America 2025 & 2033
- Figure 92: Asia Pacific Sustainable Catering Services Market Revenue (Million), by Europe 2025 & 2033
- Figure 93: Asia Pacific Sustainable Catering Services Market Revenue Share (%), by Europe 2025 & 2033
- Figure 94: Asia Pacific Sustainable Catering Services Market Revenue (Million), by Asia-Pacific 2025 & 2033
- Figure 95: Asia Pacific Sustainable Catering Services Market Revenue Share (%), by Asia-Pacific 2025 & 2033
- Figure 96: Asia Pacific Sustainable Catering Services Market Revenue (Million), by South America 2025 & 2033
- Figure 97: Asia Pacific Sustainable Catering Services Market Revenue Share (%), by South America 2025 & 2033
- Figure 98: Asia Pacific Sustainable Catering Services Market Revenue (Million), by Middle-East and Africa 2025 & 2033
- Figure 99: Asia Pacific Sustainable Catering Services Market Revenue Share (%), by Middle-East and Africa 2025 & 2033
- Figure 100: Asia Pacific Sustainable Catering Services Market Revenue (Million), by Country 2025 & 2033
- Figure 101: Asia Pacific Sustainable Catering Services Market Revenue Share (%), by Country 2025 & 2033
List of Tables
- Table 1: Global Sustainable Catering Services Market Revenue Million Forecast, by Service Type 2020 & 2033
- Table 2: Global Sustainable Catering Services Market Revenue Million Forecast, by Event Type 2020 & 2033
- Table 3: Global Sustainable Catering Services Market Revenue Million Forecast, by End-User 2020 & 2033
- Table 4: Global Sustainable Catering Services Market Revenue Million Forecast, by Geography 2020 & 2033
- Table 5: Global Sustainable Catering Services Market Revenue Million Forecast, by North America 2020 & 2033
- Table 6: Global Sustainable Catering Services Market Revenue Million Forecast, by Europe 2020 & 2033
- Table 7: Global Sustainable Catering Services Market Revenue Million Forecast, by Asia-Pacific 2020 & 2033
- Table 8: Global Sustainable Catering Services Market Revenue Million Forecast, by South America 2020 & 2033
- Table 9: Global Sustainable Catering Services Market Revenue Million Forecast, by Middle-East and Africa 2020 & 2033
- Table 10: Global Sustainable Catering Services Market Revenue Million Forecast, by Region 2020 & 2033
- Table 11: Global Sustainable Catering Services Market Revenue Million Forecast, by Service Type 2020 & 2033
- Table 12: Global Sustainable Catering Services Market Revenue Million Forecast, by Event Type 2020 & 2033
- Table 13: Global Sustainable Catering Services Market Revenue Million Forecast, by End-User 2020 & 2033
- Table 14: Global Sustainable Catering Services Market Revenue Million Forecast, by Geography 2020 & 2033
- Table 15: Global Sustainable Catering Services Market Revenue Million Forecast, by North America 2020 & 2033
- Table 16: Global Sustainable Catering Services Market Revenue Million Forecast, by Europe 2020 & 2033
- Table 17: Global Sustainable Catering Services Market Revenue Million Forecast, by Asia-Pacific 2020 & 2033
- Table 18: Global Sustainable Catering Services Market Revenue Million Forecast, by South America 2020 & 2033
- Table 19: Global Sustainable Catering Services Market Revenue Million Forecast, by Middle-East and Africa 2020 & 2033
- Table 20: Global Sustainable Catering Services Market Revenue Million Forecast, by Country 2020 & 2033
- Table 21: United States Sustainable Catering Services Market Revenue (Million) Forecast, by Application 2020 & 2033
- Table 22: Canada Sustainable Catering Services Market Revenue (Million) Forecast, by Application 2020 & 2033
- Table 23: Mexico Sustainable Catering Services Market Revenue (Million) Forecast, by Application 2020 & 2033
- Table 24: Global Sustainable Catering Services Market Revenue Million Forecast, by Service Type 2020 & 2033
- Table 25: Global Sustainable Catering Services Market Revenue Million Forecast, by Event Type 2020 & 2033
- Table 26: Global Sustainable Catering Services Market Revenue Million Forecast, by End-User 2020 & 2033
- Table 27: Global Sustainable Catering Services Market Revenue Million Forecast, by Geography 2020 & 2033
- Table 28: Global Sustainable Catering Services Market Revenue Million Forecast, by North America 2020 & 2033
- Table 29: Global Sustainable Catering Services Market Revenue Million Forecast, by Europe 2020 & 2033
- Table 30: Global Sustainable Catering Services Market Revenue Million Forecast, by Asia-Pacific 2020 & 2033
- Table 31: Global Sustainable Catering Services Market Revenue Million Forecast, by South America 2020 & 2033
- Table 32: Global Sustainable Catering Services Market Revenue Million Forecast, by Middle-East and Africa 2020 & 2033
- Table 33: Global Sustainable Catering Services Market Revenue Million Forecast, by Country 2020 & 2033
- Table 34: Brazil Sustainable Catering Services Market Revenue (Million) Forecast, by Application 2020 & 2033
- Table 35: Argentina Sustainable Catering Services Market Revenue (Million) Forecast, by Application 2020 & 2033
- Table 36: Rest of South America Sustainable Catering Services Market Revenue (Million) Forecast, by Application 2020 & 2033
- Table 37: Global Sustainable Catering Services Market Revenue Million Forecast, by Service Type 2020 & 2033
- Table 38: Global Sustainable Catering Services Market Revenue Million Forecast, by Event Type 2020 & 2033
- Table 39: Global Sustainable Catering Services Market Revenue Million Forecast, by End-User 2020 & 2033
- Table 40: Global Sustainable Catering Services Market Revenue Million Forecast, by Geography 2020 & 2033
- Table 41: Global Sustainable Catering Services Market Revenue Million Forecast, by North America 2020 & 2033
- Table 42: Global Sustainable Catering Services Market Revenue Million Forecast, by Europe 2020 & 2033
- Table 43: Global Sustainable Catering Services Market Revenue Million Forecast, by Asia-Pacific 2020 & 2033
- Table 44: Global Sustainable Catering Services Market Revenue Million Forecast, by South America 2020 & 2033
- Table 45: Global Sustainable Catering Services Market Revenue Million Forecast, by Middle-East and Africa 2020 & 2033
- Table 46: Global Sustainable Catering Services Market Revenue Million Forecast, by Country 2020 & 2033
- Table 47: United Kingdom Sustainable Catering Services Market Revenue (Million) Forecast, by Application 2020 & 2033
- Table 48: Germany Sustainable Catering Services Market Revenue (Million) Forecast, by Application 2020 & 2033
- Table 49: France Sustainable Catering Services Market Revenue (Million) Forecast, by Application 2020 & 2033
- Table 50: Italy Sustainable Catering Services Market Revenue (Million) Forecast, by Application 2020 & 2033
- Table 51: Spain Sustainable Catering Services Market Revenue (Million) Forecast, by Application 2020 & 2033
- Table 52: Russia Sustainable Catering Services Market Revenue (Million) Forecast, by Application 2020 & 2033
- Table 53: Benelux Sustainable Catering Services Market Revenue (Million) Forecast, by Application 2020 & 2033
- Table 54: Nordics Sustainable Catering Services Market Revenue (Million) Forecast, by Application 2020 & 2033
- Table 55: Rest of Europe Sustainable Catering Services Market Revenue (Million) Forecast, by Application 2020 & 2033
- Table 56: Global Sustainable Catering Services Market Revenue Million Forecast, by Service Type 2020 & 2033
- Table 57: Global Sustainable Catering Services Market Revenue Million Forecast, by Event Type 2020 & 2033
- Table 58: Global Sustainable Catering Services Market Revenue Million Forecast, by End-User 2020 & 2033
- Table 59: Global Sustainable Catering Services Market Revenue Million Forecast, by Geography 2020 & 2033
- Table 60: Global Sustainable Catering Services Market Revenue Million Forecast, by North America 2020 & 2033
- Table 61: Global Sustainable Catering Services Market Revenue Million Forecast, by Europe 2020 & 2033
- Table 62: Global Sustainable Catering Services Market Revenue Million Forecast, by Asia-Pacific 2020 & 2033
- Table 63: Global Sustainable Catering Services Market Revenue Million Forecast, by South America 2020 & 2033
- Table 64: Global Sustainable Catering Services Market Revenue Million Forecast, by Middle-East and Africa 2020 & 2033
- Table 65: Global Sustainable Catering Services Market Revenue Million Forecast, by Country 2020 & 2033
- Table 66: Turkey Sustainable Catering Services Market Revenue (Million) Forecast, by Application 2020 & 2033
- Table 67: Israel Sustainable Catering Services Market Revenue (Million) Forecast, by Application 2020 & 2033
- Table 68: GCC Sustainable Catering Services Market Revenue (Million) Forecast, by Application 2020 & 2033
- Table 69: North Africa Sustainable Catering Services Market Revenue (Million) Forecast, by Application 2020 & 2033
- Table 70: South Africa Sustainable Catering Services Market Revenue (Million) Forecast, by Application 2020 & 2033
- Table 71: Rest of Middle East & Africa Sustainable Catering Services Market Revenue (Million) Forecast, by Application 2020 & 2033
- Table 72: Global Sustainable Catering Services Market Revenue Million Forecast, by Service Type 2020 & 2033
- Table 73: Global Sustainable Catering Services Market Revenue Million Forecast, by Event Type 2020 & 2033
- Table 74: Global Sustainable Catering Services Market Revenue Million Forecast, by End-User 2020 & 2033
- Table 75: Global Sustainable Catering Services Market Revenue Million Forecast, by Geography 2020 & 2033
- Table 76: Global Sustainable Catering Services Market Revenue Million Forecast, by North America 2020 & 2033
- Table 77: Global Sustainable Catering Services Market Revenue Million Forecast, by Europe 2020 & 2033
- Table 78: Global Sustainable Catering Services Market Revenue Million Forecast, by Asia-Pacific 2020 & 2033
- Table 79: Global Sustainable Catering Services Market Revenue Million Forecast, by South America 2020 & 2033
- Table 80: Global Sustainable Catering Services Market Revenue Million Forecast, by Middle-East and Africa 2020 & 2033
- Table 81: Global Sustainable Catering Services Market Revenue Million Forecast, by Country 2020 & 2033
- Table 82: China Sustainable Catering Services Market Revenue (Million) Forecast, by Application 2020 & 2033
- Table 83: India Sustainable Catering Services Market Revenue (Million) Forecast, by Application 2020 & 2033
- Table 84: Japan Sustainable Catering Services Market Revenue (Million) Forecast, by Application 2020 & 2033
- Table 85: South Korea Sustainable Catering Services Market Revenue (Million) Forecast, by Application 2020 & 2033
- Table 86: ASEAN Sustainable Catering Services Market Revenue (Million) Forecast, by Application 2020 & 2033
- Table 87: Oceania Sustainable Catering Services Market Revenue (Million) Forecast, by Application 2020 & 2033
- Table 88: Rest of Asia Pacific Sustainable Catering Services Market Revenue (Million) Forecast, by Application 2020 & 2033
Frequently Asked Questions
1. What is the projected Compound Annual Growth Rate (CAGR) of the Sustainable Catering Services Market?
The projected CAGR is approximately 2.33%.
2. Which companies are prominent players in the Sustainable Catering Services Market?
Key companies in the market include Dine Contract Catering**List Not Exhaustive, Aramark Corp, Emirates Flight Catering, Bartlett Mitchell Ltd, ISS A/S, Elior Group, Entier Limited, Compass Group PLC, DO & CO Aktiengesellschaft, CH and Co Catering Group Ltd.
3. What are the main segments of the Sustainable Catering Services Market?
The market segments include Service Type, Event Type, End-User, Geography, North America, Europe, Asia-Pacific, South America, Middle-East and Africa.
4. Can you provide details about the market size?
The market size is estimated to be USD 115.13 Million as of 2022.
5. What are some drivers contributing to market growth?
Increasing Trend of Outsourcing Food Services; Growing Popularity of Social Events.
6. What are the notable trends driving market growth?
Rise in Demand for Organic Food.
7. Are there any restraints impacting market growth?
Challenges in Sourcing Organic and Local Ingredients; Limited Consumer Awareness and Understanding of Sustainable Catering Practices.
8. Can you provide examples of recent developments in the market?
In January 2024, Compass Group PLC, a leading global food service company, acquired CH&CO, a premium contract and hospitality service provider in the UK and Ireland, for an initial enterprise value of GBP 475 Million (USD 600 Million).
9. What pricing options are available for accessing the report?
Pricing options include single-user, multi-user, and enterprise licenses priced at USD 3800, USD 4500, and USD 5800 respectively.
10. Is the market size provided in terms of value or volume?
The market size is provided in terms of value, measured in Million.
11. Are there any specific market keywords associated with the report?
Yes, the market keyword associated with the report is "Sustainable Catering Services Market," which aids in identifying and referencing the specific market segment covered.
12. How do I determine which pricing option suits my needs best?
The pricing options vary based on user requirements and access needs. Individual users may opt for single-user licenses, while businesses requiring broader access may choose multi-user or enterprise licenses for cost-effective access to the report.
13. Are there any additional resources or data provided in the Sustainable Catering Services Market report?
While the report offers comprehensive insights, it's advisable to review the specific contents or supplementary materials provided to ascertain if additional resources or data are available.
14. How can I stay updated on further developments or reports in the Sustainable Catering Services Market?
To stay informed about further developments, trends, and reports in the Sustainable Catering Services Market, consider subscribing to industry newsletters, following relevant companies and organizations, or regularly checking reputable industry news sources and publications.
Methodology
Step 1 - Identification of Relevant Samples Size from Population Database


Step 2 - Approaches for Defining Global Market Size (Value, Volume* & Price*)

Note*: In applicable scenarios
Step 3 - Data Sources
Primary Research
- Web Analytics
- Survey Reports
- Research Institute
- Latest Research Reports
- Opinion Leaders
Secondary Research
- Annual Reports
- White Paper
- Latest Press Release
- Industry Association
- Paid Database
- Investor Presentations

Step 4 - Data Triangulation
Involves using different sources of information in order to increase the validity of a study
These sources are likely to be stakeholders in a program - participants, other researchers, program staff, other community members, and so on.
Then we put all data in single framework & apply various statistical tools to find out the dynamic on the market.
During the analysis stage, feedback from the stakeholder groups would be compared to determine areas of agreement as well as areas of divergence