

Key Insights
The global non-residential accommodation market, currently experiencing robust growth with a CAGR exceeding 12%, is poised for significant expansion throughout the forecast period (2025-2033). This growth is fueled by several key factors. The burgeoning business travel sector, driven by increasing globalization and international trade, significantly contributes to demand. Furthermore, the leisure travel market continues its upward trajectory, with travelers increasingly seeking diverse and unique accommodation options beyond traditional hotels. The rise of online travel agencies (OTAs) and the increasing adoption of online booking platforms have streamlined the booking process, making it easier and more convenient for travelers to access a wider range of non-residential accommodations. Segmentation within the market is dynamic, with vacation rentals experiencing particularly strong growth due to the preference for larger spaces and more personalized experiences, especially among families and groups. While economic fluctuations and potential travel restrictions could act as restraints, the overall market outlook remains positive, supported by the continuous development of innovative accommodation types and the expansion of the travel and tourism sector.
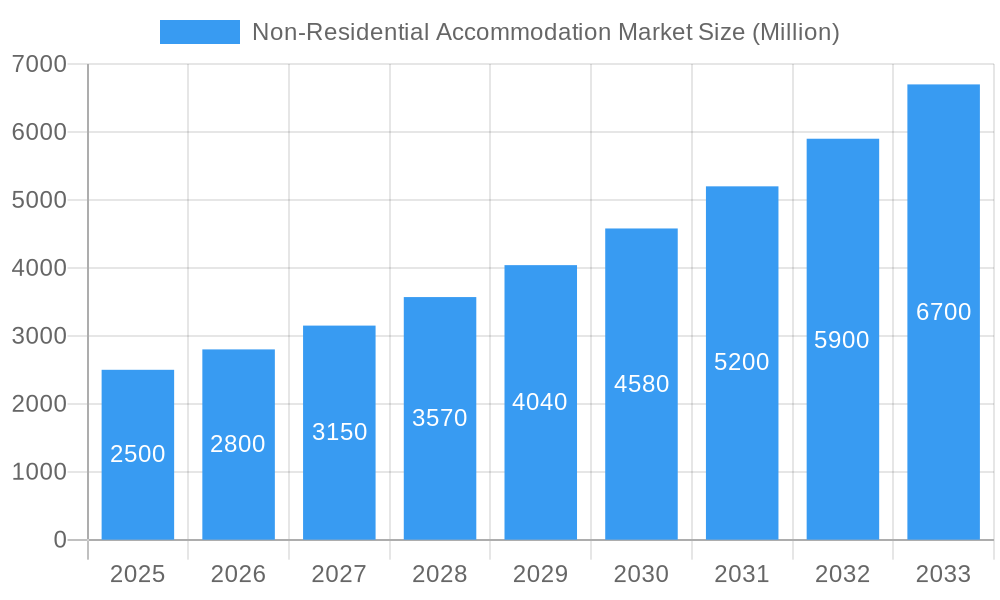
Non-Residential Accommodation Market Market Size (In Billion)
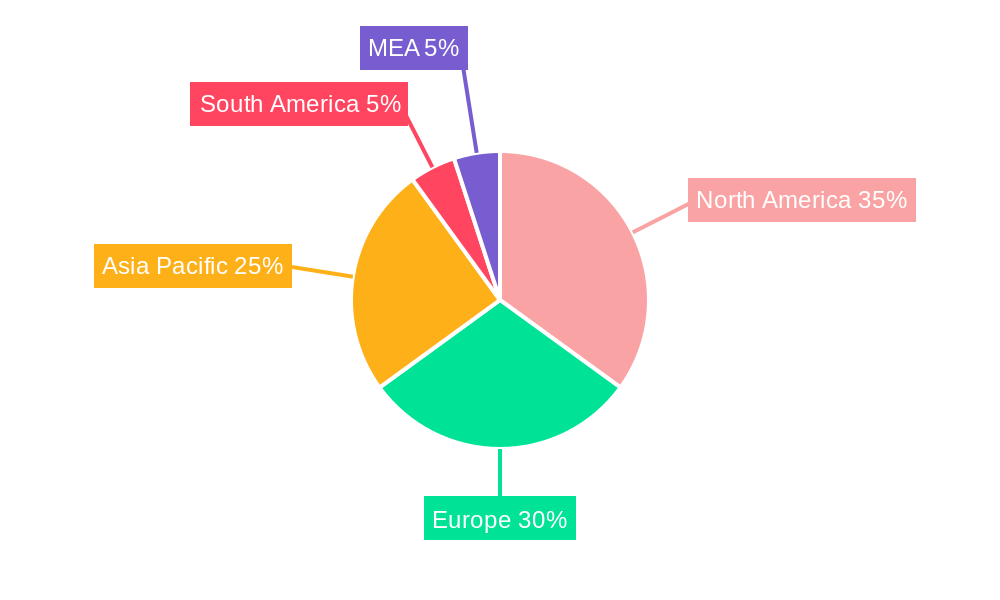
The market's geographical distribution reveals strong performance across North America and Europe, driven by established tourism industries and strong economic activity. However, rapid growth is projected for the Asia-Pacific region, fuelled by rising disposable incomes, increased domestic and international travel, and a developing preference for diverse accommodation choices. South America and the Middle East and Africa regions also present opportunities for future expansion, although infrastructural developments and economic stability will play crucial roles in shaping their respective market growth trajectories. The competitive landscape is characterized by a mix of established international hotel chains and rapidly expanding local players, driving innovation and increasing the overall diversity of available options for travelers. This competitive environment fosters continuous improvement in services, amenities, and booking technologies, further enhancing the overall market appeal and accelerating growth projections.
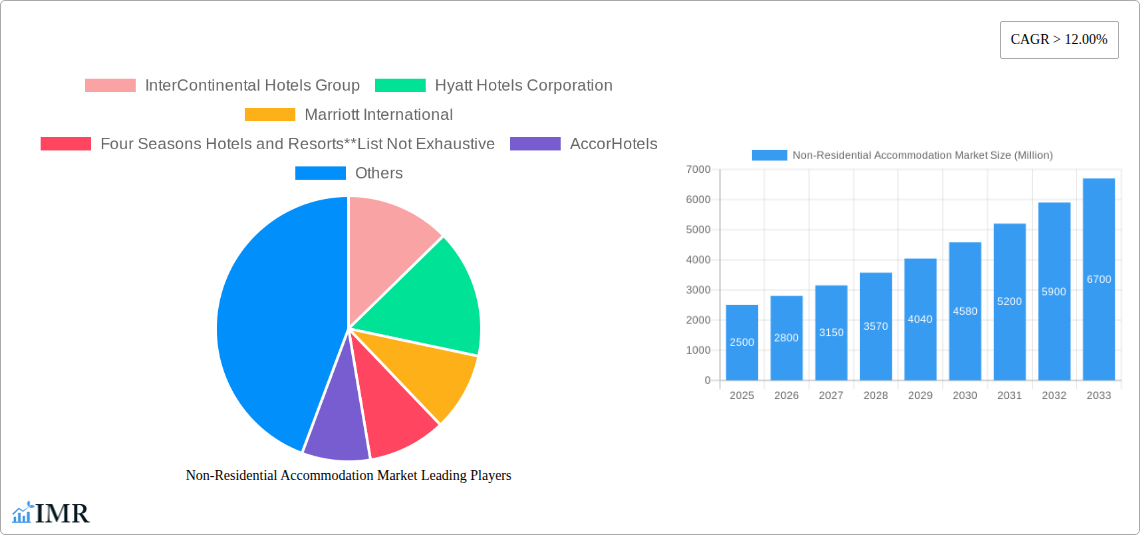
Non-Residential Accommodation Market Company Market Share
Non-Residential Accommodation Market: A Comprehensive Market Report (2019-2033)
This in-depth report provides a comprehensive analysis of the Non-Residential Accommodation Market, encompassing market dynamics, growth trends, regional dominance, key players, and future outlook. The study covers the period 2019-2033, with a focus on 2025 as the base and estimated year. This report is crucial for investors, industry professionals, and strategic decision-makers seeking to understand and capitalize on opportunities within this dynamic sector. The market is segmented by End User (Leisure Travelers, Business Travelers, Group Travelers), Distribution Channels (Hotel Websites, Online Travel Agencies (OTA), Travel Management Companies (TMCs), Corporate Travel Agents), and Type (Hotels, Motels, Resorts, Vacation Rentals, Others). The total market size is projected to reach xx Million units by 2033.
Non-Residential Accommodation Market Dynamics & Structure
The non-residential accommodation market is characterized by a moderately concentrated landscape with a few dominant players like Marriott International, Hilton Worldwide Holdings, and InterContinental Hotels Group holding significant market share. Technological innovation, particularly in online booking platforms and revenue management systems, is a key driver. However, regulatory frameworks concerning pricing, taxation, and sustainability practices pose challenges. The market also faces competition from alternative accommodation options like vacation rentals (Airbnb). Mergers and Acquisitions (M&A) activity, as seen in Marriott's recent acquisition, are shaping market consolidation.
- Market Concentration: The top 5 players account for approximately xx% of the global market share (2024).
- Technological Innovation: AI-powered chatbots, personalized recommendations, and smart room technology are transforming the guest experience.
- Regulatory Landscape: Varying regulations across different regions impact operational costs and expansion strategies.
- Competitive Substitutes: The rise of vacation rentals and alternative accommodation options presents a significant challenge.
- End-User Demographics: The increasing number of business and leisure travelers fuels market growth, with a notable shift toward experiential travel.
- M&A Trends: Consolidation is expected to continue, driven by the pursuit of economies of scale and market expansion. The number of M&A deals in the sector averaged xx per year between 2019 and 2024.
Non-Residential Accommodation Market Growth Trends & Insights
The non-residential accommodation market experienced significant growth between 2019 and 2024, recovering strongly from the pandemic disruption. The compound annual growth rate (CAGR) during the historical period (2019-2024) was xx%, driven by factors such as rising disposable incomes, increased travel demand, and technological advancements. The market is projected to maintain a CAGR of xx% during the forecast period (2025-2033), reaching xx Million units by 2033. This growth is further fueled by the expansion of the middle class in emerging economies and a growing preference for comfortable and convenient accommodation options. Technological disruptions, such as the rise of OTAs and the adoption of contactless check-in/out systems, are reshaping consumer behavior and driving market efficiency. The increasing adoption of sustainable practices within the industry is also contributing to positive growth.
Dominant Regions, Countries, or Segments in Non-Residential Accommodation Market
The North American and European markets currently dominate the non-residential accommodation sector, accounting for a combined xx% market share. However, significant growth potential lies in Asia-Pacific, driven by rapid economic development and rising tourism. Within the segments, the Business Traveler segment continues to be a significant revenue generator, though the Leisure Traveler segment is experiencing faster growth. Online Travel Agencies (OTAs) are the dominant distribution channel due to their extensive reach and ease of use.
Key Drivers:
- Economic Growth: Rising disposable incomes and increased tourism contribute significantly to market growth.
- Infrastructure Development: Improvements in transportation and connectivity enhance accessibility to accommodation options.
- Government Policies: Supportive tourism policies and incentives promote market expansion.
Dominance Factors:
- Market Share: North America and Europe maintain a significant market share due to established infrastructure and high tourism rates.
- Growth Potential: Asia-Pacific presents the highest growth potential owing to its expanding middle class and rising tourism.
- Segment Dominance: Business travel continues to drive revenue, while leisure travel demonstrates rapid growth.
Non-Residential Accommodation Market Product Landscape
The non-residential accommodation market offers a diverse range of products, including hotels, motels, resorts, and vacation rentals. Continuous innovation focuses on enhancing guest experiences through technology integration, such as smart room controls and personalized services. The rise of boutique hotels and eco-friendly accommodations reflects evolving consumer preferences. Unique selling propositions increasingly center on creating memorable experiences, personalization, and sustainability initiatives.
Key Drivers, Barriers & Challenges in Non-Residential Accommodation Market
Key Drivers: Increased tourism, rising disposable incomes, technological advancements (online booking platforms, revenue management systems), and government initiatives promoting tourism are primary drivers.
Challenges and Restraints: Fluctuations in currency exchange rates, economic downturns impacting travel spending, increased competition from alternative accommodation, and the impact of geopolitical instability on travel demand are major challenges. The global supply chain disruptions following the pandemic have impacted construction and maintenance costs and availability of materials, impacting the ability to increase supply. Stricter environmental regulations also add operational costs. These factors could reduce the growth rate by approximately xx% in the next 5 years if not addressed effectively.
Emerging Opportunities in Non-Residential Accommodation Market
Emerging opportunities lie in the expansion of unique and sustainable accommodation options, such as eco-lodges and glamping sites. The growth of experiential travel and personalized services, tailored to individual preferences, presents a significant market opportunity. Untapped markets in emerging economies also offer significant growth potential. Furthermore, increased use of data analytics for better customer understanding and service improvement.
Growth Accelerators in the Non-Residential Accommodation Market Industry
Strategic partnerships between hotel chains and technology providers can enhance operational efficiency and guest experiences. Expanding into untapped markets, particularly in developing economies, is a key growth driver. Focusing on sustainable and eco-friendly practices is also proving crucial for attracting environmentally conscious travelers.
Key Players Shaping the Non-Residential Accommodation Market Market
- InterContinental Hotels Group
- Hyatt Hotels Corporation
- Marriott International
- Four Seasons Hotels and Resorts
- AccorHotels
- Hilton Worldwide Holdings
- MGM Resorts International
- Starwood Hotels
- Ctrip Com International Ltd
- Rewe Group
Notable Milestones in Non-Residential Accommodation Market Sector
- December 2022: Hilton announced continued expansion of Waldorf Astoria Hotels & Resorts in the Caribbean and Latin America, signing a new hotel in San Miguel de Allende, Mexico. This signifies a strategic focus on luxury travel and expansion in key growth markets.
- October 2022: Marriott International's acquisition of a city express brand aimed at expanding its presence in the affordable midscale segment reflects a strategy to capture a broader customer base.
In-Depth Non-Residential Accommodation Market Market Outlook
The non-residential accommodation market is poised for continued growth, driven by technological innovation, strategic partnerships, and expansion into new markets. Opportunities lie in personalized services, sustainable practices, and leveraging data analytics to enhance the guest experience. The market is expected to witness further consolidation through M&A activity, leading to a more concentrated yet dynamic landscape. Focusing on niche segments and delivering unique, memorable experiences will be key to success in this competitive market.
Non-Residential Accommodation Market Segmentation
-
1. Type
- 1.1. Hotels
- 1.2. Motels
- 1.3. Resorts
- 1.4. Vacation Rentals
- 1.5. Others
-
2. End User
- 2.1. Leisure Travelers
- 2.2. Business Travelers
- 2.3. Group Travelers
-
3. Distribution Channels
- 3.1. Hotel Websites
- 3.2. Online Travel Agencies (OTA)
- 3.3. Travel Management Companies (TMCs)
- 3.4. Corporate Travel Agents
Non-Residential Accommodation Market Segmentation By Geography
- 1. North America
- 2. Europe
- 3. Asia Pacific
- 4. South America
- 5. Middle East
Non-Residential Accommodation Market Regional Market Share
Geographic Coverage of Non-Residential Accommodation Market
Non-Residential Accommodation Market REPORT HIGHLIGHTS
| Aspects | Details |
|---|---|
| Study Period | 2020-2034 |
| Base Year | 2025 |
| Estimated Year | 2026 |
| Forecast Period | 2026-2034 |
| Historical Period | 2020-2025 |
| Growth Rate | CAGR of > 12.00% from 2020-2034 |
| Segmentation |
|
Table of Contents
- 1. Introduction
- 1.1. Research Scope
- 1.2. Market Segmentation
- 1.3. Research Objective
- 1.4. Definitions and Assumptions
- 2. Executive Summary
- 2.1. Market Snapshot
- 3. Market Dynamics
- 3.1. Market Drivers
- 3.2. Market Restrains
- 3.3. Market Trends
- 3.4. Market Opportunities
- 4. Market Factor Analysis
- 4.1. Porters Five Forces
- 4.1.1. Bargaining Power of Suppliers
- 4.1.2. Bargaining Power of Buyers
- 4.1.3. Threat of New Entrants
- 4.1.4. Threat of Substitutes
- 4.1.5. Competitive Rivalry
- 4.2. PESTEL analysis
- 4.3. BCG Analysis
- 4.3.1. Stars (High Growth, High Market Share)
- 4.3.2. Cash Cows (Low Growth, High Market Share)
- 4.3.3. Question Mark (High Growth, Low Market Share)
- 4.3.4. Dogs (Low Growth, Low Market Share)
- 4.4. Ansoff Matrix Analysis
- 4.5. Supply Chain Analysis
- 4.6. Regulatory Landscape
- 4.7. Current Market Potential and Opportunity Assessment (TAM–SAM–SOM Framework)
- 4.8. IMR Analyst Note
- 4.1. Porters Five Forces
- 5. Market Analysis, Insights and Forecast 2021-2033
- 5.1. Market Analysis, Insights and Forecast - by Type
- 5.1.1. Hotels
- 5.1.2. Motels
- 5.1.3. Resorts
- 5.1.4. Vacation Rentals
- 5.1.5. Others
- 5.2. Market Analysis, Insights and Forecast - by End User
- 5.2.1. Leisure Travelers
- 5.2.2. Business Travelers
- 5.2.3. Group Travelers
- 5.3. Market Analysis, Insights and Forecast - by Distribution Channels
- 5.3.1. Hotel Websites
- 5.3.2. Online Travel Agencies (OTA)
- 5.3.3. Travel Management Companies (TMCs)
- 5.3.4. Corporate Travel Agents
- 5.4. Market Analysis, Insights and Forecast - by Region
- 5.4.1. North America
- 5.4.2. Europe
- 5.4.3. Asia Pacific
- 5.4.4. South America
- 5.4.5. Middle East
- 5.1. Market Analysis, Insights and Forecast - by Type
- 6. Global Non-Residential Accommodation Market Analysis, Insights and Forecast, 2021-2033
- 6.1. Market Analysis, Insights and Forecast - by Type
- 6.1.1. Hotels
- 6.1.2. Motels
- 6.1.3. Resorts
- 6.1.4. Vacation Rentals
- 6.1.5. Others
- 6.2. Market Analysis, Insights and Forecast - by End User
- 6.2.1. Leisure Travelers
- 6.2.2. Business Travelers
- 6.2.3. Group Travelers
- 6.3. Market Analysis, Insights and Forecast - by Distribution Channels
- 6.3.1. Hotel Websites
- 6.3.2. Online Travel Agencies (OTA)
- 6.3.3. Travel Management Companies (TMCs)
- 6.3.4. Corporate Travel Agents
- 6.1. Market Analysis, Insights and Forecast - by Type
- 7. North America Non-Residential Accommodation Market Analysis, Insights and Forecast, 2020-2032
- 7.1. Market Analysis, Insights and Forecast - by Type
- 7.1.1. Hotels
- 7.1.2. Motels
- 7.1.3. Resorts
- 7.1.4. Vacation Rentals
- 7.1.5. Others
- 7.2. Market Analysis, Insights and Forecast - by End User
- 7.2.1. Leisure Travelers
- 7.2.2. Business Travelers
- 7.2.3. Group Travelers
- 7.3. Market Analysis, Insights and Forecast - by Distribution Channels
- 7.3.1. Hotel Websites
- 7.3.2. Online Travel Agencies (OTA)
- 7.3.3. Travel Management Companies (TMCs)
- 7.3.4. Corporate Travel Agents
- 7.1. Market Analysis, Insights and Forecast - by Type
- 8. Europe Non-Residential Accommodation Market Analysis, Insights and Forecast, 2020-2032
- 8.1. Market Analysis, Insights and Forecast - by Type
- 8.1.1. Hotels
- 8.1.2. Motels
- 8.1.3. Resorts
- 8.1.4. Vacation Rentals
- 8.1.5. Others
- 8.2. Market Analysis, Insights and Forecast - by End User
- 8.2.1. Leisure Travelers
- 8.2.2. Business Travelers
- 8.2.3. Group Travelers
- 8.3. Market Analysis, Insights and Forecast - by Distribution Channels
- 8.3.1. Hotel Websites
- 8.3.2. Online Travel Agencies (OTA)
- 8.3.3. Travel Management Companies (TMCs)
- 8.3.4. Corporate Travel Agents
- 8.1. Market Analysis, Insights and Forecast - by Type
- 9. Asia Pacific Non-Residential Accommodation Market Analysis, Insights and Forecast, 2020-2032
- 9.1. Market Analysis, Insights and Forecast - by Type
- 9.1.1. Hotels
- 9.1.2. Motels
- 9.1.3. Resorts
- 9.1.4. Vacation Rentals
- 9.1.5. Others
- 9.2. Market Analysis, Insights and Forecast - by End User
- 9.2.1. Leisure Travelers
- 9.2.2. Business Travelers
- 9.2.3. Group Travelers
- 9.3. Market Analysis, Insights and Forecast - by Distribution Channels
- 9.3.1. Hotel Websites
- 9.3.2. Online Travel Agencies (OTA)
- 9.3.3. Travel Management Companies (TMCs)
- 9.3.4. Corporate Travel Agents
- 9.1. Market Analysis, Insights and Forecast - by Type
- 10. South America Non-Residential Accommodation Market Analysis, Insights and Forecast, 2020-2032
- 10.1. Market Analysis, Insights and Forecast - by Type
- 10.1.1. Hotels
- 10.1.2. Motels
- 10.1.3. Resorts
- 10.1.4. Vacation Rentals
- 10.1.5. Others
- 10.2. Market Analysis, Insights and Forecast - by End User
- 10.2.1. Leisure Travelers
- 10.2.2. Business Travelers
- 10.2.3. Group Travelers
- 10.3. Market Analysis, Insights and Forecast - by Distribution Channels
- 10.3.1. Hotel Websites
- 10.3.2. Online Travel Agencies (OTA)
- 10.3.3. Travel Management Companies (TMCs)
- 10.3.4. Corporate Travel Agents
- 10.1. Market Analysis, Insights and Forecast - by Type
- 11. Middle East Non-Residential Accommodation Market Analysis, Insights and Forecast, 2020-2032
- 11.1. Market Analysis, Insights and Forecast - by Type
- 11.1.1. Hotels
- 11.1.2. Motels
- 11.1.3. Resorts
- 11.1.4. Vacation Rentals
- 11.1.5. Others
- 11.2. Market Analysis, Insights and Forecast - by End User
- 11.2.1. Leisure Travelers
- 11.2.2. Business Travelers
- 11.2.3. Group Travelers
- 11.3. Market Analysis, Insights and Forecast - by Distribution Channels
- 11.3.1. Hotel Websites
- 11.3.2. Online Travel Agencies (OTA)
- 11.3.3. Travel Management Companies (TMCs)
- 11.3.4. Corporate Travel Agents
- 11.1. Market Analysis, Insights and Forecast - by Type
- 12. Competitive Analysis
- 12.1. Company Profiles
- 12.1.1 InterContinental Hotels Group
- 12.1.1.1. Company Overview
- 12.1.1.2. Products
- 12.1.1.3. Company Financials
- 12.1.1.4. SWOT Analysis
- 12.1.2 Hyatt Hotels Corporation
- 12.1.2.1. Company Overview
- 12.1.2.2. Products
- 12.1.2.3. Company Financials
- 12.1.2.4. SWOT Analysis
- 12.1.3 Marriott International
- 12.1.3.1. Company Overview
- 12.1.3.2. Products
- 12.1.3.3. Company Financials
- 12.1.3.4. SWOT Analysis
- 12.1.4 Four Seasons Hotels and Resorts**List Not Exhaustive
- 12.1.4.1. Company Overview
- 12.1.4.2. Products
- 12.1.4.3. Company Financials
- 12.1.4.4. SWOT Analysis
- 12.1.5 AccorHotels
- 12.1.5.1. Company Overview
- 12.1.5.2. Products
- 12.1.5.3. Company Financials
- 12.1.5.4. SWOT Analysis
- 12.1.6 Hilton Worldwide Holdings
- 12.1.6.1. Company Overview
- 12.1.6.2. Products
- 12.1.6.3. Company Financials
- 12.1.6.4. SWOT Analysis
- 12.1.7 MGM Resorts International
- 12.1.7.1. Company Overview
- 12.1.7.2. Products
- 12.1.7.3. Company Financials
- 12.1.7.4. SWOT Analysis
- 12.1.8 Starwood Hotels
- 12.1.8.1. Company Overview
- 12.1.8.2. Products
- 12.1.8.3. Company Financials
- 12.1.8.4. SWOT Analysis
- 12.1.9 Ctrip Com International Ltd
- 12.1.9.1. Company Overview
- 12.1.9.2. Products
- 12.1.9.3. Company Financials
- 12.1.9.4. SWOT Analysis
- 12.1.10 Rewe Group
- 12.1.10.1. Company Overview
- 12.1.10.2. Products
- 12.1.10.3. Company Financials
- 12.1.10.4. SWOT Analysis
- 12.1.1 InterContinental Hotels Group
- 12.2. Market Entropy
- 12.2.1 Company's Key Areas Served
- 12.2.2 Recent Developments
- 12.3. Company Market Share Analysis 2025
- 12.3.1 Top 5 Companies Market Share Analysis
- 12.3.2 Top 3 Companies Market Share Analysis
- 12.4. List of Potential Customers
- 13. Research Methodology
List of Figures
- Figure 1: Global Non-Residential Accommodation Market Revenue Breakdown (Million, %) by Region 2025 & 2033
- Figure 2: North America Non-Residential Accommodation Market Revenue (Million), by Type 2025 & 2033
- Figure 3: North America Non-Residential Accommodation Market Revenue Share (%), by Type 2025 & 2033
- Figure 4: North America Non-Residential Accommodation Market Revenue (Million), by End User 2025 & 2033
- Figure 5: North America Non-Residential Accommodation Market Revenue Share (%), by End User 2025 & 2033
- Figure 6: North America Non-Residential Accommodation Market Revenue (Million), by Distribution Channels 2025 & 2033
- Figure 7: North America Non-Residential Accommodation Market Revenue Share (%), by Distribution Channels 2025 & 2033
- Figure 8: North America Non-Residential Accommodation Market Revenue (Million), by Country 2025 & 2033
- Figure 9: North America Non-Residential Accommodation Market Revenue Share (%), by Country 2025 & 2033
- Figure 10: Europe Non-Residential Accommodation Market Revenue (Million), by Type 2025 & 2033
- Figure 11: Europe Non-Residential Accommodation Market Revenue Share (%), by Type 2025 & 2033
- Figure 12: Europe Non-Residential Accommodation Market Revenue (Million), by End User 2025 & 2033
- Figure 13: Europe Non-Residential Accommodation Market Revenue Share (%), by End User 2025 & 2033
- Figure 14: Europe Non-Residential Accommodation Market Revenue (Million), by Distribution Channels 2025 & 2033
- Figure 15: Europe Non-Residential Accommodation Market Revenue Share (%), by Distribution Channels 2025 & 2033
- Figure 16: Europe Non-Residential Accommodation Market Revenue (Million), by Country 2025 & 2033
- Figure 17: Europe Non-Residential Accommodation Market Revenue Share (%), by Country 2025 & 2033
- Figure 18: Asia Pacific Non-Residential Accommodation Market Revenue (Million), by Type 2025 & 2033
- Figure 19: Asia Pacific Non-Residential Accommodation Market Revenue Share (%), by Type 2025 & 2033
- Figure 20: Asia Pacific Non-Residential Accommodation Market Revenue (Million), by End User 2025 & 2033
- Figure 21: Asia Pacific Non-Residential Accommodation Market Revenue Share (%), by End User 2025 & 2033
- Figure 22: Asia Pacific Non-Residential Accommodation Market Revenue (Million), by Distribution Channels 2025 & 2033
- Figure 23: Asia Pacific Non-Residential Accommodation Market Revenue Share (%), by Distribution Channels 2025 & 2033
- Figure 24: Asia Pacific Non-Residential Accommodation Market Revenue (Million), by Country 2025 & 2033
- Figure 25: Asia Pacific Non-Residential Accommodation Market Revenue Share (%), by Country 2025 & 2033
- Figure 26: South America Non-Residential Accommodation Market Revenue (Million), by Type 2025 & 2033
- Figure 27: South America Non-Residential Accommodation Market Revenue Share (%), by Type 2025 & 2033
- Figure 28: South America Non-Residential Accommodation Market Revenue (Million), by End User 2025 & 2033
- Figure 29: South America Non-Residential Accommodation Market Revenue Share (%), by End User 2025 & 2033
- Figure 30: South America Non-Residential Accommodation Market Revenue (Million), by Distribution Channels 2025 & 2033
- Figure 31: South America Non-Residential Accommodation Market Revenue Share (%), by Distribution Channels 2025 & 2033
- Figure 32: South America Non-Residential Accommodation Market Revenue (Million), by Country 2025 & 2033
- Figure 33: South America Non-Residential Accommodation Market Revenue Share (%), by Country 2025 & 2033
- Figure 34: Middle East Non-Residential Accommodation Market Revenue (Million), by Type 2025 & 2033
- Figure 35: Middle East Non-Residential Accommodation Market Revenue Share (%), by Type 2025 & 2033
- Figure 36: Middle East Non-Residential Accommodation Market Revenue (Million), by End User 2025 & 2033
- Figure 37: Middle East Non-Residential Accommodation Market Revenue Share (%), by End User 2025 & 2033
- Figure 38: Middle East Non-Residential Accommodation Market Revenue (Million), by Distribution Channels 2025 & 2033
- Figure 39: Middle East Non-Residential Accommodation Market Revenue Share (%), by Distribution Channels 2025 & 2033
- Figure 40: Middle East Non-Residential Accommodation Market Revenue (Million), by Country 2025 & 2033
- Figure 41: Middle East Non-Residential Accommodation Market Revenue Share (%), by Country 2025 & 2033
List of Tables
- Table 1: Global Non-Residential Accommodation Market Revenue Million Forecast, by Type 2020 & 2033
- Table 2: Global Non-Residential Accommodation Market Revenue Million Forecast, by End User 2020 & 2033
- Table 3: Global Non-Residential Accommodation Market Revenue Million Forecast, by Distribution Channels 2020 & 2033
- Table 4: Global Non-Residential Accommodation Market Revenue Million Forecast, by Region 2020 & 2033
- Table 5: Global Non-Residential Accommodation Market Revenue Million Forecast, by Type 2020 & 2033
- Table 6: Global Non-Residential Accommodation Market Revenue Million Forecast, by End User 2020 & 2033
- Table 7: Global Non-Residential Accommodation Market Revenue Million Forecast, by Distribution Channels 2020 & 2033
- Table 8: Global Non-Residential Accommodation Market Revenue Million Forecast, by Country 2020 & 2033
- Table 9: Global Non-Residential Accommodation Market Revenue Million Forecast, by Type 2020 & 2033
- Table 10: Global Non-Residential Accommodation Market Revenue Million Forecast, by End User 2020 & 2033
- Table 11: Global Non-Residential Accommodation Market Revenue Million Forecast, by Distribution Channels 2020 & 2033
- Table 12: Global Non-Residential Accommodation Market Revenue Million Forecast, by Country 2020 & 2033
- Table 13: Global Non-Residential Accommodation Market Revenue Million Forecast, by Type 2020 & 2033
- Table 14: Global Non-Residential Accommodation Market Revenue Million Forecast, by End User 2020 & 2033
- Table 15: Global Non-Residential Accommodation Market Revenue Million Forecast, by Distribution Channels 2020 & 2033
- Table 16: Global Non-Residential Accommodation Market Revenue Million Forecast, by Country 2020 & 2033
- Table 17: Global Non-Residential Accommodation Market Revenue Million Forecast, by Type 2020 & 2033
- Table 18: Global Non-Residential Accommodation Market Revenue Million Forecast, by End User 2020 & 2033
- Table 19: Global Non-Residential Accommodation Market Revenue Million Forecast, by Distribution Channels 2020 & 2033
- Table 20: Global Non-Residential Accommodation Market Revenue Million Forecast, by Country 2020 & 2033
- Table 21: Global Non-Residential Accommodation Market Revenue Million Forecast, by Type 2020 & 2033
- Table 22: Global Non-Residential Accommodation Market Revenue Million Forecast, by End User 2020 & 2033
- Table 23: Global Non-Residential Accommodation Market Revenue Million Forecast, by Distribution Channels 2020 & 2033
- Table 24: Global Non-Residential Accommodation Market Revenue Million Forecast, by Country 2020 & 2033
Frequently Asked Questions
1. What is the projected Compound Annual Growth Rate (CAGR) of the Non-Residential Accommodation Market?
The projected CAGR is approximately > 12.00%.
2. Which companies are prominent players in the Non-Residential Accommodation Market?
Key companies in the market include InterContinental Hotels Group, Hyatt Hotels Corporation, Marriott International, Four Seasons Hotels and Resorts**List Not Exhaustive, AccorHotels, Hilton Worldwide Holdings, MGM Resorts International, Starwood Hotels, Ctrip Com International Ltd, Rewe Group.
3. What are the main segments of the Non-Residential Accommodation Market?
The market segments include Type, End User, Distribution Channels.
4. Can you provide details about the market size?
The market size is estimated to be USD XX Million as of 2022.
5. What are some drivers contributing to market growth?
Increased Demand for Unique and Personalized Travel Experiences; Rising Trend of Online Booking and Mobile Applications.
6. What are the notable trends driving market growth?
Technology Driven Services is Driving the Market.
7. Are there any restraints impacting market growth?
Competition from Other Alternative Accommodation Options Such as Vacation Rentals and Homestays; Seasonal Demand Fluctuations and Dependence on Tourism Industry.
8. Can you provide examples of recent developments in the market?
December 2022: Hilton Announced Continued Expansion of Waldorf Astoria Hotels & Resorts in the Caribbean and Latin America by signing a new hotel in San Miguel de Allende, Mexico.
9. What pricing options are available for accessing the report?
Pricing options include single-user, multi-user, and enterprise licenses priced at USD 4750, USD 5250, and USD 8750 respectively.
10. Is the market size provided in terms of value or volume?
The market size is provided in terms of value, measured in Million.
11. Are there any specific market keywords associated with the report?
Yes, the market keyword associated with the report is "Non-Residential Accommodation Market," which aids in identifying and referencing the specific market segment covered.
12. How do I determine which pricing option suits my needs best?
The pricing options vary based on user requirements and access needs. Individual users may opt for single-user licenses, while businesses requiring broader access may choose multi-user or enterprise licenses for cost-effective access to the report.
13. Are there any additional resources or data provided in the Non-Residential Accommodation Market report?
While the report offers comprehensive insights, it's advisable to review the specific contents or supplementary materials provided to ascertain if additional resources or data are available.
14. How can I stay updated on further developments or reports in the Non-Residential Accommodation Market?
To stay informed about further developments, trends, and reports in the Non-Residential Accommodation Market, consider subscribing to industry newsletters, following relevant companies and organizations, or regularly checking reputable industry news sources and publications.
Methodology
Step 1 - Identification of Relevant Samples Size from Population Database


Step 2 - Approaches for Defining Global Market Size (Value, Volume* & Price*)

Note*: In applicable scenarios
Step 3 - Data Sources
Primary Research
- Web Analytics
- Survey Reports
- Research Institute
- Latest Research Reports
- Opinion Leaders
Secondary Research
- Annual Reports
- White Paper
- Latest Press Release
- Industry Association
- Paid Database
- Investor Presentations

Step 4 - Data Triangulation
Involves using different sources of information in order to increase the validity of a study
These sources are likely to be stakeholders in a program - participants, other researchers, program staff, other community members, and so on.
Then we put all data in single framework & apply various statistical tools to find out the dynamic on the market.
During the analysis stage, feedback from the stakeholder groups would be compared to determine areas of agreement as well as areas of divergence