

Key Insights
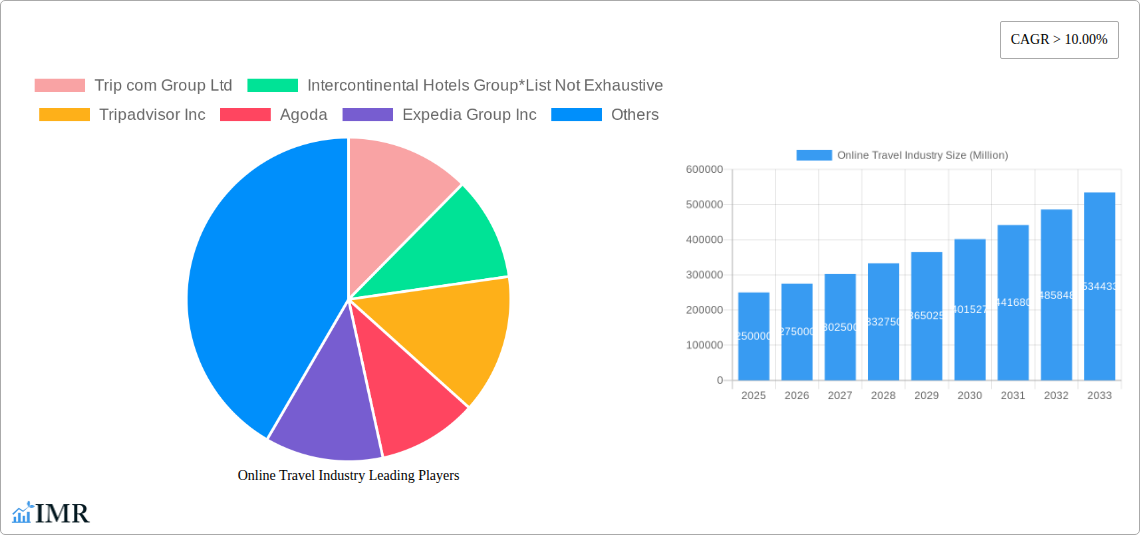
The online travel market is poised for significant expansion, driven by widespread internet access, mobile device adoption, and a growing consumer demand for streamlined, economical travel arrangements. The market is projected to reach a value of $622.6 billion by 2025, with a Compound Annual Growth Rate (CAGR) of 9.75%. Key growth catalysts include the affordability of air travel, the rising appeal of experiential tourism, and the increasing utilization of online booking platforms that offer competitive pricing and customized itineraries. The market is segmented by platform (mobile applications and websites) and booking channel (third-party and direct booking). Mobile applications are expected to lead market penetration due to their user-friendly interface and accessibility. Major industry players such as Booking Holdings, Expedia Group, and Trip.com exemplify market consolidation, though emerging niche providers and agile startups are actively innovating in sectors like sustainable travel and distinctive experiences. Geographically, North America and Europe represent substantial market shares, while the Asia-Pacific region is experiencing accelerated growth fueled by escalating disposable incomes and heightened tourism in key economies like China and India.
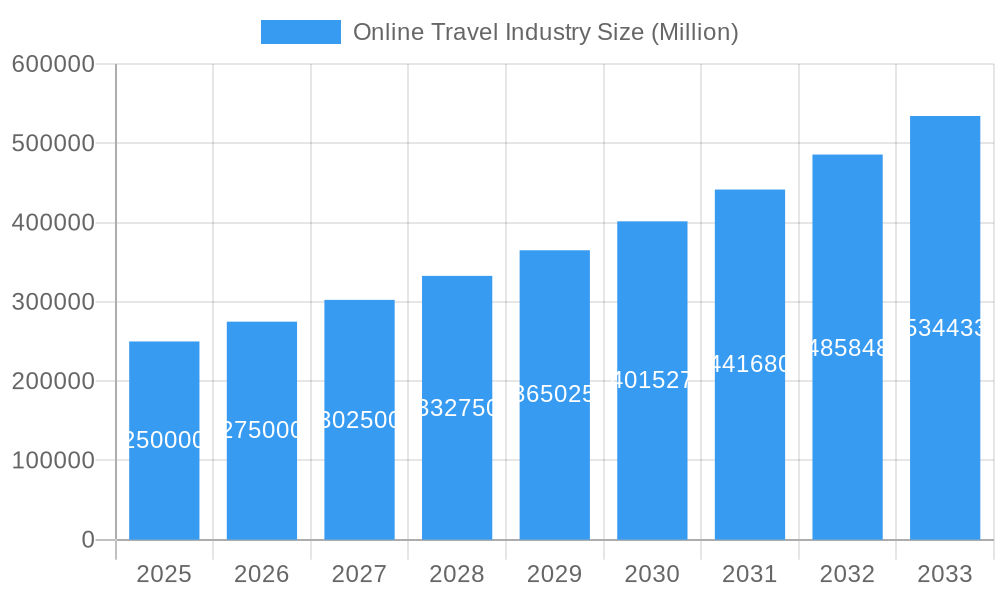
Online Travel Industry Market Size (In Billion)
Industry participants confront ongoing challenges, including intense competition that mandates persistent innovation and differentiation. Volatility in fuel costs and global economic instability can influence travel demand. Ensuring secure online transactions and addressing data privacy concerns are paramount for sustained market growth. To navigate these complexities, companies are prioritizing personalized travel recommendations, robust loyalty programs, and superior customer service to enhance user satisfaction and foster brand advocacy. The online travel sector’s trajectory remains promising, with continuous technological advancements and evolving consumer preferences shaping its future and creating avenues for further growth and innovation.
Online Travel Industry Company Market Share
Online Travel Industry Market Report: 2019-2033
This comprehensive report provides a detailed analysis of the online travel industry, encompassing market dynamics, growth trends, key players, and future outlook. With a study period spanning 2019-2033, a base year of 2025, and an estimated and forecast period of 2025-2033, this report offers invaluable insights for industry professionals, investors, and strategists. The report covers both parent markets (online travel) and child markets (e.g., hotel bookings, flight tickets, vacation packages). Market values are presented in millions.
Online Travel Industry Market Dynamics & Structure
The online travel industry is characterized by high market concentration, with a few dominant players controlling significant market share. The historical period (2019-2024) witnessed substantial M&A activity, with xx deals valued at approximately $xx million. Technological innovation, particularly in AI-powered personalization and mobile applications, is a key driver. However, regulatory frameworks concerning data privacy and consumer protection pose significant challenges. The industry faces competition from alternative travel arrangements and evolving consumer preferences.
- Market Concentration: Booking Holdings Inc and Expedia Group Inc hold a combined market share of approximately xx%, indicating a highly consolidated market.
- Technological Innovation: AI-driven recommendations and personalized travel itineraries are transforming the customer experience.
- Regulatory Landscape: GDPR and CCPA regulations influence data handling practices and impact customer trust.
- Competitive Substitutes: Direct booking through hotels or airlines, peer-to-peer platforms (e.g., Airbnb) challenge established online travel agents (OTAs).
- End-User Demographics: Millennials and Gen Z represent significant growth segments, exhibiting a strong preference for mobile booking platforms.
- M&A Trends: Consolidation continues, with larger players acquiring smaller companies to expand their service offerings and geographical reach.
Online Travel Industry Growth Trends & Insights
The global online travel market experienced significant growth during the historical period, driven by increasing internet and smartphone penetration, coupled with changing consumer preferences. The market size reached $xx million in 2024, exhibiting a CAGR of xx% between 2019 and 2024. This growth is expected to continue through 2033, with a projected CAGR of xx% during the forecast period (2025-2033), reaching $xx million by 2033. This growth is fueled by the adoption of mobile applications, the expansion of travel options, and the increasing popularity of personalized travel experiences. The market penetration rate is expected to reach xx% by 2033, indicating substantial growth potential. Technological disruptions, such as the rise of mobile-first booking and the integration of blockchain technology, are further impacting market dynamics and accelerating growth. Consumer behavior is also shifting toward value-driven travel experiences and a preference for sustainable travel options.
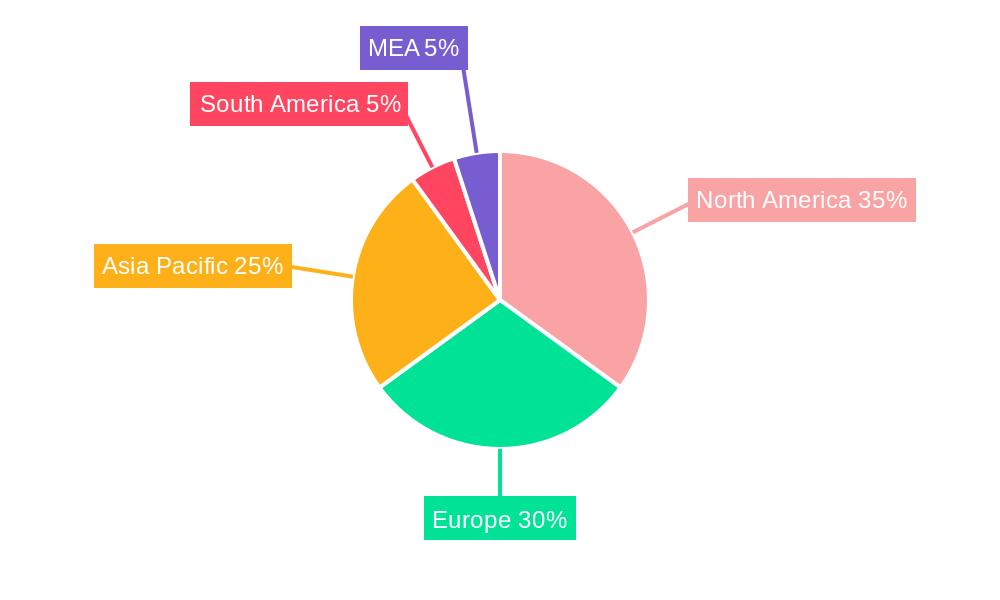
Dominant Regions, Countries, or Segments in Online Travel Industry
North America and Europe currently dominate the online travel market, accounting for approximately xx% of global revenue in 2024. However, the Asia-Pacific region is projected to experience the highest growth rate during the forecast period, driven by increasing disposable incomes and a burgeoning middle class. Within segments, Mobile Applications account for the highest share, exceeding xx% of bookings, owing to user convenience and enhanced personalization features. Third-party online portals hold a significant market share, benefiting from wider reach and greater consumer trust established over time.
- Key Drivers in North America: Strong consumer spending, well-developed tourism infrastructure, and the presence of major OTAs.
- Key Drivers in Asia-Pacific: Rapid economic growth, rising disposable incomes, and increasing internet penetration.
- Platform Dominance: Mobile applications are the preferred booking method, offering convenience and personalization.
- Booking Mode Preference: Third-party online portals maintain a strong position due to their broad selection and established trust.
Online Travel Industry Product Landscape
The online travel industry offers a wide range of products and services, from flight and hotel bookings to vacation packages and travel insurance. Recent innovations include AI-powered travel planning tools, personalized recommendations, and virtual reality experiences that allow users to explore destinations before booking. These advancements enhance customer experience and generate new revenue streams. Key performance indicators include booking conversion rates, customer satisfaction scores, and average revenue per booking. Unique selling propositions often revolve around price competitiveness, personalized offerings, and seamless user experiences.
Key Drivers, Barriers & Challenges in Online Travel Industry
Key Drivers:
- Technological advancements like AI and big data enhance personalization and efficiency.
- Rising disposable incomes and increased leisure time fuel travel demand.
- Growth of mobile technology expands market access and convenience.
Challenges and Restraints:
- Fluctuations in currency exchange rates and fuel prices impact profitability.
- Stringent government regulations on data privacy and consumer protection create operational complexities.
- Intense competition among OTAs puts downward pressure on prices and margins. This reduces overall profitability by approximately xx% based on current estimates.
Emerging Opportunities in Online Travel Industry
- Sustainable Tourism: Growing consumer demand for eco-friendly travel options presents significant opportunities.
- Experiential Travel: Customized and immersive travel experiences are gaining traction.
- Bleisure Travel: Blending business and leisure trips creates new segments and revenue streams.
- Hyper-Personalization: AI-driven travel recommendations improve customer experiences and engagement.
Growth Accelerators in the Online Travel Industry
Technological advancements, strategic partnerships, and expansion into underserved markets will be key catalysts for future growth. The integration of blockchain technology for secure transactions and the adoption of metaverse experiences will redefine the online travel landscape. Strategic alliances between OTAs and airlines or hotels create synergistic advantages and enhance competitiveness. Expanding into emerging markets, particularly in Africa and South America, will unlock significant growth potential.
Key Players Shaping the Online Travel Industry Market
- Trip.com Group Ltd
- Intercontinental Hotels Group
- Tripadvisor Inc
- Agoda
- Expedia Group Inc
- Traveloka Indonesia PT
- HRS GmbH
- Oravel Stays Pvt Ltd
- Airbnb Inc
- Hostelworld Group
- Hotelbeds Group SL
- Booking Holdings Inc
Notable Milestones in Online Travel Industry Sector
- 2020: The COVID-19 pandemic significantly impacted the industry, leading to widespread travel restrictions and a sharp decline in bookings.
- 2022: Increased vaccination rates and easing of travel restrictions led to a rebound in travel demand.
- 2023: Several major OTAs launched new mobile applications with enhanced features and improved user interfaces.
- 2024: Several mergers and acquisitions among smaller travel companies consolidated the market landscape.
In-Depth Online Travel Industry Market Outlook
The online travel industry is poised for continued growth, driven by technological innovations, changing consumer preferences, and expanding market opportunities. Strategic investments in sustainable tourism, personalized travel experiences, and innovative technologies will be crucial for companies seeking to thrive in this dynamic market. The focus will be on creating seamless and personalized travel experiences that cater to the evolving needs of the modern traveler. Expansion into underserved markets and the adoption of new technologies will be key differentiators for success.
Online Travel Industry Segmentation
-
1. Platform
- 1.1. Mobile Application
- 1.2. Website
-
2. Mode of Booking
- 2.1. Third party online portals
- 2.2. Direct / captive portals
Online Travel Industry Segmentation By Geography
-
1. North America
- 1.1. United States
- 1.2. Canada
- 1.3. Mexico
-
2. South America
- 2.1. Brazil
- 2.2. Argentina
- 2.3. Rest of South America
-
3. Europe
- 3.1. United Kingdom
- 3.2. Germany
- 3.3. France
- 3.4. Italy
- 3.5. Spain
- 3.6. Russia
- 3.7. Benelux
- 3.8. Nordics
- 3.9. Rest of Europe
-
4. Middle East & Africa
- 4.1. Turkey
- 4.2. Israel
- 4.3. GCC
- 4.4. North Africa
- 4.5. South Africa
- 4.6. Rest of Middle East & Africa
-
5. Asia Pacific
- 5.1. China
- 5.2. India
- 5.3. Japan
- 5.4. South Korea
- 5.5. ASEAN
- 5.6. Oceania
- 5.7. Rest of Asia Pacific
Online Travel Industry Regional Market Share
Geographic Coverage of Online Travel Industry
Online Travel Industry REPORT HIGHLIGHTS
| Aspects | Details |
|---|---|
| Study Period | 2020-2034 |
| Base Year | 2025 |
| Estimated Year | 2026 |
| Forecast Period | 2026-2034 |
| Historical Period | 2020-2025 |
| Growth Rate | CAGR of 9.75% from 2020-2034 |
| Segmentation |
|
Table of Contents
- 1. Introduction
- 1.1. Research Scope
- 1.2. Market Segmentation
- 1.3. Research Objective
- 1.4. Definitions and Assumptions
- 2. Executive Summary
- 2.1. Market Snapshot
- 3. Market Dynamics
- 3.1. Market Drivers
- 3.2. Market Restrains
- 3.3. Market Trends
- 3.4. Market Opportunities
- 4. Market Factor Analysis
- 4.1. Porters Five Forces
- 4.1.1. Bargaining Power of Suppliers
- 4.1.2. Bargaining Power of Buyers
- 4.1.3. Threat of New Entrants
- 4.1.4. Threat of Substitutes
- 4.1.5. Competitive Rivalry
- 4.2. PESTEL analysis
- 4.3. BCG Analysis
- 4.3.1. Stars (High Growth, High Market Share)
- 4.3.2. Cash Cows (Low Growth, High Market Share)
- 4.3.3. Question Mark (High Growth, Low Market Share)
- 4.3.4. Dogs (Low Growth, Low Market Share)
- 4.4. Ansoff Matrix Analysis
- 4.5. Supply Chain Analysis
- 4.6. Regulatory Landscape
- 4.7. Current Market Potential and Opportunity Assessment (TAM–SAM–SOM Framework)
- 4.8. IMR Analyst Note
- 4.1. Porters Five Forces
- 5. Market Analysis, Insights and Forecast 2021-2033
- 5.1. Market Analysis, Insights and Forecast - by Platform
- 5.1.1. Mobile Application
- 5.1.2. Website
- 5.2. Market Analysis, Insights and Forecast - by Mode of Booking
- 5.2.1. Third party online portals
- 5.2.2. Direct / captive portals
- 5.3. Market Analysis, Insights and Forecast - by Region
- 5.3.1. North America
- 5.3.2. South America
- 5.3.3. Europe
- 5.3.4. Middle East & Africa
- 5.3.5. Asia Pacific
- 5.1. Market Analysis, Insights and Forecast - by Platform
- 6. Global Online Travel Industry Analysis, Insights and Forecast, 2021-2033
- 6.1. Market Analysis, Insights and Forecast - by Platform
- 6.1.1. Mobile Application
- 6.1.2. Website
- 6.2. Market Analysis, Insights and Forecast - by Mode of Booking
- 6.2.1. Third party online portals
- 6.2.2. Direct / captive portals
- 6.1. Market Analysis, Insights and Forecast - by Platform
- 7. North America Online Travel Industry Analysis, Insights and Forecast, 2020-2032
- 7.1. Market Analysis, Insights and Forecast - by Platform
- 7.1.1. Mobile Application
- 7.1.2. Website
- 7.2. Market Analysis, Insights and Forecast - by Mode of Booking
- 7.2.1. Third party online portals
- 7.2.2. Direct / captive portals
- 7.1. Market Analysis, Insights and Forecast - by Platform
- 8. South America Online Travel Industry Analysis, Insights and Forecast, 2020-2032
- 8.1. Market Analysis, Insights and Forecast - by Platform
- 8.1.1. Mobile Application
- 8.1.2. Website
- 8.2. Market Analysis, Insights and Forecast - by Mode of Booking
- 8.2.1. Third party online portals
- 8.2.2. Direct / captive portals
- 8.1. Market Analysis, Insights and Forecast - by Platform
- 9. Europe Online Travel Industry Analysis, Insights and Forecast, 2020-2032
- 9.1. Market Analysis, Insights and Forecast - by Platform
- 9.1.1. Mobile Application
- 9.1.2. Website
- 9.2. Market Analysis, Insights and Forecast - by Mode of Booking
- 9.2.1. Third party online portals
- 9.2.2. Direct / captive portals
- 9.1. Market Analysis, Insights and Forecast - by Platform
- 10. Middle East & Africa Online Travel Industry Analysis, Insights and Forecast, 2020-2032
- 10.1. Market Analysis, Insights and Forecast - by Platform
- 10.1.1. Mobile Application
- 10.1.2. Website
- 10.2. Market Analysis, Insights and Forecast - by Mode of Booking
- 10.2.1. Third party online portals
- 10.2.2. Direct / captive portals
- 10.1. Market Analysis, Insights and Forecast - by Platform
- 11. Asia Pacific Online Travel Industry Analysis, Insights and Forecast, 2020-2032
- 11.1. Market Analysis, Insights and Forecast - by Platform
- 11.1.1. Mobile Application
- 11.1.2. Website
- 11.2. Market Analysis, Insights and Forecast - by Mode of Booking
- 11.2.1. Third party online portals
- 11.2.2. Direct / captive portals
- 11.1. Market Analysis, Insights and Forecast - by Platform
- 12. Competitive Analysis
- 12.1. Company Profiles
- 12.1.1 Trip com Group Ltd
- 12.1.1.1. Company Overview
- 12.1.1.2. Products
- 12.1.1.3. Company Financials
- 12.1.1.4. SWOT Analysis
- 12.1.2 Intercontinental Hotels Group*List Not Exhaustive
- 12.1.2.1. Company Overview
- 12.1.2.2. Products
- 12.1.2.3. Company Financials
- 12.1.2.4. SWOT Analysis
- 12.1.3 Tripadvisor Inc
- 12.1.3.1. Company Overview
- 12.1.3.2. Products
- 12.1.3.3. Company Financials
- 12.1.3.4. SWOT Analysis
- 12.1.4 Agoda
- 12.1.4.1. Company Overview
- 12.1.4.2. Products
- 12.1.4.3. Company Financials
- 12.1.4.4. SWOT Analysis
- 12.1.5 Expedia Group Inc
- 12.1.5.1. Company Overview
- 12.1.5.2. Products
- 12.1.5.3. Company Financials
- 12.1.5.4. SWOT Analysis
- 12.1.6 Traveloka Indonesia PT
- 12.1.6.1. Company Overview
- 12.1.6.2. Products
- 12.1.6.3. Company Financials
- 12.1.6.4. SWOT Analysis
- 12.1.7 HRS GmbH
- 12.1.7.1. Company Overview
- 12.1.7.2. Products
- 12.1.7.3. Company Financials
- 12.1.7.4. SWOT Analysis
- 12.1.8 Oravel Stays Pvt Ltd
- 12.1.8.1. Company Overview
- 12.1.8.2. Products
- 12.1.8.3. Company Financials
- 12.1.8.4. SWOT Analysis
- 12.1.9 Airbnb Inc
- 12.1.9.1. Company Overview
- 12.1.9.2. Products
- 12.1.9.3. Company Financials
- 12.1.9.4. SWOT Analysis
- 12.1.10 Hostelworld Group
- 12.1.10.1. Company Overview
- 12.1.10.2. Products
- 12.1.10.3. Company Financials
- 12.1.10.4. SWOT Analysis
- 12.1.11 Hotelbeds Group SL
- 12.1.11.1. Company Overview
- 12.1.11.2. Products
- 12.1.11.3. Company Financials
- 12.1.11.4. SWOT Analysis
- 12.1.12 Booking Holdings Inc
- 12.1.12.1. Company Overview
- 12.1.12.2. Products
- 12.1.12.3. Company Financials
- 12.1.12.4. SWOT Analysis
- 12.1.1 Trip com Group Ltd
- 12.2. Market Entropy
- 12.2.1 Company's Key Areas Served
- 12.2.2 Recent Developments
- 12.3. Company Market Share Analysis 2025
- 12.3.1 Top 5 Companies Market Share Analysis
- 12.3.2 Top 3 Companies Market Share Analysis
- 12.4. List of Potential Customers
- 13. Research Methodology
List of Figures
- Figure 1: Global Online Travel Industry Revenue Breakdown (billion, %) by Region 2025 & 2033
- Figure 2: North America Online Travel Industry Revenue (billion), by Platform 2025 & 2033
- Figure 3: North America Online Travel Industry Revenue Share (%), by Platform 2025 & 2033
- Figure 4: North America Online Travel Industry Revenue (billion), by Mode of Booking 2025 & 2033
- Figure 5: North America Online Travel Industry Revenue Share (%), by Mode of Booking 2025 & 2033
- Figure 6: North America Online Travel Industry Revenue (billion), by Country 2025 & 2033
- Figure 7: North America Online Travel Industry Revenue Share (%), by Country 2025 & 2033
- Figure 8: South America Online Travel Industry Revenue (billion), by Platform 2025 & 2033
- Figure 9: South America Online Travel Industry Revenue Share (%), by Platform 2025 & 2033
- Figure 10: South America Online Travel Industry Revenue (billion), by Mode of Booking 2025 & 2033
- Figure 11: South America Online Travel Industry Revenue Share (%), by Mode of Booking 2025 & 2033
- Figure 12: South America Online Travel Industry Revenue (billion), by Country 2025 & 2033
- Figure 13: South America Online Travel Industry Revenue Share (%), by Country 2025 & 2033
- Figure 14: Europe Online Travel Industry Revenue (billion), by Platform 2025 & 2033
- Figure 15: Europe Online Travel Industry Revenue Share (%), by Platform 2025 & 2033
- Figure 16: Europe Online Travel Industry Revenue (billion), by Mode of Booking 2025 & 2033
- Figure 17: Europe Online Travel Industry Revenue Share (%), by Mode of Booking 2025 & 2033
- Figure 18: Europe Online Travel Industry Revenue (billion), by Country 2025 & 2033
- Figure 19: Europe Online Travel Industry Revenue Share (%), by Country 2025 & 2033
- Figure 20: Middle East & Africa Online Travel Industry Revenue (billion), by Platform 2025 & 2033
- Figure 21: Middle East & Africa Online Travel Industry Revenue Share (%), by Platform 2025 & 2033
- Figure 22: Middle East & Africa Online Travel Industry Revenue (billion), by Mode of Booking 2025 & 2033
- Figure 23: Middle East & Africa Online Travel Industry Revenue Share (%), by Mode of Booking 2025 & 2033
- Figure 24: Middle East & Africa Online Travel Industry Revenue (billion), by Country 2025 & 2033
- Figure 25: Middle East & Africa Online Travel Industry Revenue Share (%), by Country 2025 & 2033
- Figure 26: Asia Pacific Online Travel Industry Revenue (billion), by Platform 2025 & 2033
- Figure 27: Asia Pacific Online Travel Industry Revenue Share (%), by Platform 2025 & 2033
- Figure 28: Asia Pacific Online Travel Industry Revenue (billion), by Mode of Booking 2025 & 2033
- Figure 29: Asia Pacific Online Travel Industry Revenue Share (%), by Mode of Booking 2025 & 2033
- Figure 30: Asia Pacific Online Travel Industry Revenue (billion), by Country 2025 & 2033
- Figure 31: Asia Pacific Online Travel Industry Revenue Share (%), by Country 2025 & 2033
List of Tables
- Table 1: Global Online Travel Industry Revenue billion Forecast, by Platform 2020 & 2033
- Table 2: Global Online Travel Industry Revenue billion Forecast, by Mode of Booking 2020 & 2033
- Table 3: Global Online Travel Industry Revenue billion Forecast, by Region 2020 & 2033
- Table 4: Global Online Travel Industry Revenue billion Forecast, by Platform 2020 & 2033
- Table 5: Global Online Travel Industry Revenue billion Forecast, by Mode of Booking 2020 & 2033
- Table 6: Global Online Travel Industry Revenue billion Forecast, by Country 2020 & 2033
- Table 7: United States Online Travel Industry Revenue (billion) Forecast, by Application 2020 & 2033
- Table 8: Canada Online Travel Industry Revenue (billion) Forecast, by Application 2020 & 2033
- Table 9: Mexico Online Travel Industry Revenue (billion) Forecast, by Application 2020 & 2033
- Table 10: Global Online Travel Industry Revenue billion Forecast, by Platform 2020 & 2033
- Table 11: Global Online Travel Industry Revenue billion Forecast, by Mode of Booking 2020 & 2033
- Table 12: Global Online Travel Industry Revenue billion Forecast, by Country 2020 & 2033
- Table 13: Brazil Online Travel Industry Revenue (billion) Forecast, by Application 2020 & 2033
- Table 14: Argentina Online Travel Industry Revenue (billion) Forecast, by Application 2020 & 2033
- Table 15: Rest of South America Online Travel Industry Revenue (billion) Forecast, by Application 2020 & 2033
- Table 16: Global Online Travel Industry Revenue billion Forecast, by Platform 2020 & 2033
- Table 17: Global Online Travel Industry Revenue billion Forecast, by Mode of Booking 2020 & 2033
- Table 18: Global Online Travel Industry Revenue billion Forecast, by Country 2020 & 2033
- Table 19: United Kingdom Online Travel Industry Revenue (billion) Forecast, by Application 2020 & 2033
- Table 20: Germany Online Travel Industry Revenue (billion) Forecast, by Application 2020 & 2033
- Table 21: France Online Travel Industry Revenue (billion) Forecast, by Application 2020 & 2033
- Table 22: Italy Online Travel Industry Revenue (billion) Forecast, by Application 2020 & 2033
- Table 23: Spain Online Travel Industry Revenue (billion) Forecast, by Application 2020 & 2033
- Table 24: Russia Online Travel Industry Revenue (billion) Forecast, by Application 2020 & 2033
- Table 25: Benelux Online Travel Industry Revenue (billion) Forecast, by Application 2020 & 2033
- Table 26: Nordics Online Travel Industry Revenue (billion) Forecast, by Application 2020 & 2033
- Table 27: Rest of Europe Online Travel Industry Revenue (billion) Forecast, by Application 2020 & 2033
- Table 28: Global Online Travel Industry Revenue billion Forecast, by Platform 2020 & 2033
- Table 29: Global Online Travel Industry Revenue billion Forecast, by Mode of Booking 2020 & 2033
- Table 30: Global Online Travel Industry Revenue billion Forecast, by Country 2020 & 2033
- Table 31: Turkey Online Travel Industry Revenue (billion) Forecast, by Application 2020 & 2033
- Table 32: Israel Online Travel Industry Revenue (billion) Forecast, by Application 2020 & 2033
- Table 33: GCC Online Travel Industry Revenue (billion) Forecast, by Application 2020 & 2033
- Table 34: North Africa Online Travel Industry Revenue (billion) Forecast, by Application 2020 & 2033
- Table 35: South Africa Online Travel Industry Revenue (billion) Forecast, by Application 2020 & 2033
- Table 36: Rest of Middle East & Africa Online Travel Industry Revenue (billion) Forecast, by Application 2020 & 2033
- Table 37: Global Online Travel Industry Revenue billion Forecast, by Platform 2020 & 2033
- Table 38: Global Online Travel Industry Revenue billion Forecast, by Mode of Booking 2020 & 2033
- Table 39: Global Online Travel Industry Revenue billion Forecast, by Country 2020 & 2033
- Table 40: China Online Travel Industry Revenue (billion) Forecast, by Application 2020 & 2033
- Table 41: India Online Travel Industry Revenue (billion) Forecast, by Application 2020 & 2033
- Table 42: Japan Online Travel Industry Revenue (billion) Forecast, by Application 2020 & 2033
- Table 43: South Korea Online Travel Industry Revenue (billion) Forecast, by Application 2020 & 2033
- Table 44: ASEAN Online Travel Industry Revenue (billion) Forecast, by Application 2020 & 2033
- Table 45: Oceania Online Travel Industry Revenue (billion) Forecast, by Application 2020 & 2033
- Table 46: Rest of Asia Pacific Online Travel Industry Revenue (billion) Forecast, by Application 2020 & 2033
Frequently Asked Questions
1. What is the projected Compound Annual Growth Rate (CAGR) of the Online Travel Industry?
The projected CAGR is approximately 9.75%.
2. Which companies are prominent players in the Online Travel Industry?
Key companies in the market include Trip com Group Ltd, Intercontinental Hotels Group*List Not Exhaustive, Tripadvisor Inc, Agoda, Expedia Group Inc, Traveloka Indonesia PT, HRS GmbH, Oravel Stays Pvt Ltd, Airbnb Inc, Hostelworld Group, Hotelbeds Group SL, Booking Holdings Inc.
3. What are the main segments of the Online Travel Industry?
The market segments include Platform, Mode of Booking.
4. Can you provide details about the market size?
The market size is estimated to be USD 622.6 billion as of 2022.
5. What are some drivers contributing to market growth?
Increase in Domestic Travel Driving the Market; Growing Tourist Footfall Driving the Market.
6. What are the notable trends driving market growth?
Increasing Internet Penetration has Huge Impact on the Market.
7. Are there any restraints impacting market growth?
Restrictions on Purchases of Number of Products; Customs Regulations and Taxation Policies.
8. Can you provide examples of recent developments in the market?
N/A
9. What pricing options are available for accessing the report?
Pricing options include single-user, multi-user, and enterprise licenses priced at USD 3800, USD 4500, and USD 5800 respectively.
10. Is the market size provided in terms of value or volume?
The market size is provided in terms of value, measured in billion.
11. Are there any specific market keywords associated with the report?
Yes, the market keyword associated with the report is "Online Travel Industry," which aids in identifying and referencing the specific market segment covered.
12. How do I determine which pricing option suits my needs best?
The pricing options vary based on user requirements and access needs. Individual users may opt for single-user licenses, while businesses requiring broader access may choose multi-user or enterprise licenses for cost-effective access to the report.
13. Are there any additional resources or data provided in the Online Travel Industry report?
While the report offers comprehensive insights, it's advisable to review the specific contents or supplementary materials provided to ascertain if additional resources or data are available.
14. How can I stay updated on further developments or reports in the Online Travel Industry?
To stay informed about further developments, trends, and reports in the Online Travel Industry, consider subscribing to industry newsletters, following relevant companies and organizations, or regularly checking reputable industry news sources and publications.
Methodology
Step 1 - Identification of Relevant Samples Size from Population Database


Step 2 - Approaches for Defining Global Market Size (Value, Volume* & Price*)

Note*: In applicable scenarios
Step 3 - Data Sources
Primary Research
- Web Analytics
- Survey Reports
- Research Institute
- Latest Research Reports
- Opinion Leaders
Secondary Research
- Annual Reports
- White Paper
- Latest Press Release
- Industry Association
- Paid Database
- Investor Presentations

Step 4 - Data Triangulation
Involves using different sources of information in order to increase the validity of a study
These sources are likely to be stakeholders in a program - participants, other researchers, program staff, other community members, and so on.
Then we put all data in single framework & apply various statistical tools to find out the dynamic on the market.
During the analysis stage, feedback from the stakeholder groups would be compared to determine areas of agreement as well as areas of divergence