

Key Insights
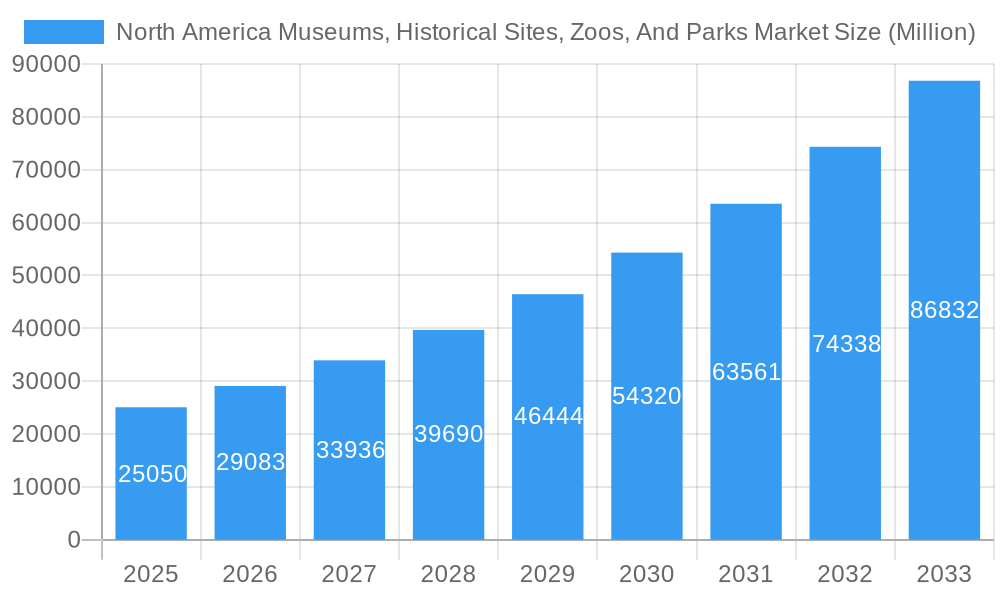
The North American Museums, Historical Sites, Zoos, and Parks market is experiencing robust growth, with a market size of $25.05 billion in 2025 and a projected Compound Annual Growth Rate (CAGR) of 16.08% from 2025 to 2033. This expansion is fueled by several key drivers. Increased disposable incomes and a rising preference for experiential tourism are boosting visitor numbers. The growing popularity of educational tourism, particularly among families, further contributes to market expansion. Innovative exhibit designs, interactive technologies, and enhanced visitor experiences are attracting wider audiences across all segments. Furthermore, strategic partnerships between institutions and local communities contribute to increased accessibility and awareness. While the market faces challenges such as seasonal fluctuations in visitor numbers and competition from other forms of entertainment, the overall outlook remains positive. The diverse range of offerings, from renowned art museums like the National Gallery of Art to iconic national parks like Yellowstone, ensures a broad appeal to diverse demographics. The market is segmented by revenue source (tickets, food and beverages, other revenue streams) and type of institution (museums, historical sites, zoos, botanical gardens, and nature parks), offering opportunities for targeted marketing and investment. The robust growth in the North American region is expected to continue, driven by strong domestic tourism and increasing international visitation.
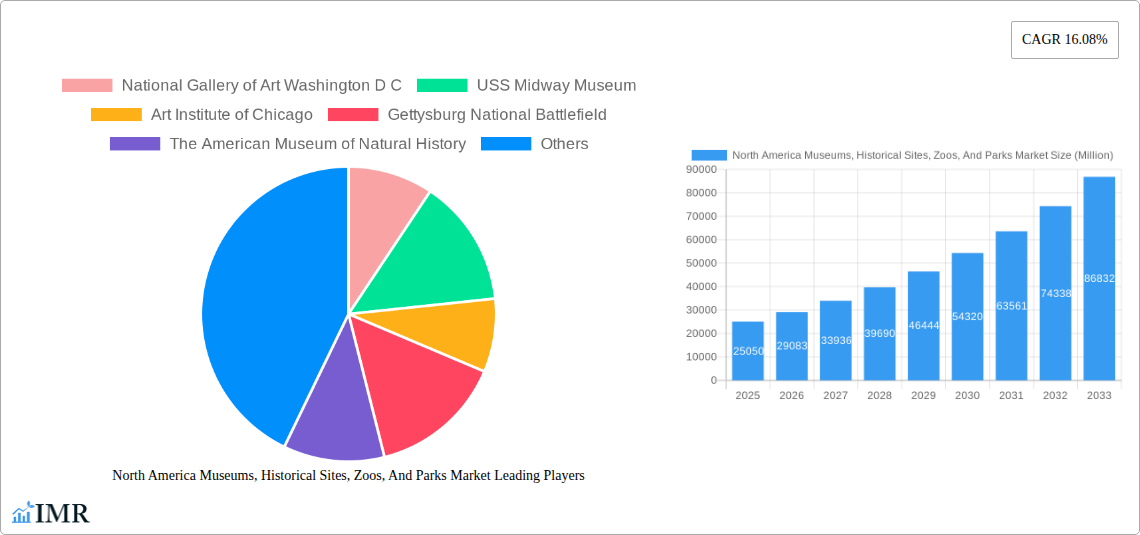
North America Museums, Historical Sites, Zoos, And Parks Market Market Size (In Billion)
The market segmentation reveals significant opportunities. The "tickets" revenue stream consistently holds the largest share, but growth in "food and beverage" and "other revenue sources" (e.g., memberships, educational programs, merchandise) is showing significant promise, suggesting successful diversification strategies by many institutions. The "Museums" segment is a significant contributor, but the strong growth in "Nature Parks" points to the increasing popularity of outdoor recreation and nature-based tourism. This suggests successful diversification strategies are at play. While specific data on individual segments’ market shares is unavailable, projecting based on the overall CAGR and common industry trends suggests a balanced distribution across segments, with significant growth projected across the board. Further research into specific regional trends, competitor analysis, and individual institutional strategies would provide a deeper understanding of the market dynamics.
North America Museums, Historical Sites, Zoos, And Parks Market Company Market Share
North America Museums, Historical Sites, Zoos, and Parks Market: A Comprehensive Report (2019-2033)
This in-depth report provides a comprehensive analysis of the North American Museums, Historical Sites, Zoos, and Parks market, covering the period from 2019 to 2033. The study segments the market by revenue source (tickets, food and beverages, other revenue sources) and type (museums, historical sites, zoos and botanical gardens, nature parks, other similar institutions), offering a granular understanding of this diverse and dynamic sector. The report incorporates detailed financial projections, examining market size, growth trends, and key drivers to provide valuable insights for industry professionals, investors, and stakeholders.
North America Museums, Historical Sites, Zoos, And Parks Market Market Dynamics & Structure
The North American museums, historical sites, zoos, and parks market is characterized by a fragmented structure, with a mix of large, publicly funded institutions and smaller, privately owned entities. Market concentration is relatively low, with no single dominant player controlling a significant share. Technological innovation plays a crucial role, with museums increasingly adopting digital technologies for engagement and accessibility. Regulatory frameworks vary across states and provinces, impacting operational costs and expansion strategies. Competitive substitutes include entertainment alternatives such as theme parks and online experiences. End-user demographics encompass a broad spectrum of ages and socioeconomic groups, although specific segments (e.g., families, educational groups) are more significant for certain institutions. M&A activity is moderate, with occasional consolidations among smaller players seeking economies of scale or enhanced geographic reach.
- Market Concentration: Low, with a large number of players.
- Technological Innovation: Significant impact on engagement and accessibility (e.g., virtual tours, interactive exhibits).
- Regulatory Framework: Varies across regions, impacting operations and expansion.
- Competitive Substitutes: Theme parks, online entertainment, and other leisure activities.
- End-User Demographics: Diverse, with families, educational groups and tourists being major segments.
- M&A Trends: Moderate activity, with smaller players consolidating to increase scale. Estimated annual M&A deal volume: xx (in millions of USD).
North America Museums, Historical Sites, Zoos, And Parks Market Growth Trends & Insights
The North American Museums, Historical Sites, Zoos, and Parks market experienced a period of disruption during 2019-2024 due to the COVID-19 pandemic; however, a robust recovery is underway, driven by pent-up demand and the enduring appeal of these attractions. Market size (in millions of USD) increased from xx million in 2019 to xx million in 2024, with a projected Compound Annual Growth Rate (CAGR) of xx% during the forecast period (2025-2033). Increased adoption of digital technologies and interactive exhibits enhances visitor engagement, while shifting consumer preferences towards experiential tourism drive increased attendance. This growth is anticipated to continue, with the market reaching xx million in 2033. Technological disruptions such as augmented reality and virtual reality are increasingly integrated into exhibits, offering unique and immersive experiences, while the rising popularity of sustainable tourism further influences growth.
Dominant Regions, Countries, or Segments in North America Museums, Historical Sites, Zoos, And Parks Market
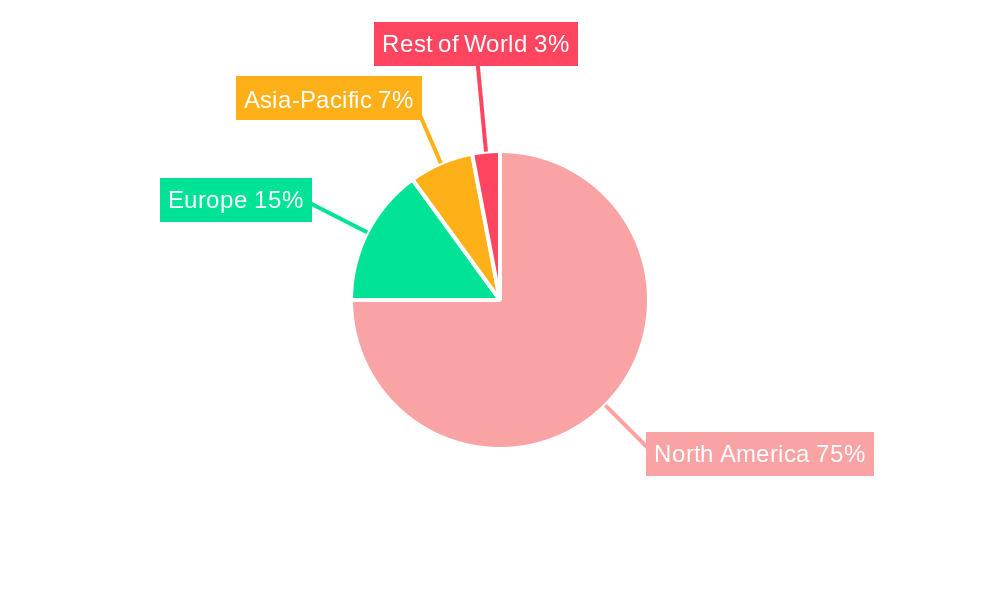
The Northeast and West Coast regions of North America currently dominate the market, driven by high population density, robust tourism infrastructure, and a concentration of major cultural institutions. Within revenue streams, ticket sales remain the largest component, followed by food and beverage sales, and "other revenue sources" (including memberships, educational programs, and merchandise). By type, museums and historical sites contribute the largest share of the overall market revenue followed by Zoos and botanical gardens, while nature parks represent a significant but comparatively smaller segment.
- Key Regional Drivers: High population density, strong tourism infrastructure (Northeast and West Coast).
- Revenue Source Dominance: Ticket sales (xx% market share), followed by Food and Beverages (xx%), and Other Revenue Sources (xx%).
- Type Dominance: Museums (xx% market share) and Historical Sites (xx%) account for the largest share followed by Zoos and Botanical Gardens (xx%). Nature Parks contribute a significant proportion (xx%).
- Growth Potential: Strongest growth is anticipated in the Southern and Southwestern regions, driven by population growth and increased investment in tourism infrastructure.
North America Museums, Historical Sites, Zoos, And Parks Market Product Landscape
The product landscape is characterized by a diverse range of offerings, from traditional museum exhibits to interactive zoos and immersive nature parks. Recent innovations include augmented reality (AR) and virtual reality (VR) experiences that enhance visitor engagement and provide educational value. Improved accessibility features such as audio guides and tactile exhibits cater to a wider audience. Performance metrics such as visitor attendance, revenue generation, and customer satisfaction are key indicators of success. Unique selling propositions focus on the quality of collections, the richness of the visitor experience, and educational or conservation programs.
Key Drivers, Barriers & Challenges in North America Museums, Historical Sites, Zoos, And Parks Market
Key Drivers:
- Increasing disposable incomes and growing interest in leisure and cultural experiences.
- Government support for cultural preservation and tourism promotion.
- Technological advancements enhancing visitor experiences.
- Growing awareness of conservation and sustainability issues.
Key Challenges:
- Economic downturns impacting visitor spending (estimated impact xx million in revenue loss during 2020).
- Intense competition from other forms of entertainment.
- Regulatory burdens and permitting processes for expansion or renovations.
- Maintaining infrastructure and collections (estimated annual maintenance cost: xx million).
- Staffing shortages and rising labor costs.
Emerging Opportunities in North America Museums, Historical Sites, Zoos, And Parks Market
- Development of immersive and interactive exhibits using AR/VR technologies.
- Expansion into underserved markets through partnerships and outreach programs.
- Customized experiences targeting niche interests and demographics.
- Leveraging social media and digital marketing to increase brand visibility.
- Focus on sustainable tourism practices and environmentally friendly operations.
Growth Accelerators in the North America Museums, Historical Sites, Zoos, And Parks Market Industry
Long-term growth will be fueled by continued technological innovation, strategic partnerships with educational institutions and corporations, expansion into new geographic markets, diversification of revenue streams through innovative offerings (such as educational programs and events), and a strong focus on enhancing the overall visitor experience. Strategic investments in infrastructure, accessibility, and sustainability will further contribute to market expansion and profitability.
Key Players Shaping the North America Museums, Historical Sites, Zoos, And Parks Market Market
- National Gallery of Art Washington D C
- USS Midway Museum
- Art Institute of Chicago
- Gettysburg National Battlefield
- The American Museum of Natural History
- The Montreal Museum of Fine Arts
- Art Gallery of Ontario
- Independence Hall
- Museum of Anthropology at UBC
- Houston Zoo
- Jamestown Settlement
- Cincinnati Zoo & Botanical Garden
- Yellowstone National Park
- The Statue of Liberty
Notable Milestones in North America Museums, Historical Sites, Zoos, And Parks Market Sector
- March 2023: The Columbus Zoo and Aquarium and The Wilds announced a $32.5 million capital spending program for improved animal welfare, enhanced guest experiences, and additional lodging. This signifies a commitment to long-term growth and improved visitor experiences.
- January 2023: The Houston Zoo's completion of its $150 million "Keeping Our World Wild" fundraising campaign and subsequent opening of a new Galápagos Islands exhibit demonstrates the potential for substantial investment and growth within the zoo sector.
In-Depth North America Museums, Historical Sites, Zoos, And Parks Market Market Outlook
The North America Museums, Historical Sites, Zoos, and Parks market holds significant potential for future growth, driven by sustained demand for cultural and leisure experiences, technological advancements, and strategic investments in infrastructure and marketing. The increasing emphasis on sustainability and conservation further enhances the appeal of these attractions. Strategic partnerships, innovative programming, and effective marketing strategies will play a crucial role in maximizing market opportunities and achieving long-term success.
North America Museums, Historical Sites, Zoos, And Parks Market Segmentation
-
1. Type
- 1.1. Museums
- 1.2. Historical Sites
- 1.3. Zoos And Botanical Gardens
- 1.4. Nature Parks
- 1.5. Other Similar Institutions
-
2. Revenue Source
- 2.1. Tickets
- 2.2. Food And Beverages
- 2.3. Other Revenue Souces
-
3. Geography
- 3.1. USA
- 3.2. Canada
- 3.3. Rest of North America
North America Museums, Historical Sites, Zoos, And Parks Market Segmentation By Geography
- 1. USA
- 2. Canada
- 3. Rest of North America
North America Museums, Historical Sites, Zoos, And Parks Market Regional Market Share
Geographic Coverage of North America Museums, Historical Sites, Zoos, And Parks Market
North America Museums, Historical Sites, Zoos, And Parks Market REPORT HIGHLIGHTS
| Aspects | Details |
|---|---|
| Study Period | 2020-2034 |
| Base Year | 2025 |
| Estimated Year | 2026 |
| Forecast Period | 2026-2034 |
| Historical Period | 2020-2025 |
| Growth Rate | CAGR of 16.08% from 2020-2034 |
| Segmentation |
|
Table of Contents
- 1. Introduction
- 1.1. Research Scope
- 1.2. Market Segmentation
- 1.3. Research Objective
- 1.4. Definitions and Assumptions
- 2. Executive Summary
- 2.1. Market Snapshot
- 3. Market Dynamics
- 3.1. Market Drivers
- 3.2. Market Restrains
- 3.3. Market Trends
- 3.4. Market Opportunities
- 4. Market Factor Analysis
- 4.1. Porters Five Forces
- 4.1.1. Bargaining Power of Suppliers
- 4.1.2. Bargaining Power of Buyers
- 4.1.3. Threat of New Entrants
- 4.1.4. Threat of Substitutes
- 4.1.5. Competitive Rivalry
- 4.2. PESTEL analysis
- 4.3. BCG Analysis
- 4.3.1. Stars (High Growth, High Market Share)
- 4.3.2. Cash Cows (Low Growth, High Market Share)
- 4.3.3. Question Mark (High Growth, Low Market Share)
- 4.3.4. Dogs (Low Growth, Low Market Share)
- 4.4. Ansoff Matrix Analysis
- 4.5. Supply Chain Analysis
- 4.6. Regulatory Landscape
- 4.7. Current Market Potential and Opportunity Assessment (TAM–SAM–SOM Framework)
- 4.8. IMR Analyst Note
- 4.1. Porters Five Forces
- 5. Market Analysis, Insights and Forecast 2021-2033
- 5.1. Market Analysis, Insights and Forecast - by Type
- 5.1.1. Museums
- 5.1.2. Historical Sites
- 5.1.3. Zoos And Botanical Gardens
- 5.1.4. Nature Parks
- 5.1.5. Other Similar Institutions
- 5.2. Market Analysis, Insights and Forecast - by Revenue Source
- 5.2.1. Tickets
- 5.2.2. Food And Beverages
- 5.2.3. Other Revenue Souces
- 5.3. Market Analysis, Insights and Forecast - by Geography
- 5.3.1. USA
- 5.3.2. Canada
- 5.3.3. Rest of North America
- 5.4. Market Analysis, Insights and Forecast - by Region
- 5.4.1. USA
- 5.4.2. Canada
- 5.4.3. Rest of North America
- 5.1. Market Analysis, Insights and Forecast - by Type
- 6. North America Museums, Historical Sites, Zoos, And Parks Market Analysis, Insights and Forecast, 2021-2033
- 6.1. Market Analysis, Insights and Forecast - by Type
- 6.1.1. Museums
- 6.1.2. Historical Sites
- 6.1.3. Zoos And Botanical Gardens
- 6.1.4. Nature Parks
- 6.1.5. Other Similar Institutions
- 6.2. Market Analysis, Insights and Forecast - by Revenue Source
- 6.2.1. Tickets
- 6.2.2. Food And Beverages
- 6.2.3. Other Revenue Souces
- 6.3. Market Analysis, Insights and Forecast - by Geography
- 6.3.1. USA
- 6.3.2. Canada
- 6.3.3. Rest of North America
- 6.1. Market Analysis, Insights and Forecast - by Type
- 7. USA North America Museums, Historical Sites, Zoos, And Parks Market Analysis, Insights and Forecast, 2020-2032
- 7.1. Market Analysis, Insights and Forecast - by Type
- 7.1.1. Museums
- 7.1.2. Historical Sites
- 7.1.3. Zoos And Botanical Gardens
- 7.1.4. Nature Parks
- 7.1.5. Other Similar Institutions
- 7.2. Market Analysis, Insights and Forecast - by Revenue Source
- 7.2.1. Tickets
- 7.2.2. Food And Beverages
- 7.2.3. Other Revenue Souces
- 7.3. Market Analysis, Insights and Forecast - by Geography
- 7.3.1. USA
- 7.3.2. Canada
- 7.3.3. Rest of North America
- 7.1. Market Analysis, Insights and Forecast - by Type
- 8. Canada North America Museums, Historical Sites, Zoos, And Parks Market Analysis, Insights and Forecast, 2020-2032
- 8.1. Market Analysis, Insights and Forecast - by Type
- 8.1.1. Museums
- 8.1.2. Historical Sites
- 8.1.3. Zoos And Botanical Gardens
- 8.1.4. Nature Parks
- 8.1.5. Other Similar Institutions
- 8.2. Market Analysis, Insights and Forecast - by Revenue Source
- 8.2.1. Tickets
- 8.2.2. Food And Beverages
- 8.2.3. Other Revenue Souces
- 8.3. Market Analysis, Insights and Forecast - by Geography
- 8.3.1. USA
- 8.3.2. Canada
- 8.3.3. Rest of North America
- 8.1. Market Analysis, Insights and Forecast - by Type
- 9. Rest of North America North America Museums, Historical Sites, Zoos, And Parks Market Analysis, Insights and Forecast, 2020-2032
- 9.1. Market Analysis, Insights and Forecast - by Type
- 9.1.1. Museums
- 9.1.2. Historical Sites
- 9.1.3. Zoos And Botanical Gardens
- 9.1.4. Nature Parks
- 9.1.5. Other Similar Institutions
- 9.2. Market Analysis, Insights and Forecast - by Revenue Source
- 9.2.1. Tickets
- 9.2.2. Food And Beverages
- 9.2.3. Other Revenue Souces
- 9.3. Market Analysis, Insights and Forecast - by Geography
- 9.3.1. USA
- 9.3.2. Canada
- 9.3.3. Rest of North America
- 9.1. Market Analysis, Insights and Forecast - by Type
- 10. Competitive Analysis
- 10.1. Company Profiles
- 10.1.1 National Gallery of Art Washington D C
- 10.1.1.1. Company Overview
- 10.1.1.2. Products
- 10.1.1.3. Company Financials
- 10.1.1.4. SWOT Analysis
- 10.1.2 USS Midway Museum
- 10.1.2.1. Company Overview
- 10.1.2.2. Products
- 10.1.2.3. Company Financials
- 10.1.2.4. SWOT Analysis
- 10.1.3 Art Institute of Chicago
- 10.1.3.1. Company Overview
- 10.1.3.2. Products
- 10.1.3.3. Company Financials
- 10.1.3.4. SWOT Analysis
- 10.1.4 Gettysburg National Battlefield
- 10.1.4.1. Company Overview
- 10.1.4.2. Products
- 10.1.4.3. Company Financials
- 10.1.4.4. SWOT Analysis
- 10.1.5 The American Museum of Natural History
- 10.1.5.1. Company Overview
- 10.1.5.2. Products
- 10.1.5.3. Company Financials
- 10.1.5.4. SWOT Analysis
- 10.1.6 The Montreal Museum of Fine Arts
- 10.1.6.1. Company Overview
- 10.1.6.2. Products
- 10.1.6.3. Company Financials
- 10.1.6.4. SWOT Analysis
- 10.1.7 Art Gallery of Ontario
- 10.1.7.1. Company Overview
- 10.1.7.2. Products
- 10.1.7.3. Company Financials
- 10.1.7.4. SWOT Analysis
- 10.1.8 Independence Hall
- 10.1.8.1. Company Overview
- 10.1.8.2. Products
- 10.1.8.3. Company Financials
- 10.1.8.4. SWOT Analysis
- 10.1.9 Museum of Anthropology at UBC
- 10.1.9.1. Company Overview
- 10.1.9.2. Products
- 10.1.9.3. Company Financials
- 10.1.9.4. SWOT Analysis
- 10.1.10 Houston Zoo
- 10.1.10.1. Company Overview
- 10.1.10.2. Products
- 10.1.10.3. Company Financials
- 10.1.10.4. SWOT Analysis
- 10.1.11 Jamestown Settlement
- 10.1.11.1. Company Overview
- 10.1.11.2. Products
- 10.1.11.3. Company Financials
- 10.1.11.4. SWOT Analysis
- 10.1.12 Cincinnati Zoo & Botanical Garden
- 10.1.12.1. Company Overview
- 10.1.12.2. Products
- 10.1.12.3. Company Financials
- 10.1.12.4. SWOT Analysis
- 10.1.13 Yellowstone National Park**List Not Exhaustive
- 10.1.13.1. Company Overview
- 10.1.13.2. Products
- 10.1.13.3. Company Financials
- 10.1.13.4. SWOT Analysis
- 10.1.14 The Statue of Liberty
- 10.1.14.1. Company Overview
- 10.1.14.2. Products
- 10.1.14.3. Company Financials
- 10.1.14.4. SWOT Analysis
- 10.1.1 National Gallery of Art Washington D C
- 10.2. Market Entropy
- 10.2.1 Company's Key Areas Served
- 10.2.2 Recent Developments
- 10.3. Company Market Share Analysis 2025
- 10.3.1 Top 5 Companies Market Share Analysis
- 10.3.2 Top 3 Companies Market Share Analysis
- 10.4. List of Potential Customers
- 11. Research Methodology
List of Figures
- Figure 1: North America Museums, Historical Sites, Zoos, And Parks Market Revenue Breakdown (Million, %) by Product 2025 & 2033
- Figure 2: North America Museums, Historical Sites, Zoos, And Parks Market Share (%) by Company 2025
List of Tables
- Table 1: North America Museums, Historical Sites, Zoos, And Parks Market Revenue Million Forecast, by Type 2020 & 2033
- Table 2: North America Museums, Historical Sites, Zoos, And Parks Market Revenue Million Forecast, by Revenue Source 2020 & 2033
- Table 3: North America Museums, Historical Sites, Zoos, And Parks Market Revenue Million Forecast, by Geography 2020 & 2033
- Table 4: North America Museums, Historical Sites, Zoos, And Parks Market Revenue Million Forecast, by Region 2020 & 2033
- Table 5: North America Museums, Historical Sites, Zoos, And Parks Market Revenue Million Forecast, by Type 2020 & 2033
- Table 6: North America Museums, Historical Sites, Zoos, And Parks Market Revenue Million Forecast, by Revenue Source 2020 & 2033
- Table 7: North America Museums, Historical Sites, Zoos, And Parks Market Revenue Million Forecast, by Geography 2020 & 2033
- Table 8: North America Museums, Historical Sites, Zoos, And Parks Market Revenue Million Forecast, by Country 2020 & 2033
- Table 9: North America Museums, Historical Sites, Zoos, And Parks Market Revenue Million Forecast, by Type 2020 & 2033
- Table 10: North America Museums, Historical Sites, Zoos, And Parks Market Revenue Million Forecast, by Revenue Source 2020 & 2033
- Table 11: North America Museums, Historical Sites, Zoos, And Parks Market Revenue Million Forecast, by Geography 2020 & 2033
- Table 12: North America Museums, Historical Sites, Zoos, And Parks Market Revenue Million Forecast, by Country 2020 & 2033
- Table 13: North America Museums, Historical Sites, Zoos, And Parks Market Revenue Million Forecast, by Type 2020 & 2033
- Table 14: North America Museums, Historical Sites, Zoos, And Parks Market Revenue Million Forecast, by Revenue Source 2020 & 2033
- Table 15: North America Museums, Historical Sites, Zoos, And Parks Market Revenue Million Forecast, by Geography 2020 & 2033
- Table 16: North America Museums, Historical Sites, Zoos, And Parks Market Revenue Million Forecast, by Country 2020 & 2033
Frequently Asked Questions
1. What is the projected Compound Annual Growth Rate (CAGR) of the North America Museums, Historical Sites, Zoos, And Parks Market?
The projected CAGR is approximately 16.08%.
2. Which companies are prominent players in the North America Museums, Historical Sites, Zoos, And Parks Market?
Key companies in the market include National Gallery of Art Washington D C, USS Midway Museum, Art Institute of Chicago, Gettysburg National Battlefield, The American Museum of Natural History, The Montreal Museum of Fine Arts, Art Gallery of Ontario, Independence Hall, Museum of Anthropology at UBC, Houston Zoo, Jamestown Settlement, Cincinnati Zoo & Botanical Garden, Yellowstone National Park**List Not Exhaustive, The Statue of Liberty.
3. What are the main segments of the North America Museums, Historical Sites, Zoos, And Parks Market?
The market segments include Type, Revenue Source, Geography.
4. Can you provide details about the market size?
The market size is estimated to be USD 25.05 Million as of 2022.
5. What are some drivers contributing to market growth?
Growing Tourism Increasing Demand for Hospitality Services; Consistent Demand for Business Travel and Corporate Hospitality Services.
6. What are the notable trends driving market growth?
Significance of Historical Sites Nurturing North America's Cultural and Economic Landscape.
7. Are there any restraints impacting market growth?
Stringent Government Policies and Regulations Limiting the Market Growth; Lack of Skilled Labor is a Challenge for the Market.
8. Can you provide examples of recent developments in the market?
March 2023: The Columbus Zoo and Aquarium and The Wilds, its wildlife conservation center, announced a capital spending program to stretch over the next 12 to 18 months. Projects include improved animal well-being, enhanced guest experiences, and additional lodging. Approximately $32.5 million is set aside for the redevelopment of the North American region.
9. What pricing options are available for accessing the report?
Pricing options include single-user, multi-user, and enterprise licenses priced at USD 4750, USD 5250, and USD 8750 respectively.
10. Is the market size provided in terms of value or volume?
The market size is provided in terms of value, measured in Million.
11. Are there any specific market keywords associated with the report?
Yes, the market keyword associated with the report is "North America Museums, Historical Sites, Zoos, And Parks Market," which aids in identifying and referencing the specific market segment covered.
12. How do I determine which pricing option suits my needs best?
The pricing options vary based on user requirements and access needs. Individual users may opt for single-user licenses, while businesses requiring broader access may choose multi-user or enterprise licenses for cost-effective access to the report.
13. Are there any additional resources or data provided in the North America Museums, Historical Sites, Zoos, And Parks Market report?
While the report offers comprehensive insights, it's advisable to review the specific contents or supplementary materials provided to ascertain if additional resources or data are available.
14. How can I stay updated on further developments or reports in the North America Museums, Historical Sites, Zoos, And Parks Market?
To stay informed about further developments, trends, and reports in the North America Museums, Historical Sites, Zoos, And Parks Market, consider subscribing to industry newsletters, following relevant companies and organizations, or regularly checking reputable industry news sources and publications.
Methodology
Step 1 - Identification of Relevant Samples Size from Population Database


Step 2 - Approaches for Defining Global Market Size (Value, Volume* & Price*)

Note*: In applicable scenarios
Step 3 - Data Sources
Primary Research
- Web Analytics
- Survey Reports
- Research Institute
- Latest Research Reports
- Opinion Leaders
Secondary Research
- Annual Reports
- White Paper
- Latest Press Release
- Industry Association
- Paid Database
- Investor Presentations

Step 4 - Data Triangulation
Involves using different sources of information in order to increase the validity of a study
These sources are likely to be stakeholders in a program - participants, other researchers, program staff, other community members, and so on.
Then we put all data in single framework & apply various statistical tools to find out the dynamic on the market.
During the analysis stage, feedback from the stakeholder groups would be compared to determine areas of agreement as well as areas of divergence