

Key Insights
The Electronically Scanned Array (ESA) radar market is poised for significant expansion, driven by escalating global defense expenditures, the demand for sophisticated surveillance solutions, and the increasing integration of ESA technology across diverse applications such as air traffic management, meteorological services, and autonomous systems. The market is projected to achieve a Compound Annual Growth Rate (CAGR) of 9.7%, building upon its current market size of 12.35 billion as of 2025.
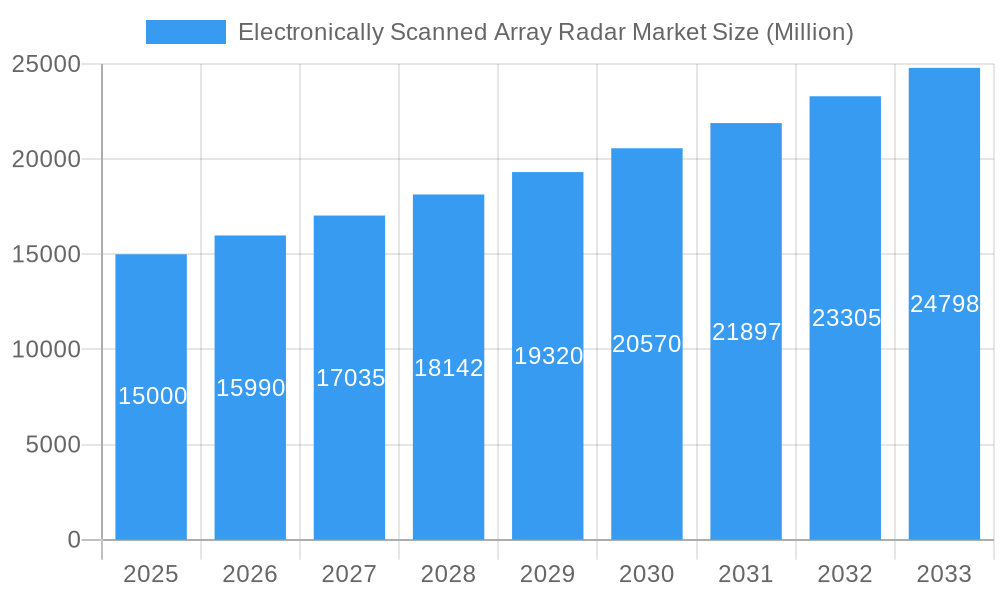
Electronically Scanned Array Radar Market Market Size (In Billion)
Active Electronically Scanned Arrays (AESA) currently lead the market due to their superior performance, including rapid target acquisition, enhanced resolution, and robust electronic countermeasure resistance. Passive Electronically Scanned Arrays (PESA) are also gaining traction in cost-sensitive applications. The land-based sector commands the largest market share, supported by border security initiatives and infrastructure expansion. The air and maritime segments are experiencing robust growth, attributed to military fleet modernization and heightened maritime surveillance needs. Retrofit applications are also expanding, as legacy radar systems are upgraded with ESA technology for improved functionality and extended operational life.
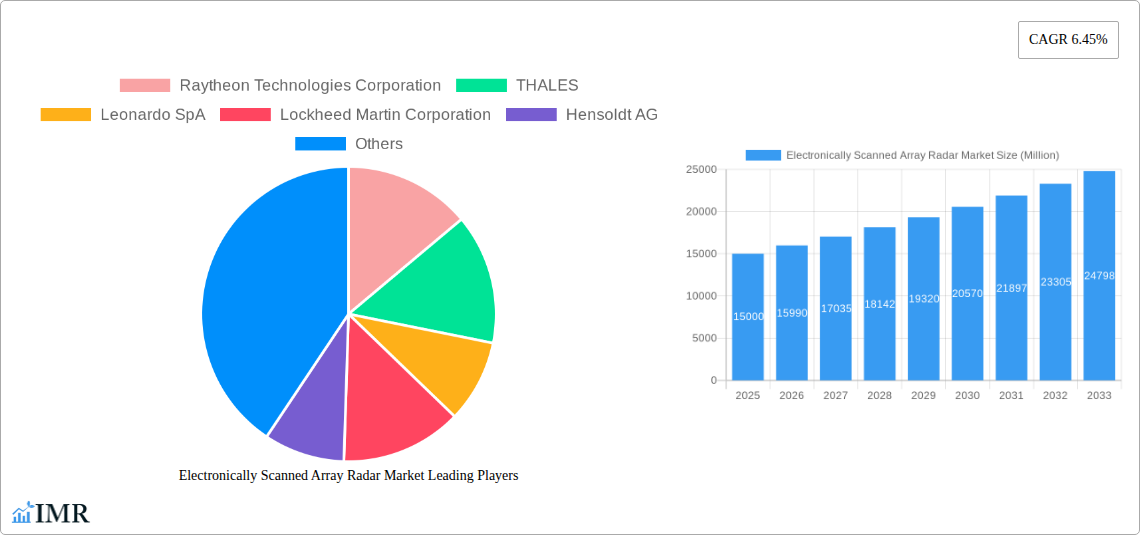
Electronically Scanned Array Radar Market Company Market Share
Market segmentation indicates varied growth trajectories across platforms and deployment types. While the land-based segment is the current leader, the air and sea segments are anticipated to grow at a faster pace, driven by defense modernization programs and maritime security imperatives. Line-fit applications remain crucial, signifying the integration of ESA radar into new platforms. However, the retrofitting of existing systems presents a lucrative opportunity, addressing the need to enhance legacy systems' performance.
Geographically, North America and Europe remain dominant due to substantial defense spending and technological leadership. The Asia-Pacific region is projected to exhibit considerable growth, fueled by increased defense and infrastructure investments in key economies. Emerging markets in the Middle East and Africa are also showing promise, with growing demand for advanced surveillance systems for border security and defense.
Overall, the ESA radar market presents a compelling investment landscape characterized by sustained growth, continuous technological innovation, and widespread application across multiple industries.
Electronically Scanned Array Radar Market: A Comprehensive Report (2019-2033)
This in-depth report provides a comprehensive analysis of the Electronically Scanned Array (ESA) Radar market, encompassing its parent market (defense electronics) and child markets (airborne, naval, land-based radar systems). The study covers the period 2019-2033, with a focus on the forecast period 2025-2033 and a base year of 2025. The report's meticulous analysis empowers industry professionals and investors to make well-informed strategic decisions. The market size is estimated at xx Million USD in 2025 and is projected to reach xx Million USD by 2033.
Electronically Scanned Array Radar Market Market Dynamics & Structure
The Electronically Scanned Array Radar market is characterized by moderate concentration, with key players like Raytheon Technologies Corporation, Thales, and Lockheed Martin holding significant market share. Technological innovation, driven by advancements in Gallium Nitride (GaN) technology and digital beamforming, is a major growth catalyst. Stringent regulatory frameworks regarding defense procurement and cybersecurity influence market dynamics. Competitive substitutes include traditional mechanically scanned radar systems, but ESA radars offer superior performance advantages. The end-user demographics primarily comprise military and defense organizations, with increasing adoption by civilian sectors like air traffic control and weather monitoring. M&A activity has been moderate, with xx major deals recorded between 2019 and 2024, reflecting consolidation efforts within the industry.
- Market Concentration: Moderately concentrated, with top 5 players holding approximately xx% market share in 2024.
- Technological Innovation: GaN technology, digital beamforming, and AI integration are key drivers.
- Regulatory Landscape: Stringent defense procurement regulations and cybersecurity standards impact market growth.
- Competitive Substitutes: Traditional mechanically scanned radars, but ESA offers superior performance.
- End-User Demographics: Primarily military and defense, with growing civilian adoption.
- M&A Activity: xx major deals between 2019-2024, indicating consolidation trends.
Electronically Scanned Array Radar Market Growth Trends & Insights
The ESA Radar market exhibits a robust growth trajectory, driven by increasing defense budgets globally, the demand for enhanced surveillance capabilities, and the advantages of ESA technology over traditional systems. The market experienced a CAGR of xx% during the historical period (2019-2024) and is projected to maintain a CAGR of xx% during the forecast period (2025-2033). This growth is fueled by technological advancements enabling higher resolution, improved accuracy, and enhanced multi-target tracking capabilities. Market penetration remains relatively low in certain regions, indicating significant untapped potential. Consumer behavior shifts towards advanced surveillance and defense systems further propel market expansion. Technological disruptions, such as the integration of AI and machine learning algorithms, are revolutionizing radar capabilities, increasing efficiency, and reducing false alarms. The market size is expected to witness significant expansion, driven by the rising demand for advanced surveillance and defense technologies across the globe.
Dominant Regions, Countries, or Segments in Electronically Scanned Array Radar Market
North America currently dominates the ESA Radar market, driven by substantial defense spending, technological advancements, and the presence of major industry players. Europe and Asia-Pacific are also witnessing significant growth, fueled by increasing modernization of defense infrastructure and growing geopolitical tensions. Within the segments, the Active Electronically Scanned Array (AESA) segment holds the largest market share, owing to its superior performance characteristics. The Air platform segment exhibits the highest growth rate due to increasing demand for advanced airborne surveillance systems. Line fit installations dominate over retrofits currently due to high initial costs associated with retrofitting existing systems.
- Leading Region: North America (xx% market share in 2024)
- Key Growth Drivers:
- North America: High defense spending, technological leadership.
- Europe: Modernization of defense infrastructure, geopolitical concerns.
- Asia-Pacific: Increasing defense budgets, modernization initiatives.
- Dominant Segment: AESA (xx% market share in 2024)
- Fastest-Growing Segment: Air Platform (Projected CAGR of xx% during 2025-2033)
Electronically Scanned Array Radar Market Product Landscape
The ESA radar market showcases a diverse range of products, characterized by continuous innovation in areas such as beamforming techniques, signal processing algorithms, and integration with other sensor systems. Products are tailored to specific applications, exhibiting unique selling propositions based on performance parameters like range, resolution, and sensitivity. Technological advancements include the integration of AI and machine learning for enhanced target identification and tracking capabilities. The emphasis is on miniaturization, reduced power consumption, and improved reliability to meet diverse operational requirements.
Key Drivers, Barriers & Challenges in Electronically Scanned Array Radar Market
Key Drivers:
- Increasing defense budgets globally.
- Growing demand for enhanced surveillance and security.
- Technological advancements in AESA technology.
- Rising geopolitical tensions and cross-border conflicts.
Key Challenges:
- High initial investment costs associated with ESA systems.
- Complex integration processes with existing platforms.
- Potential supply chain disruptions affecting component availability.
- Stringent regulatory compliance requirements.
- Intense competition from established and emerging players. This competition creates pressure on pricing and margins.
Emerging Opportunities in Electronically Scanned Array Radar Market
- Expansion into civilian applications, such as air traffic control and weather monitoring.
- Development of miniaturized and low-power consumption ESA radars for UAVs and other small platforms.
- Integration of ESA radar with other sensor modalities for improved situational awareness.
- Growing demand for advanced radar capabilities in emerging markets.
Growth Accelerators in the Electronically Scanned Array Radar Market Industry
Technological breakthroughs in areas like GaN technology and advanced signal processing are driving long-term growth. Strategic partnerships between radar manufacturers and defense contractors accelerate market penetration. Expansion into new applications and markets, particularly in the civilian sector, is a significant growth catalyst. Governments' increased investments in modernization of defense systems are fueling market expansion.
Key Players Shaping the Electronically Scanned Array Radar Market Market
Notable Milestones in Electronically Scanned Array Radar Market Sector
- March 2023: The Indian Ministry of Defence signed two contracts worth USD 448.44 million with Bharat Electronics Limited (BEL) for radar and warning receivers. This signifies significant investment in radar technology in the region.
- September 2022: Raytheon secured a USD 19.4 million contract to support the APG-79 AESA radar system on F/A-18 aircraft. This highlights continued demand for AESA upgrades in existing platforms.
In-Depth Electronically Scanned Array Radar Market Market Outlook
The ESA Radar market is poised for continued robust growth, driven by technological advancements, increasing defense spending, and expanding applications in both military and civilian sectors. Strategic partnerships and investments in R&D will further accelerate market expansion. The market presents significant opportunities for companies that can develop innovative and cost-effective ESA radar systems. The long-term outlook is positive, with potential for substantial growth in emerging markets and new applications.
Electronically Scanned Array Radar Market Segmentation
- 1. Production Analysis
- 2. Consumption Analysis
- 3. Import Market Analysis (Value & Volume)
- 4. Export Market Analysis (Value & Volume)
- 5. Price Trend Analysis
Electronically Scanned Array Radar Market Segmentation By Geography
-
1. North America
- 1.1. United States
- 1.2. Canada
- 1.3. Mexico
-
2. South America
- 2.1. Brazil
- 2.2. Argentina
- 2.3. Rest of South America
-
3. Europe
- 3.1. United Kingdom
- 3.2. Germany
- 3.3. France
- 3.4. Italy
- 3.5. Spain
- 3.6. Russia
- 3.7. Benelux
- 3.8. Nordics
- 3.9. Rest of Europe
-
4. Middle East & Africa
- 4.1. Turkey
- 4.2. Israel
- 4.3. GCC
- 4.4. North Africa
- 4.5. South Africa
- 4.6. Rest of Middle East & Africa
-
5. Asia Pacific
- 5.1. China
- 5.2. India
- 5.3. Japan
- 5.4. South Korea
- 5.5. ASEAN
- 5.6. Oceania
- 5.7. Rest of Asia Pacific
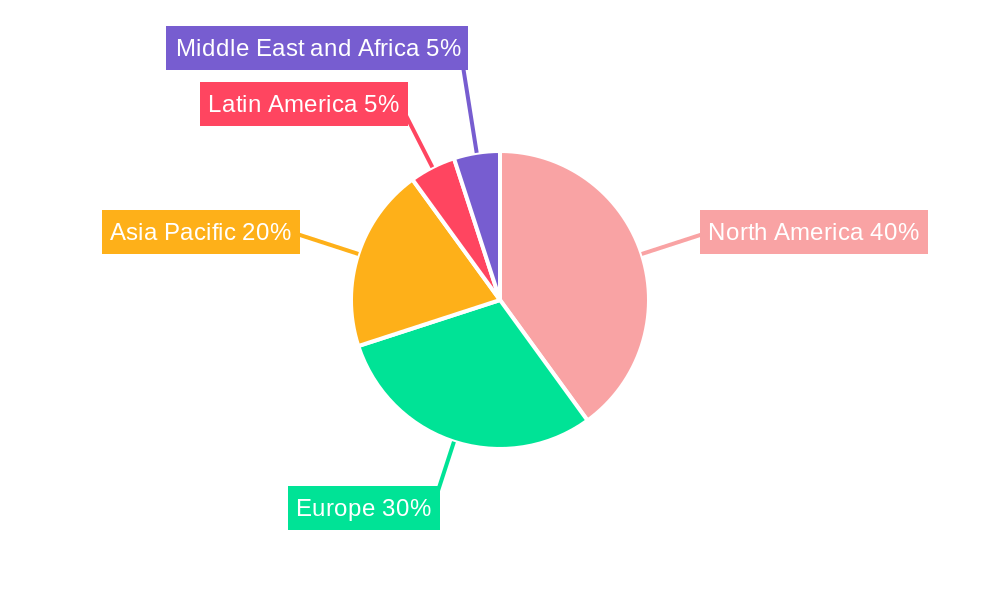
Electronically Scanned Array Radar Market Regional Market Share
Geographic Coverage of Electronically Scanned Array Radar Market
Electronically Scanned Array Radar Market REPORT HIGHLIGHTS
| Aspects | Details |
|---|---|
| Study Period | 2020-2034 |
| Base Year | 2025 |
| Estimated Year | 2026 |
| Forecast Period | 2026-2034 |
| Historical Period | 2020-2025 |
| Growth Rate | CAGR of 9.7% from 2020-2034 |
| Segmentation |
|
Table of Contents
- 1. Introduction
- 1.1. Research Scope
- 1.2. Market Segmentation
- 1.3. Research Objective
- 1.4. Definitions and Assumptions
- 2. Executive Summary
- 2.1. Market Snapshot
- 3. Market Dynamics
- 3.1. Market Drivers
- 3.2. Market Restrains
- 3.3. Market Trends
- 3.4. Market Opportunities
- 4. Market Factor Analysis
- 4.1. Porters Five Forces
- 4.1.1. Bargaining Power of Suppliers
- 4.1.2. Bargaining Power of Buyers
- 4.1.3. Threat of New Entrants
- 4.1.4. Threat of Substitutes
- 4.1.5. Competitive Rivalry
- 4.2. PESTEL analysis
- 4.3. BCG Analysis
- 4.3.1. Stars (High Growth, High Market Share)
- 4.3.2. Cash Cows (Low Growth, High Market Share)
- 4.3.3. Question Mark (High Growth, Low Market Share)
- 4.3.4. Dogs (Low Growth, Low Market Share)
- 4.4. Ansoff Matrix Analysis
- 4.5. Supply Chain Analysis
- 4.6. Regulatory Landscape
- 4.7. Current Market Potential and Opportunity Assessment (TAM–SAM–SOM Framework)
- 4.8. IMR Analyst Note
- 4.1. Porters Five Forces
- 5. Market Analysis, Insights and Forecast 2021-2033
- 5.1. Market Analysis, Insights and Forecast - by Production Analysis
- 5.2. Market Analysis, Insights and Forecast - by Consumption Analysis
- 5.3. Market Analysis, Insights and Forecast - by Import Market Analysis (Value & Volume)
- 5.4. Market Analysis, Insights and Forecast - by Export Market Analysis (Value & Volume)
- 5.5. Market Analysis, Insights and Forecast - by Price Trend Analysis
- 5.6. Market Analysis, Insights and Forecast - by Region
- 5.6.1. North America
- 5.6.2. South America
- 5.6.3. Europe
- 5.6.4. Middle East & Africa
- 5.6.5. Asia Pacific
- 6. Global Electronically Scanned Array Radar Market Analysis, Insights and Forecast, 2021-2033
- 6.1. Market Analysis, Insights and Forecast - by Production Analysis
- 6.2. Market Analysis, Insights and Forecast - by Consumption Analysis
- 6.3. Market Analysis, Insights and Forecast - by Import Market Analysis (Value & Volume)
- 6.4. Market Analysis, Insights and Forecast - by Export Market Analysis (Value & Volume)
- 6.5. Market Analysis, Insights and Forecast - by Price Trend Analysis
- 7. North America Electronically Scanned Array Radar Market Analysis, Insights and Forecast, 2020-2032
- 7.1. Market Analysis, Insights and Forecast - by Production Analysis
- 7.2. Market Analysis, Insights and Forecast - by Consumption Analysis
- 7.3. Market Analysis, Insights and Forecast - by Import Market Analysis (Value & Volume)
- 7.4. Market Analysis, Insights and Forecast - by Export Market Analysis (Value & Volume)
- 7.5. Market Analysis, Insights and Forecast - by Price Trend Analysis
- 8. South America Electronically Scanned Array Radar Market Analysis, Insights and Forecast, 2020-2032
- 8.1. Market Analysis, Insights and Forecast - by Production Analysis
- 8.2. Market Analysis, Insights and Forecast - by Consumption Analysis
- 8.3. Market Analysis, Insights and Forecast - by Import Market Analysis (Value & Volume)
- 8.4. Market Analysis, Insights and Forecast - by Export Market Analysis (Value & Volume)
- 8.5. Market Analysis, Insights and Forecast - by Price Trend Analysis
- 9. Europe Electronically Scanned Array Radar Market Analysis, Insights and Forecast, 2020-2032
- 9.1. Market Analysis, Insights and Forecast - by Production Analysis
- 9.2. Market Analysis, Insights and Forecast - by Consumption Analysis
- 9.3. Market Analysis, Insights and Forecast - by Import Market Analysis (Value & Volume)
- 9.4. Market Analysis, Insights and Forecast - by Export Market Analysis (Value & Volume)
- 9.5. Market Analysis, Insights and Forecast - by Price Trend Analysis
- 10. Middle East & Africa Electronically Scanned Array Radar Market Analysis, Insights and Forecast, 2020-2032
- 10.1. Market Analysis, Insights and Forecast - by Production Analysis
- 10.2. Market Analysis, Insights and Forecast - by Consumption Analysis
- 10.3. Market Analysis, Insights and Forecast - by Import Market Analysis (Value & Volume)
- 10.4. Market Analysis, Insights and Forecast - by Export Market Analysis (Value & Volume)
- 10.5. Market Analysis, Insights and Forecast - by Price Trend Analysis
- 11. Asia Pacific Electronically Scanned Array Radar Market Analysis, Insights and Forecast, 2020-2032
- 11.1. Market Analysis, Insights and Forecast - by Production Analysis
- 11.2. Market Analysis, Insights and Forecast - by Consumption Analysis
- 11.3. Market Analysis, Insights and Forecast - by Import Market Analysis (Value & Volume)
- 11.4. Market Analysis, Insights and Forecast - by Export Market Analysis (Value & Volume)
- 11.5. Market Analysis, Insights and Forecast - by Price Trend Analysis
- 12. Competitive Analysis
- 12.1. Company Profiles
- 12.1.1 Raytheon Technologies Corporation
- 12.1.1.1. Company Overview
- 12.1.1.2. Products
- 12.1.1.3. Company Financials
- 12.1.1.4. SWOT Analysis
- 12.1.2 THALES
- 12.1.2.1. Company Overview
- 12.1.2.2. Products
- 12.1.2.3. Company Financials
- 12.1.2.4. SWOT Analysis
- 12.1.3 Leonardo SpA
- 12.1.3.1. Company Overview
- 12.1.3.2. Products
- 12.1.3.3. Company Financials
- 12.1.3.4. SWOT Analysis
- 12.1.4 Lockheed Martin Corporation
- 12.1.4.1. Company Overview
- 12.1.4.2. Products
- 12.1.4.3. Company Financials
- 12.1.4.4. SWOT Analysis
- 12.1.5 Hensoldt AG
- 12.1.5.1. Company Overview
- 12.1.5.2. Products
- 12.1.5.3. Company Financials
- 12.1.5.4. SWOT Analysis
- 12.1.6 RADA Electronic Industries Ltd
- 12.1.6.1. Company Overview
- 12.1.6.2. Products
- 12.1.6.3. Company Financials
- 12.1.6.4. SWOT Analysis
- 12.1.7 Mitsubishi Electric Corporation
- 12.1.7.1. Company Overview
- 12.1.7.2. Products
- 12.1.7.3. Company Financials
- 12.1.7.4. SWOT Analysis
- 12.1.8 Israel Aerospace Industries
- 12.1.8.1. Company Overview
- 12.1.8.2. Products
- 12.1.8.3. Company Financials
- 12.1.8.4. SWOT Analysis
- 12.1.9 ASELSAN A
- 12.1.9.1. Company Overview
- 12.1.9.2. Products
- 12.1.9.3. Company Financials
- 12.1.9.4. SWOT Analysis
- 12.1.10 CEA Technologies
- 12.1.10.1. Company Overview
- 12.1.10.2. Products
- 12.1.10.3. Company Financials
- 12.1.10.4. SWOT Analysis
- 12.1.11 Northrop Grumman Corporation
- 12.1.11.1. Company Overview
- 12.1.11.2. Products
- 12.1.11.3. Company Financials
- 12.1.11.4. SWOT Analysis
- 12.1.12 Saab AB
- 12.1.12.1. Company Overview
- 12.1.12.2. Products
- 12.1.12.3. Company Financials
- 12.1.12.4. SWOT Analysis
- 12.1.1 Raytheon Technologies Corporation
- 12.2. Market Entropy
- 12.2.1 Company's Key Areas Served
- 12.2.2 Recent Developments
- 12.3. Company Market Share Analysis 2025
- 12.3.1 Top 5 Companies Market Share Analysis
- 12.3.2 Top 3 Companies Market Share Analysis
- 12.4. List of Potential Customers
- 13. Research Methodology
List of Figures
- Figure 1: Global Electronically Scanned Array Radar Market Revenue Breakdown (billion, %) by Region 2025 & 2033
- Figure 2: North America Electronically Scanned Array Radar Market Revenue (billion), by Production Analysis 2025 & 2033
- Figure 3: North America Electronically Scanned Array Radar Market Revenue Share (%), by Production Analysis 2025 & 2033
- Figure 4: North America Electronically Scanned Array Radar Market Revenue (billion), by Consumption Analysis 2025 & 2033
- Figure 5: North America Electronically Scanned Array Radar Market Revenue Share (%), by Consumption Analysis 2025 & 2033
- Figure 6: North America Electronically Scanned Array Radar Market Revenue (billion), by Import Market Analysis (Value & Volume) 2025 & 2033
- Figure 7: North America Electronically Scanned Array Radar Market Revenue Share (%), by Import Market Analysis (Value & Volume) 2025 & 2033
- Figure 8: North America Electronically Scanned Array Radar Market Revenue (billion), by Export Market Analysis (Value & Volume) 2025 & 2033
- Figure 9: North America Electronically Scanned Array Radar Market Revenue Share (%), by Export Market Analysis (Value & Volume) 2025 & 2033
- Figure 10: North America Electronically Scanned Array Radar Market Revenue (billion), by Price Trend Analysis 2025 & 2033
- Figure 11: North America Electronically Scanned Array Radar Market Revenue Share (%), by Price Trend Analysis 2025 & 2033
- Figure 12: North America Electronically Scanned Array Radar Market Revenue (billion), by Country 2025 & 2033
- Figure 13: North America Electronically Scanned Array Radar Market Revenue Share (%), by Country 2025 & 2033
- Figure 14: South America Electronically Scanned Array Radar Market Revenue (billion), by Production Analysis 2025 & 2033
- Figure 15: South America Electronically Scanned Array Radar Market Revenue Share (%), by Production Analysis 2025 & 2033
- Figure 16: South America Electronically Scanned Array Radar Market Revenue (billion), by Consumption Analysis 2025 & 2033
- Figure 17: South America Electronically Scanned Array Radar Market Revenue Share (%), by Consumption Analysis 2025 & 2033
- Figure 18: South America Electronically Scanned Array Radar Market Revenue (billion), by Import Market Analysis (Value & Volume) 2025 & 2033
- Figure 19: South America Electronically Scanned Array Radar Market Revenue Share (%), by Import Market Analysis (Value & Volume) 2025 & 2033
- Figure 20: South America Electronically Scanned Array Radar Market Revenue (billion), by Export Market Analysis (Value & Volume) 2025 & 2033
- Figure 21: South America Electronically Scanned Array Radar Market Revenue Share (%), by Export Market Analysis (Value & Volume) 2025 & 2033
- Figure 22: South America Electronically Scanned Array Radar Market Revenue (billion), by Price Trend Analysis 2025 & 2033
- Figure 23: South America Electronically Scanned Array Radar Market Revenue Share (%), by Price Trend Analysis 2025 & 2033
- Figure 24: South America Electronically Scanned Array Radar Market Revenue (billion), by Country 2025 & 2033
- Figure 25: South America Electronically Scanned Array Radar Market Revenue Share (%), by Country 2025 & 2033
- Figure 26: Europe Electronically Scanned Array Radar Market Revenue (billion), by Production Analysis 2025 & 2033
- Figure 27: Europe Electronically Scanned Array Radar Market Revenue Share (%), by Production Analysis 2025 & 2033
- Figure 28: Europe Electronically Scanned Array Radar Market Revenue (billion), by Consumption Analysis 2025 & 2033
- Figure 29: Europe Electronically Scanned Array Radar Market Revenue Share (%), by Consumption Analysis 2025 & 2033
- Figure 30: Europe Electronically Scanned Array Radar Market Revenue (billion), by Import Market Analysis (Value & Volume) 2025 & 2033
- Figure 31: Europe Electronically Scanned Array Radar Market Revenue Share (%), by Import Market Analysis (Value & Volume) 2025 & 2033
- Figure 32: Europe Electronically Scanned Array Radar Market Revenue (billion), by Export Market Analysis (Value & Volume) 2025 & 2033
- Figure 33: Europe Electronically Scanned Array Radar Market Revenue Share (%), by Export Market Analysis (Value & Volume) 2025 & 2033
- Figure 34: Europe Electronically Scanned Array Radar Market Revenue (billion), by Price Trend Analysis 2025 & 2033
- Figure 35: Europe Electronically Scanned Array Radar Market Revenue Share (%), by Price Trend Analysis 2025 & 2033
- Figure 36: Europe Electronically Scanned Array Radar Market Revenue (billion), by Country 2025 & 2033
- Figure 37: Europe Electronically Scanned Array Radar Market Revenue Share (%), by Country 2025 & 2033
- Figure 38: Middle East & Africa Electronically Scanned Array Radar Market Revenue (billion), by Production Analysis 2025 & 2033
- Figure 39: Middle East & Africa Electronically Scanned Array Radar Market Revenue Share (%), by Production Analysis 2025 & 2033
- Figure 40: Middle East & Africa Electronically Scanned Array Radar Market Revenue (billion), by Consumption Analysis 2025 & 2033
- Figure 41: Middle East & Africa Electronically Scanned Array Radar Market Revenue Share (%), by Consumption Analysis 2025 & 2033
- Figure 42: Middle East & Africa Electronically Scanned Array Radar Market Revenue (billion), by Import Market Analysis (Value & Volume) 2025 & 2033
- Figure 43: Middle East & Africa Electronically Scanned Array Radar Market Revenue Share (%), by Import Market Analysis (Value & Volume) 2025 & 2033
- Figure 44: Middle East & Africa Electronically Scanned Array Radar Market Revenue (billion), by Export Market Analysis (Value & Volume) 2025 & 2033
- Figure 45: Middle East & Africa Electronically Scanned Array Radar Market Revenue Share (%), by Export Market Analysis (Value & Volume) 2025 & 2033
- Figure 46: Middle East & Africa Electronically Scanned Array Radar Market Revenue (billion), by Price Trend Analysis 2025 & 2033
- Figure 47: Middle East & Africa Electronically Scanned Array Radar Market Revenue Share (%), by Price Trend Analysis 2025 & 2033
- Figure 48: Middle East & Africa Electronically Scanned Array Radar Market Revenue (billion), by Country 2025 & 2033
- Figure 49: Middle East & Africa Electronically Scanned Array Radar Market Revenue Share (%), by Country 2025 & 2033
- Figure 50: Asia Pacific Electronically Scanned Array Radar Market Revenue (billion), by Production Analysis 2025 & 2033
- Figure 51: Asia Pacific Electronically Scanned Array Radar Market Revenue Share (%), by Production Analysis 2025 & 2033
- Figure 52: Asia Pacific Electronically Scanned Array Radar Market Revenue (billion), by Consumption Analysis 2025 & 2033
- Figure 53: Asia Pacific Electronically Scanned Array Radar Market Revenue Share (%), by Consumption Analysis 2025 & 2033
- Figure 54: Asia Pacific Electronically Scanned Array Radar Market Revenue (billion), by Import Market Analysis (Value & Volume) 2025 & 2033
- Figure 55: Asia Pacific Electronically Scanned Array Radar Market Revenue Share (%), by Import Market Analysis (Value & Volume) 2025 & 2033
- Figure 56: Asia Pacific Electronically Scanned Array Radar Market Revenue (billion), by Export Market Analysis (Value & Volume) 2025 & 2033
- Figure 57: Asia Pacific Electronically Scanned Array Radar Market Revenue Share (%), by Export Market Analysis (Value & Volume) 2025 & 2033
- Figure 58: Asia Pacific Electronically Scanned Array Radar Market Revenue (billion), by Price Trend Analysis 2025 & 2033
- Figure 59: Asia Pacific Electronically Scanned Array Radar Market Revenue Share (%), by Price Trend Analysis 2025 & 2033
- Figure 60: Asia Pacific Electronically Scanned Array Radar Market Revenue (billion), by Country 2025 & 2033
- Figure 61: Asia Pacific Electronically Scanned Array Radar Market Revenue Share (%), by Country 2025 & 2033
List of Tables
- Table 1: Global Electronically Scanned Array Radar Market Revenue billion Forecast, by Production Analysis 2020 & 2033
- Table 2: Global Electronically Scanned Array Radar Market Revenue billion Forecast, by Consumption Analysis 2020 & 2033
- Table 3: Global Electronically Scanned Array Radar Market Revenue billion Forecast, by Import Market Analysis (Value & Volume) 2020 & 2033
- Table 4: Global Electronically Scanned Array Radar Market Revenue billion Forecast, by Export Market Analysis (Value & Volume) 2020 & 2033
- Table 5: Global Electronically Scanned Array Radar Market Revenue billion Forecast, by Price Trend Analysis 2020 & 2033
- Table 6: Global Electronically Scanned Array Radar Market Revenue billion Forecast, by Region 2020 & 2033
- Table 7: Global Electronically Scanned Array Radar Market Revenue billion Forecast, by Production Analysis 2020 & 2033
- Table 8: Global Electronically Scanned Array Radar Market Revenue billion Forecast, by Consumption Analysis 2020 & 2033
- Table 9: Global Electronically Scanned Array Radar Market Revenue billion Forecast, by Import Market Analysis (Value & Volume) 2020 & 2033
- Table 10: Global Electronically Scanned Array Radar Market Revenue billion Forecast, by Export Market Analysis (Value & Volume) 2020 & 2033
- Table 11: Global Electronically Scanned Array Radar Market Revenue billion Forecast, by Price Trend Analysis 2020 & 2033
- Table 12: Global Electronically Scanned Array Radar Market Revenue billion Forecast, by Country 2020 & 2033
- Table 13: United States Electronically Scanned Array Radar Market Revenue (billion) Forecast, by Application 2020 & 2033
- Table 14: Canada Electronically Scanned Array Radar Market Revenue (billion) Forecast, by Application 2020 & 2033
- Table 15: Mexico Electronically Scanned Array Radar Market Revenue (billion) Forecast, by Application 2020 & 2033
- Table 16: Global Electronically Scanned Array Radar Market Revenue billion Forecast, by Production Analysis 2020 & 2033
- Table 17: Global Electronically Scanned Array Radar Market Revenue billion Forecast, by Consumption Analysis 2020 & 2033
- Table 18: Global Electronically Scanned Array Radar Market Revenue billion Forecast, by Import Market Analysis (Value & Volume) 2020 & 2033
- Table 19: Global Electronically Scanned Array Radar Market Revenue billion Forecast, by Export Market Analysis (Value & Volume) 2020 & 2033
- Table 20: Global Electronically Scanned Array Radar Market Revenue billion Forecast, by Price Trend Analysis 2020 & 2033
- Table 21: Global Electronically Scanned Array Radar Market Revenue billion Forecast, by Country 2020 & 2033
- Table 22: Brazil Electronically Scanned Array Radar Market Revenue (billion) Forecast, by Application 2020 & 2033
- Table 23: Argentina Electronically Scanned Array Radar Market Revenue (billion) Forecast, by Application 2020 & 2033
- Table 24: Rest of South America Electronically Scanned Array Radar Market Revenue (billion) Forecast, by Application 2020 & 2033
- Table 25: Global Electronically Scanned Array Radar Market Revenue billion Forecast, by Production Analysis 2020 & 2033
- Table 26: Global Electronically Scanned Array Radar Market Revenue billion Forecast, by Consumption Analysis 2020 & 2033
- Table 27: Global Electronically Scanned Array Radar Market Revenue billion Forecast, by Import Market Analysis (Value & Volume) 2020 & 2033
- Table 28: Global Electronically Scanned Array Radar Market Revenue billion Forecast, by Export Market Analysis (Value & Volume) 2020 & 2033
- Table 29: Global Electronically Scanned Array Radar Market Revenue billion Forecast, by Price Trend Analysis 2020 & 2033
- Table 30: Global Electronically Scanned Array Radar Market Revenue billion Forecast, by Country 2020 & 2033
- Table 31: United Kingdom Electronically Scanned Array Radar Market Revenue (billion) Forecast, by Application 2020 & 2033
- Table 32: Germany Electronically Scanned Array Radar Market Revenue (billion) Forecast, by Application 2020 & 2033
- Table 33: France Electronically Scanned Array Radar Market Revenue (billion) Forecast, by Application 2020 & 2033
- Table 34: Italy Electronically Scanned Array Radar Market Revenue (billion) Forecast, by Application 2020 & 2033
- Table 35: Spain Electronically Scanned Array Radar Market Revenue (billion) Forecast, by Application 2020 & 2033
- Table 36: Russia Electronically Scanned Array Radar Market Revenue (billion) Forecast, by Application 2020 & 2033
- Table 37: Benelux Electronically Scanned Array Radar Market Revenue (billion) Forecast, by Application 2020 & 2033
- Table 38: Nordics Electronically Scanned Array Radar Market Revenue (billion) Forecast, by Application 2020 & 2033
- Table 39: Rest of Europe Electronically Scanned Array Radar Market Revenue (billion) Forecast, by Application 2020 & 2033
- Table 40: Global Electronically Scanned Array Radar Market Revenue billion Forecast, by Production Analysis 2020 & 2033
- Table 41: Global Electronically Scanned Array Radar Market Revenue billion Forecast, by Consumption Analysis 2020 & 2033
- Table 42: Global Electronically Scanned Array Radar Market Revenue billion Forecast, by Import Market Analysis (Value & Volume) 2020 & 2033
- Table 43: Global Electronically Scanned Array Radar Market Revenue billion Forecast, by Export Market Analysis (Value & Volume) 2020 & 2033
- Table 44: Global Electronically Scanned Array Radar Market Revenue billion Forecast, by Price Trend Analysis 2020 & 2033
- Table 45: Global Electronically Scanned Array Radar Market Revenue billion Forecast, by Country 2020 & 2033
- Table 46: Turkey Electronically Scanned Array Radar Market Revenue (billion) Forecast, by Application 2020 & 2033
- Table 47: Israel Electronically Scanned Array Radar Market Revenue (billion) Forecast, by Application 2020 & 2033
- Table 48: GCC Electronically Scanned Array Radar Market Revenue (billion) Forecast, by Application 2020 & 2033
- Table 49: North Africa Electronically Scanned Array Radar Market Revenue (billion) Forecast, by Application 2020 & 2033
- Table 50: South Africa Electronically Scanned Array Radar Market Revenue (billion) Forecast, by Application 2020 & 2033
- Table 51: Rest of Middle East & Africa Electronically Scanned Array Radar Market Revenue (billion) Forecast, by Application 2020 & 2033
- Table 52: Global Electronically Scanned Array Radar Market Revenue billion Forecast, by Production Analysis 2020 & 2033
- Table 53: Global Electronically Scanned Array Radar Market Revenue billion Forecast, by Consumption Analysis 2020 & 2033
- Table 54: Global Electronically Scanned Array Radar Market Revenue billion Forecast, by Import Market Analysis (Value & Volume) 2020 & 2033
- Table 55: Global Electronically Scanned Array Radar Market Revenue billion Forecast, by Export Market Analysis (Value & Volume) 2020 & 2033
- Table 56: Global Electronically Scanned Array Radar Market Revenue billion Forecast, by Price Trend Analysis 2020 & 2033
- Table 57: Global Electronically Scanned Array Radar Market Revenue billion Forecast, by Country 2020 & 2033
- Table 58: China Electronically Scanned Array Radar Market Revenue (billion) Forecast, by Application 2020 & 2033
- Table 59: India Electronically Scanned Array Radar Market Revenue (billion) Forecast, by Application 2020 & 2033
- Table 60: Japan Electronically Scanned Array Radar Market Revenue (billion) Forecast, by Application 2020 & 2033
- Table 61: South Korea Electronically Scanned Array Radar Market Revenue (billion) Forecast, by Application 2020 & 2033
- Table 62: ASEAN Electronically Scanned Array Radar Market Revenue (billion) Forecast, by Application 2020 & 2033
- Table 63: Oceania Electronically Scanned Array Radar Market Revenue (billion) Forecast, by Application 2020 & 2033
- Table 64: Rest of Asia Pacific Electronically Scanned Array Radar Market Revenue (billion) Forecast, by Application 2020 & 2033
Frequently Asked Questions
1. What is the projected Compound Annual Growth Rate (CAGR) of the Electronically Scanned Array Radar Market?
The projected CAGR is approximately 9.7%.
2. Which companies are prominent players in the Electronically Scanned Array Radar Market?
Key companies in the market include Raytheon Technologies Corporation, THALES, Leonardo SpA, Lockheed Martin Corporation, Hensoldt AG, RADA Electronic Industries Ltd, Mitsubishi Electric Corporation, Israel Aerospace Industries, ASELSAN A, CEA Technologies, Northrop Grumman Corporation, Saab AB.
3. What are the main segments of the Electronically Scanned Array Radar Market?
The market segments include Production Analysis, Consumption Analysis, Import Market Analysis (Value & Volume), Export Market Analysis (Value & Volume), Price Trend Analysis.
4. Can you provide details about the market size?
The market size is estimated to be USD 12.35 billion as of 2022.
5. What are some drivers contributing to market growth?
; Increasing Number Of Air Passengers; Use Of Portable Electronic Devices.
6. What are the notable trends driving market growth?
Active Electronically Scanned Array Segment to Dominate the Market During the Forecast Period.
7. Are there any restraints impacting market growth?
; High Cost Of Connectivity Equipments.
8. Can you provide examples of recent developments in the market?
In March 2023, The Indian Ministry of Defence (MoD) signed two contracts worth USD448.44m with the government-owned aerospace and defense electronics company Bharat Electronics Limited (BEL) to provide radar and warning receivers for Indian Air Force.
9. What pricing options are available for accessing the report?
Pricing options include single-user, multi-user, and enterprise licenses priced at USD 4750, USD 5250, and USD 8750 respectively.
10. Is the market size provided in terms of value or volume?
The market size is provided in terms of value, measured in billion.
11. Are there any specific market keywords associated with the report?
Yes, the market keyword associated with the report is "Electronically Scanned Array Radar Market," which aids in identifying and referencing the specific market segment covered.
12. How do I determine which pricing option suits my needs best?
The pricing options vary based on user requirements and access needs. Individual users may opt for single-user licenses, while businesses requiring broader access may choose multi-user or enterprise licenses for cost-effective access to the report.
13. Are there any additional resources or data provided in the Electronically Scanned Array Radar Market report?
While the report offers comprehensive insights, it's advisable to review the specific contents or supplementary materials provided to ascertain if additional resources or data are available.
14. How can I stay updated on further developments or reports in the Electronically Scanned Array Radar Market?
To stay informed about further developments, trends, and reports in the Electronically Scanned Array Radar Market, consider subscribing to industry newsletters, following relevant companies and organizations, or regularly checking reputable industry news sources and publications.
Methodology
Step 1 - Identification of Relevant Samples Size from Population Database


Step 2 - Approaches for Defining Global Market Size (Value, Volume* & Price*)

Note*: In applicable scenarios
Step 3 - Data Sources
Primary Research
- Web Analytics
- Survey Reports
- Research Institute
- Latest Research Reports
- Opinion Leaders
Secondary Research
- Annual Reports
- White Paper
- Latest Press Release
- Industry Association
- Paid Database
- Investor Presentations

Step 4 - Data Triangulation
Involves using different sources of information in order to increase the validity of a study
These sources are likely to be stakeholders in a program - participants, other researchers, program staff, other community members, and so on.
Then we put all data in single framework & apply various statistical tools to find out the dynamic on the market.
During the analysis stage, feedback from the stakeholder groups would be compared to determine areas of agreement as well as areas of divergence