

Key Insights
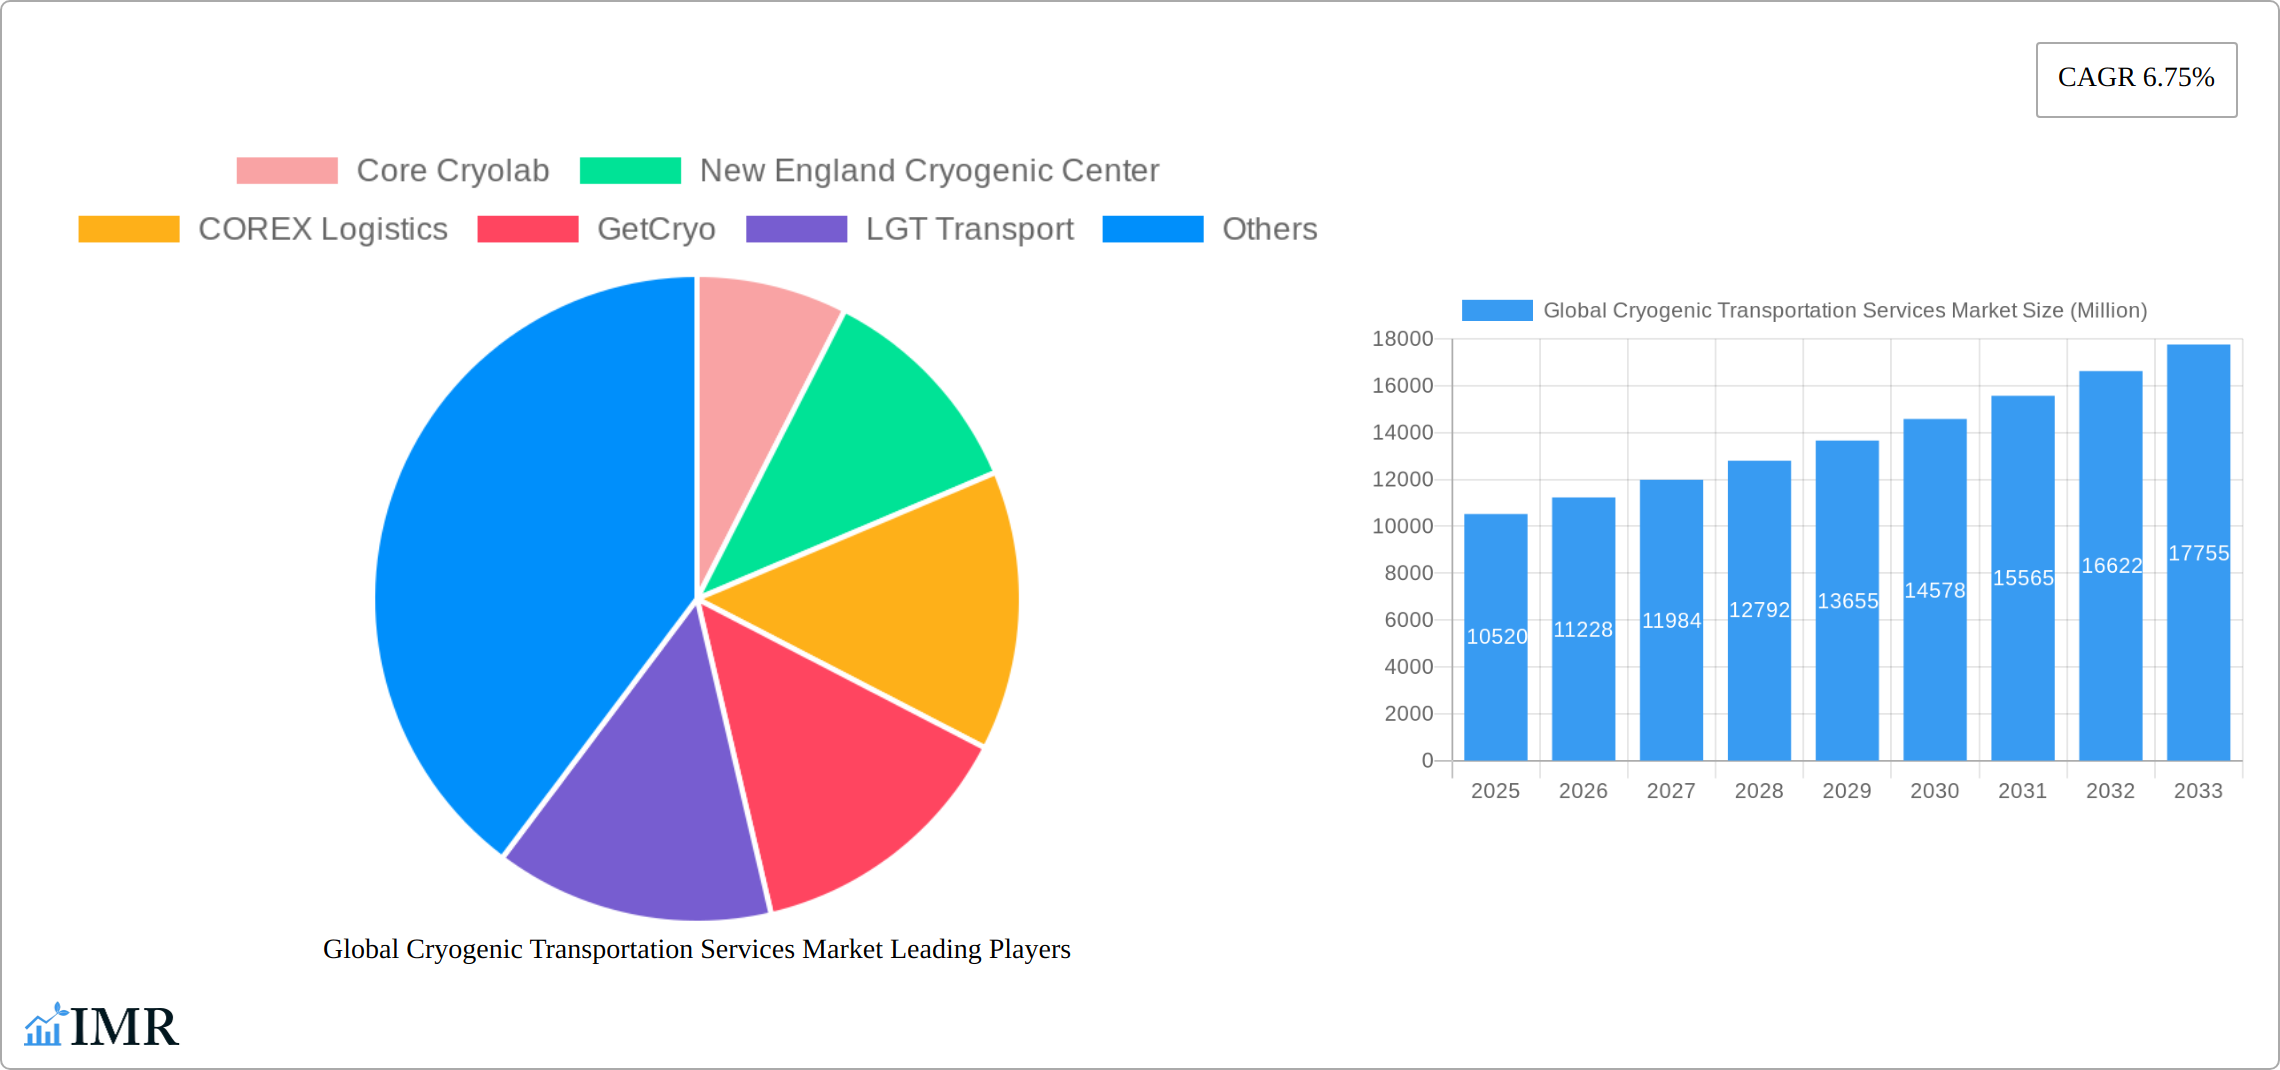
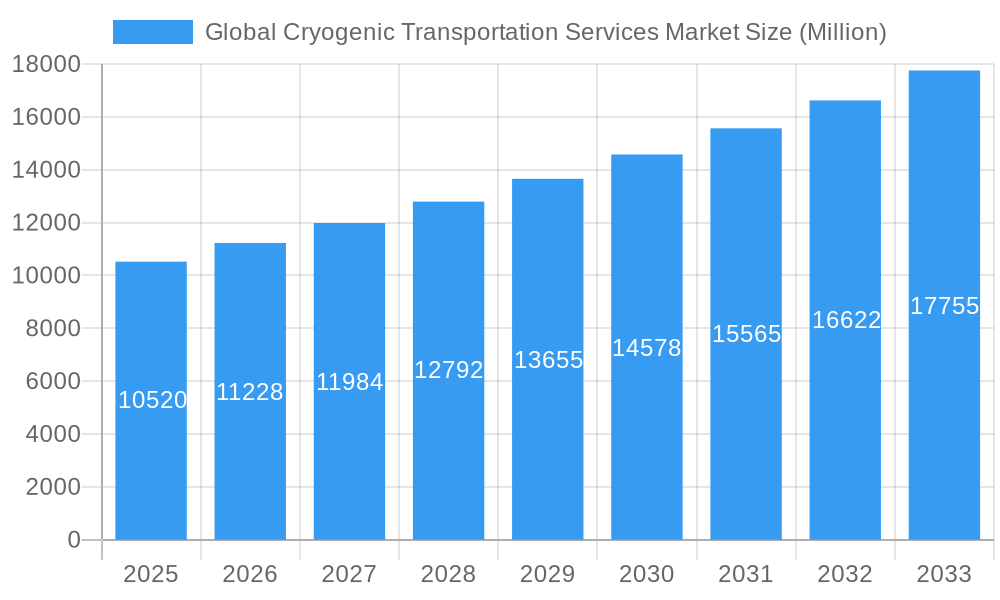
The global cryogenic transportation services market is experiencing robust growth, projected to reach \$10.52 billion in 2025 and maintain a Compound Annual Growth Rate (CAGR) of 6.75% from 2025 to 2033. This expansion is fueled by several key drivers. The increasing demand for cryogenically preserved biological specimens and pharmaceuticals in the healthcare and life sciences sectors is a major catalyst. Furthermore, the rising adoption of cryogenic transportation in the chemical and industrial gas industries for efficient and safe handling of temperature-sensitive materials contributes significantly to market growth. Technological advancements in cryogenic transportation equipment, including improved insulation and monitoring systems, enhance safety and efficiency, further stimulating market expansion. The expansion of the cold chain logistics infrastructure globally, particularly in emerging economies, also facilitates the broader application of cryogenic transportation services. While regulatory hurdles and the high initial investment costs associated with specialized cryogenic equipment pose certain restraints, the overall market outlook remains positive, driven by consistent demand growth across various applications.
Global Cryogenic Transportation Services Market Market Size (In Billion)
Geographic distribution reveals a significant concentration of market share in North America and Europe, driven by established infrastructure and a strong presence of key market players. However, the Asia-Pacific region is projected to experience substantial growth in the coming years due to increasing industrialization, healthcare sector expansion, and a rising middle class. This regional shift underscores the growing global need for efficient and reliable cryogenic transportation solutions. The market segmentation by type (trailer and truck transportation) and application (chemicals, drugs, biological specimens, industrial gases, and other applications) highlights diverse opportunities. The increasing prevalence of specialized transportation services tailored to specific cryogenic needs, such as temperature-sensitive drug delivery, is further contributing to market sophistication and expansion. Competitive landscape analysis indicates a mix of large established players and smaller specialized providers, fostering innovation and meeting the evolving requirements of diverse customer segments.
Global Cryogenic Transportation Services Market Company Market Share
Global Cryogenic Transportation Services Market: A Comprehensive Report (2019-2033)
This in-depth report provides a comprehensive analysis of the Global Cryogenic Transportation Services Market, encompassing market dynamics, growth trends, regional analysis, and key player profiles. The report covers the period from 2019 to 2033, with a focus on the forecast period of 2025-2033 and a base year of 2025. The market is segmented by type (Trailer Transportation, Truck Transportation) and application (Chemicals, Drugs, Biological Specimens, Industrial Gases, Other Applications), offering granular insights into the various market segments and their growth trajectories. The total market size is projected to reach xx Million by 2033.
Global Cryogenic Transportation Services Market Dynamics & Structure
The global cryogenic transportation services market exhibits a moderately concentrated structure, with several key players commanding significant market share. Technological innovation, particularly in cryogenic container design and temperature monitoring systems, is a key driver. Stringent regulatory frameworks concerning the safe transport of temperature-sensitive goods, particularly pharmaceuticals and biological specimens, significantly impact market dynamics. Competition from alternative transportation methods, such as air freight for time-sensitive deliveries, poses a challenge. The end-user demographics are diverse, encompassing pharmaceutical companies, healthcare providers, industrial gas manufacturers, and research institutions. Mergers and acquisitions (M&A) activity in the sector has been relatively moderate in recent years, with a total of xx M&A deals recorded between 2019 and 2024, resulting in a market share shift of approximately xx%.
- Market Concentration: Moderately concentrated, with top 5 players holding approximately xx% market share.
- Technological Innovation: Focus on improved insulation, real-time monitoring, and automated handling systems.
- Regulatory Landscape: Stringent regulations on safety and temperature control, particularly for pharmaceutical products.
- Competitive Substitutes: Air freight, specialized courier services.
- M&A Activity: Moderate activity, with xx deals recorded between 2019 and 2024.
- Innovation Barriers: High initial investment costs for advanced cryogenic transportation equipment.
Global Cryogenic Transportation Services Market Growth Trends & Insights
The global cryogenic transportation services market has witnessed significant growth over the past few years, driven by the increasing demand for temperature-sensitive products across various industries. The market size expanded from xx Million in 2019 to xx Million in 2024, registering a Compound Annual Growth Rate (CAGR) of xx%. This growth is projected to continue, with a forecasted CAGR of xx% from 2025 to 2033. The rising adoption of cryogenic transportation for pharmaceuticals, particularly biologics and vaccines, is a key factor. Technological advancements, such as the development of more efficient and reliable cryogenic containers, are further accelerating market growth. Changing consumer preferences towards specialized and high-quality transportation services for temperature-sensitive goods are also impacting growth. Market penetration is expected to reach xx% by 2033.
Dominant Regions, Countries, or Segments in Global Cryogenic Transportation Services Market
North America currently holds the largest market share in the global cryogenic transportation services market, driven by the strong presence of pharmaceutical and biotechnology companies in the region. Europe follows as a significant market, fueled by the robust healthcare sector and stringent regulatory frameworks. The Asia-Pacific region is exhibiting rapid growth, driven by increasing healthcare spending and expanding pharmaceutical manufacturing.
By Type: The Trailer Transportation segment dominates the market due to its higher capacity and cost-effectiveness for long-distance transportation.
By Application: The pharmaceutical and biological specimens segment currently holds the largest market share, driven by the increasing demand for temperature-sensitive pharmaceuticals and vaccines.
- Key Drivers (North America): Robust pharmaceutical industry, advanced infrastructure, stringent regulations.
- Key Drivers (Europe): Strong healthcare sector, supportive government policies, high adoption of advanced technologies.
- Key Drivers (Asia-Pacific): Rapid growth in healthcare spending, increasing pharmaceutical manufacturing, emerging economies.
Global Cryogenic Transportation Services Market Product Landscape
The cryogenic transportation services market is characterized by a diverse and evolving product landscape, primarily centered around specialized cryogenic trailers and trucks. These vehicles are engineered with sophisticated temperature monitoring and control systems to maintain ultra-low temperatures essential for transporting sensitive materials like liquefied gases, pharmaceuticals, and biological samples. Recent innovations are significantly enhancing the efficiency and reliability of these solutions. Emphasis is placed on developing superior insulation technologies to minimize heat ingress and reduce energy consumption during transit. Furthermore, advancements in telematics and IoT integration are becoming standard, offering real-time GPS tracking, detailed temperature data logging, and remote monitoring capabilities. These technological enhancements empower logistics providers with granular control over the supply chain, ensuring the integrity and security of transported goods and ultimately bolstering the overall safety and dependability of cryogenic transportation operations.
Key Drivers, Barriers & Challenges in Global Cryogenic Transportation Services Market
Key Drivers:
- Growing demand for temperature-sensitive pharmaceuticals and biological products.
- Technological advancements leading to more efficient and reliable cryogenic containers.
- Stringent regulations driving the need for specialized transportation solutions.
Key Challenges and Restraints:
- High initial investment costs for specialized equipment.
- Potential for supply chain disruptions due to geopolitical events and natural disasters.
- Intense competition from alternative transportation methods.
- Stringent regulatory compliance requirements, which might vary by region.
Emerging Opportunities in Global Cryogenic Transportation Services Market
- Geographic Expansion: Capitalizing on the burgeoning healthcare and life sciences sectors in emerging economies, particularly in Asia-Pacific and Latin America, presents significant growth avenues.
- Technological Integration: The development and deployment of autonomous cryogenic transport solutions and the incorporation of advanced AI for route optimization and predictive maintenance are key future opportunities.
- Sustainable Solutions: Investing in and offering eco-friendly cryogenic transportation methods, such as those utilizing renewable energy sources for refrigeration, will cater to growing environmental consciousness.
- Specialized Application Development: Innovations in transporting new categories of sensitive materials, including advanced cell and gene therapies, lunar exploration supplies, and specialized industrial gases, will unlock novel market segments.
- Digital Transformation: Enhancing end-to-end supply chain visibility through blockchain technology for enhanced traceability and security, and leveraging big data analytics for demand forecasting and operational efficiency, represent substantial opportunities.
Growth Accelerators in the Global Cryogenic Transportation Services Market Industry
The global cryogenic transportation services market is propelled by several key growth accelerators. Technological advancements, including the development of more efficient cryogenic tanks, advanced insulation materials, and sophisticated real-time monitoring systems, are fundamental drivers. Strategic partnerships between specialized logistics providers and key end-users, such as pharmaceutical manufacturers, biotech firms, and medical research institutions, are crucial for expanding service offerings and market reach. Furthermore, the increasing demand for temperature-sensitive products across various sectors, coupled with the expansion into untapped and rapidly developing markets, particularly those with growing healthcare infrastructure and a burgeoning demand for advanced medical treatments, are significant growth catalysts.
Key Players Shaping the Global Cryogenic Transportation Services Market Market
- Core Cryolab
- New England Cryogenic Center
- COREX Logistics
- GetCryo
- LGT Transport
- Applied Cryo Technologies
- US Cryo Carriers
- McCollister's
- Legacy Cryogenic
- KAG
- Texas Gas Transport
- 7 3 Other Companies
- Hingham Moving
- Champion Moving
Notable Milestones in Global Cryogenic Transportation Services Market Sector
- October 2023: COREX Logistics' strategic integration into the Irish Pharmaceutical Health Association underscores its commitment to bolstering its expertise and network within the critical pharmaceutical transport sector, signifying enhanced service capabilities for sensitive shipments.
- September 2023: Core Cryolab's establishment of a second advanced facility highlights a significant expansion in its operational capacity and a reinforced dedication to the paramount importance of sample integrity and safety, catering to increasing demand for specialized cryogenic storage and transport.
- November 2023: Linde plc announced a substantial investment in expanding its liquid hydrogen production capacity, indicating a broader trend of increasing demand for cryogenic industrial gases and the associated transportation infrastructure.
In-Depth Global Cryogenic Transportation Services Market Market Outlook
The global cryogenic transportation services market is projected for robust and sustained growth in the coming years. This upward trajectory is primarily attributed to the escalating demand for temperature-sensitive products, including a wide array of pharmaceuticals, vaccines, specialized industrial gases, and biological materials. Technological innovation remains a cornerstone, with ongoing advancements in cryogenic containment, insulation, and real-time monitoring systems continually enhancing efficiency, safety, and reliability. The expansion of healthcare and research sectors, especially in emerging economies, along with the increasing adoption of advanced therapies requiring stringent cold chain management, will fuel demand. Strategic collaborations between specialized logistics providers and end-users, coupled with significant investments in next-generation cryogenic transportation technologies and sustainable practices, are expected to shape the market landscape. Companies that can offer highly customized, end-to-end integrated logistics solutions, coupled with unparalleled supply chain visibility and robust data security, will be well-positioned to capitalize on the evolving opportunities within this dynamic market.
Global Cryogenic Transportation Services Market Segmentation
-
1. Type
- 1.1. Trailer Transportation
- 1.2. Truck Transportation
-
2. Application
- 2.1. Chemicals
- 2.2. Drug
- 2.3. Biological Specimens
- 2.4. Industrial Gases
- 2.5. Other Applications
Global Cryogenic Transportation Services Market Segmentation By Geography
-
1. North America
- 1.1. United States
- 1.2. Canada
- 1.3. Mexico
-
2. Europe
- 2.1. Germany
- 2.2. France
- 2.3. Italy
- 2.4. United Kingdom
- 2.5. Spain
- 2.6. Rest of Europe
-
3. Asia Pacific
- 3.1. China
- 3.2. India
- 3.3. Japan
- 3.4. Australia
- 3.5. Singapore
- 3.6. Indonesia
- 3.7. South Korea
- 3.8. Malaysia
- 3.9. Rest of Asia Pacific
-
4. Middle East and Africa
- 4.1. Saudi Arabia
- 4.2. Qatar
- 4.3. Oman
- 4.4. Rest of Middle East and Africa
-
5. Latin America
- 5.1. Brazil
- 5.2. Argentina
- 5.3. Chile
- 5.4. Rest of Latin America
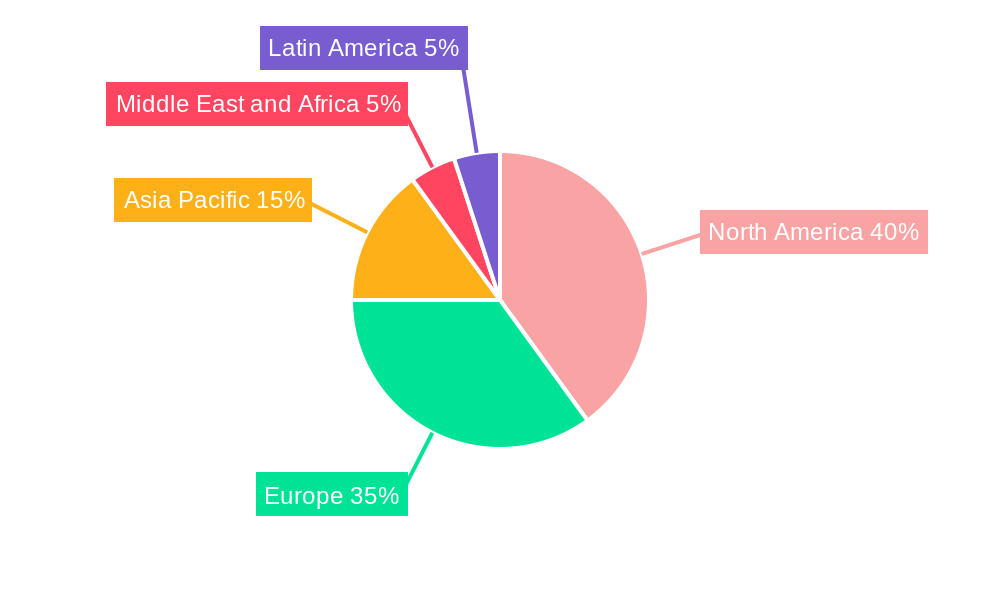
Global Cryogenic Transportation Services Market Regional Market Share
Geographic Coverage of Global Cryogenic Transportation Services Market
Global Cryogenic Transportation Services Market REPORT HIGHLIGHTS
| Aspects | Details |
|---|---|
| Study Period | 2020-2034 |
| Base Year | 2025 |
| Estimated Year | 2026 |
| Forecast Period | 2026-2034 |
| Historical Period | 2020-2025 |
| Growth Rate | CAGR of 6.75% from 2020-2034 |
| Segmentation |
|
Table of Contents
- 1. Introduction
- 1.1. Research Scope
- 1.2. Market Segmentation
- 1.3. Research Objective
- 1.4. Definitions and Assumptions
- 2. Executive Summary
- 2.1. Market Snapshot
- 3. Market Dynamics
- 3.1. Market Drivers
- 3.2. Market Restrains
- 3.3. Market Trends
- 3.4. Market Opportunities
- 4. Market Factor Analysis
- 4.1. Porters Five Forces
- 4.1.1. Bargaining Power of Suppliers
- 4.1.2. Bargaining Power of Buyers
- 4.1.3. Threat of New Entrants
- 4.1.4. Threat of Substitutes
- 4.1.5. Competitive Rivalry
- 4.2. PESTEL analysis
- 4.3. BCG Analysis
- 4.3.1. Stars (High Growth, High Market Share)
- 4.3.2. Cash Cows (Low Growth, High Market Share)
- 4.3.3. Question Mark (High Growth, Low Market Share)
- 4.3.4. Dogs (Low Growth, Low Market Share)
- 4.4. Ansoff Matrix Analysis
- 4.5. Supply Chain Analysis
- 4.6. Regulatory Landscape
- 4.7. Current Market Potential and Opportunity Assessment (TAM–SAM–SOM Framework)
- 4.8. IMR Analyst Note
- 4.1. Porters Five Forces
- 5. Market Analysis, Insights and Forecast 2021-2033
- 5.1. Market Analysis, Insights and Forecast - by Type
- 5.1.1. Trailer Transportation
- 5.1.2. Truck Transportation
- 5.2. Market Analysis, Insights and Forecast - by Application
- 5.2.1. Chemicals
- 5.2.2. Drug
- 5.2.3. Biological Specimens
- 5.2.4. Industrial Gases
- 5.2.5. Other Applications
- 5.3. Market Analysis, Insights and Forecast - by Region
- 5.3.1. North America
- 5.3.2. Europe
- 5.3.3. Asia Pacific
- 5.3.4. Middle East and Africa
- 5.3.5. Latin America
- 5.1. Market Analysis, Insights and Forecast - by Type
- 6. Global Cryogenic Transportation Services Market Analysis, Insights and Forecast, 2021-2033
- 6.1. Market Analysis, Insights and Forecast - by Type
- 6.1.1. Trailer Transportation
- 6.1.2. Truck Transportation
- 6.2. Market Analysis, Insights and Forecast - by Application
- 6.2.1. Chemicals
- 6.2.2. Drug
- 6.2.3. Biological Specimens
- 6.2.4. Industrial Gases
- 6.2.5. Other Applications
- 6.1. Market Analysis, Insights and Forecast - by Type
- 7. North America Global Cryogenic Transportation Services Market Analysis, Insights and Forecast, 2020-2032
- 7.1. Market Analysis, Insights and Forecast - by Type
- 7.1.1. Trailer Transportation
- 7.1.2. Truck Transportation
- 7.2. Market Analysis, Insights and Forecast - by Application
- 7.2.1. Chemicals
- 7.2.2. Drug
- 7.2.3. Biological Specimens
- 7.2.4. Industrial Gases
- 7.2.5. Other Applications
- 7.1. Market Analysis, Insights and Forecast - by Type
- 8. Europe Global Cryogenic Transportation Services Market Analysis, Insights and Forecast, 2020-2032
- 8.1. Market Analysis, Insights and Forecast - by Type
- 8.1.1. Trailer Transportation
- 8.1.2. Truck Transportation
- 8.2. Market Analysis, Insights and Forecast - by Application
- 8.2.1. Chemicals
- 8.2.2. Drug
- 8.2.3. Biological Specimens
- 8.2.4. Industrial Gases
- 8.2.5. Other Applications
- 8.1. Market Analysis, Insights and Forecast - by Type
- 9. Asia Pacific Global Cryogenic Transportation Services Market Analysis, Insights and Forecast, 2020-2032
- 9.1. Market Analysis, Insights and Forecast - by Type
- 9.1.1. Trailer Transportation
- 9.1.2. Truck Transportation
- 9.2. Market Analysis, Insights and Forecast - by Application
- 9.2.1. Chemicals
- 9.2.2. Drug
- 9.2.3. Biological Specimens
- 9.2.4. Industrial Gases
- 9.2.5. Other Applications
- 9.1. Market Analysis, Insights and Forecast - by Type
- 10. Middle East and Africa Global Cryogenic Transportation Services Market Analysis, Insights and Forecast, 2020-2032
- 10.1. Market Analysis, Insights and Forecast - by Type
- 10.1.1. Trailer Transportation
- 10.1.2. Truck Transportation
- 10.2. Market Analysis, Insights and Forecast - by Application
- 10.2.1. Chemicals
- 10.2.2. Drug
- 10.2.3. Biological Specimens
- 10.2.4. Industrial Gases
- 10.2.5. Other Applications
- 10.1. Market Analysis, Insights and Forecast - by Type
- 11. Latin America Global Cryogenic Transportation Services Market Analysis, Insights and Forecast, 2020-2032
- 11.1. Market Analysis, Insights and Forecast - by Type
- 11.1.1. Trailer Transportation
- 11.1.2. Truck Transportation
- 11.2. Market Analysis, Insights and Forecast - by Application
- 11.2.1. Chemicals
- 11.2.2. Drug
- 11.2.3. Biological Specimens
- 11.2.4. Industrial Gases
- 11.2.5. Other Applications
- 11.1. Market Analysis, Insights and Forecast - by Type
- 12. Competitive Analysis
- 12.1. Company Profiles
- 12.1.1 Core Cryolab
- 12.1.1.1. Company Overview
- 12.1.1.2. Products
- 12.1.1.3. Company Financials
- 12.1.1.4. SWOT Analysis
- 12.1.2 New England Cryogenic Center
- 12.1.2.1. Company Overview
- 12.1.2.2. Products
- 12.1.2.3. Company Financials
- 12.1.2.4. SWOT Analysis
- 12.1.3 COREX Logistics
- 12.1.3.1. Company Overview
- 12.1.3.2. Products
- 12.1.3.3. Company Financials
- 12.1.3.4. SWOT Analysis
- 12.1.4 GetCryo
- 12.1.4.1. Company Overview
- 12.1.4.2. Products
- 12.1.4.3. Company Financials
- 12.1.4.4. SWOT Analysis
- 12.1.5 LGT Transport
- 12.1.5.1. Company Overview
- 12.1.5.2. Products
- 12.1.5.3. Company Financials
- 12.1.5.4. SWOT Analysis
- 12.1.6 Applied Cryo Technologies
- 12.1.6.1. Company Overview
- 12.1.6.2. Products
- 12.1.6.3. Company Financials
- 12.1.6.4. SWOT Analysis
- 12.1.7 US Cryo Carriers
- 12.1.7.1. Company Overview
- 12.1.7.2. Products
- 12.1.7.3. Company Financials
- 12.1.7.4. SWOT Analysis
- 12.1.8 McCollister's
- 12.1.8.1. Company Overview
- 12.1.8.2. Products
- 12.1.8.3. Company Financials
- 12.1.8.4. SWOT Analysis
- 12.1.9 Legacy Cryogenic
- 12.1.9.1. Company Overview
- 12.1.9.2. Products
- 12.1.9.3. Company Financials
- 12.1.9.4. SWOT Analysis
- 12.1.10 KAG
- 12.1.10.1. Company Overview
- 12.1.10.2. Products
- 12.1.10.3. Company Financials
- 12.1.10.4. SWOT Analysis
- 12.1.11 Texas Gas Transport*7 3 Other Companie
- 12.1.11.1. Company Overview
- 12.1.11.2. Products
- 12.1.11.3. Company Financials
- 12.1.11.4. SWOT Analysis
- 12.1.12 Hingham Moving
- 12.1.12.1. Company Overview
- 12.1.12.2. Products
- 12.1.12.3. Company Financials
- 12.1.12.4. SWOT Analysis
- 12.1.13 Champion Moving
- 12.1.13.1. Company Overview
- 12.1.13.2. Products
- 12.1.13.3. Company Financials
- 12.1.13.4. SWOT Analysis
- 12.1.1 Core Cryolab
- 12.2. Market Entropy
- 12.2.1 Company's Key Areas Served
- 12.2.2 Recent Developments
- 12.3. Company Market Share Analysis 2025
- 12.3.1 Top 5 Companies Market Share Analysis
- 12.3.2 Top 3 Companies Market Share Analysis
- 12.4. List of Potential Customers
- 13. Research Methodology
List of Figures
- Figure 1: Global Global Cryogenic Transportation Services Market Revenue Breakdown (Million, %) by Region 2025 & 2033
- Figure 2: North America Global Cryogenic Transportation Services Market Revenue (Million), by Type 2025 & 2033
- Figure 3: North America Global Cryogenic Transportation Services Market Revenue Share (%), by Type 2025 & 2033
- Figure 4: North America Global Cryogenic Transportation Services Market Revenue (Million), by Application 2025 & 2033
- Figure 5: North America Global Cryogenic Transportation Services Market Revenue Share (%), by Application 2025 & 2033
- Figure 6: North America Global Cryogenic Transportation Services Market Revenue (Million), by Country 2025 & 2033
- Figure 7: North America Global Cryogenic Transportation Services Market Revenue Share (%), by Country 2025 & 2033
- Figure 8: Europe Global Cryogenic Transportation Services Market Revenue (Million), by Type 2025 & 2033
- Figure 9: Europe Global Cryogenic Transportation Services Market Revenue Share (%), by Type 2025 & 2033
- Figure 10: Europe Global Cryogenic Transportation Services Market Revenue (Million), by Application 2025 & 2033
- Figure 11: Europe Global Cryogenic Transportation Services Market Revenue Share (%), by Application 2025 & 2033
- Figure 12: Europe Global Cryogenic Transportation Services Market Revenue (Million), by Country 2025 & 2033
- Figure 13: Europe Global Cryogenic Transportation Services Market Revenue Share (%), by Country 2025 & 2033
- Figure 14: Asia Pacific Global Cryogenic Transportation Services Market Revenue (Million), by Type 2025 & 2033
- Figure 15: Asia Pacific Global Cryogenic Transportation Services Market Revenue Share (%), by Type 2025 & 2033
- Figure 16: Asia Pacific Global Cryogenic Transportation Services Market Revenue (Million), by Application 2025 & 2033
- Figure 17: Asia Pacific Global Cryogenic Transportation Services Market Revenue Share (%), by Application 2025 & 2033
- Figure 18: Asia Pacific Global Cryogenic Transportation Services Market Revenue (Million), by Country 2025 & 2033
- Figure 19: Asia Pacific Global Cryogenic Transportation Services Market Revenue Share (%), by Country 2025 & 2033
- Figure 20: Middle East and Africa Global Cryogenic Transportation Services Market Revenue (Million), by Type 2025 & 2033
- Figure 21: Middle East and Africa Global Cryogenic Transportation Services Market Revenue Share (%), by Type 2025 & 2033
- Figure 22: Middle East and Africa Global Cryogenic Transportation Services Market Revenue (Million), by Application 2025 & 2033
- Figure 23: Middle East and Africa Global Cryogenic Transportation Services Market Revenue Share (%), by Application 2025 & 2033
- Figure 24: Middle East and Africa Global Cryogenic Transportation Services Market Revenue (Million), by Country 2025 & 2033
- Figure 25: Middle East and Africa Global Cryogenic Transportation Services Market Revenue Share (%), by Country 2025 & 2033
- Figure 26: Latin America Global Cryogenic Transportation Services Market Revenue (Million), by Type 2025 & 2033
- Figure 27: Latin America Global Cryogenic Transportation Services Market Revenue Share (%), by Type 2025 & 2033
- Figure 28: Latin America Global Cryogenic Transportation Services Market Revenue (Million), by Application 2025 & 2033
- Figure 29: Latin America Global Cryogenic Transportation Services Market Revenue Share (%), by Application 2025 & 2033
- Figure 30: Latin America Global Cryogenic Transportation Services Market Revenue (Million), by Country 2025 & 2033
- Figure 31: Latin America Global Cryogenic Transportation Services Market Revenue Share (%), by Country 2025 & 2033
List of Tables
- Table 1: Global Cryogenic Transportation Services Market Revenue Million Forecast, by Type 2020 & 2033
- Table 2: Global Cryogenic Transportation Services Market Revenue Million Forecast, by Application 2020 & 2033
- Table 3: Global Cryogenic Transportation Services Market Revenue Million Forecast, by Region 2020 & 2033
- Table 4: Global Cryogenic Transportation Services Market Revenue Million Forecast, by Type 2020 & 2033
- Table 5: Global Cryogenic Transportation Services Market Revenue Million Forecast, by Application 2020 & 2033
- Table 6: Global Cryogenic Transportation Services Market Revenue Million Forecast, by Country 2020 & 2033
- Table 7: United States Global Cryogenic Transportation Services Market Revenue (Million) Forecast, by Application 2020 & 2033
- Table 8: Canada Global Cryogenic Transportation Services Market Revenue (Million) Forecast, by Application 2020 & 2033
- Table 9: Mexico Global Cryogenic Transportation Services Market Revenue (Million) Forecast, by Application 2020 & 2033
- Table 10: Global Cryogenic Transportation Services Market Revenue Million Forecast, by Type 2020 & 2033
- Table 11: Global Cryogenic Transportation Services Market Revenue Million Forecast, by Application 2020 & 2033
- Table 12: Global Cryogenic Transportation Services Market Revenue Million Forecast, by Country 2020 & 2033
- Table 13: Germany Global Cryogenic Transportation Services Market Revenue (Million) Forecast, by Application 2020 & 2033
- Table 14: France Global Cryogenic Transportation Services Market Revenue (Million) Forecast, by Application 2020 & 2033
- Table 15: Italy Global Cryogenic Transportation Services Market Revenue (Million) Forecast, by Application 2020 & 2033
- Table 16: United Kingdom Global Cryogenic Transportation Services Market Revenue (Million) Forecast, by Application 2020 & 2033
- Table 17: Spain Global Cryogenic Transportation Services Market Revenue (Million) Forecast, by Application 2020 & 2033
- Table 18: Rest of Europe Global Cryogenic Transportation Services Market Revenue (Million) Forecast, by Application 2020 & 2033
- Table 19: Global Cryogenic Transportation Services Market Revenue Million Forecast, by Type 2020 & 2033
- Table 20: Global Cryogenic Transportation Services Market Revenue Million Forecast, by Application 2020 & 2033
- Table 21: Global Cryogenic Transportation Services Market Revenue Million Forecast, by Country 2020 & 2033
- Table 22: China Global Cryogenic Transportation Services Market Revenue (Million) Forecast, by Application 2020 & 2033
- Table 23: India Global Cryogenic Transportation Services Market Revenue (Million) Forecast, by Application 2020 & 2033
- Table 24: Japan Global Cryogenic Transportation Services Market Revenue (Million) Forecast, by Application 2020 & 2033
- Table 25: Australia Global Cryogenic Transportation Services Market Revenue (Million) Forecast, by Application 2020 & 2033
- Table 26: Singapore Global Cryogenic Transportation Services Market Revenue (Million) Forecast, by Application 2020 & 2033
- Table 27: Indonesia Global Cryogenic Transportation Services Market Revenue (Million) Forecast, by Application 2020 & 2033
- Table 28: South Korea Global Cryogenic Transportation Services Market Revenue (Million) Forecast, by Application 2020 & 2033
- Table 29: Malaysia Global Cryogenic Transportation Services Market Revenue (Million) Forecast, by Application 2020 & 2033
- Table 30: Rest of Asia Pacific Global Cryogenic Transportation Services Market Revenue (Million) Forecast, by Application 2020 & 2033
- Table 31: Global Cryogenic Transportation Services Market Revenue Million Forecast, by Type 2020 & 2033
- Table 32: Global Cryogenic Transportation Services Market Revenue Million Forecast, by Application 2020 & 2033
- Table 33: Global Cryogenic Transportation Services Market Revenue Million Forecast, by Country 2020 & 2033
- Table 34: Saudi Arabia Global Cryogenic Transportation Services Market Revenue (Million) Forecast, by Application 2020 & 2033
- Table 35: Qatar Global Cryogenic Transportation Services Market Revenue (Million) Forecast, by Application 2020 & 2033
- Table 36: Oman Global Cryogenic Transportation Services Market Revenue (Million) Forecast, by Application 2020 & 2033
- Table 37: Rest of Middle East and Africa Global Cryogenic Transportation Services Market Revenue (Million) Forecast, by Application 2020 & 2033
- Table 38: Global Cryogenic Transportation Services Market Revenue Million Forecast, by Type 2020 & 2033
- Table 39: Global Cryogenic Transportation Services Market Revenue Million Forecast, by Application 2020 & 2033
- Table 40: Global Cryogenic Transportation Services Market Revenue Million Forecast, by Country 2020 & 2033
- Table 41: Brazil Global Cryogenic Transportation Services Market Revenue (Million) Forecast, by Application 2020 & 2033
- Table 42: Argentina Global Cryogenic Transportation Services Market Revenue (Million) Forecast, by Application 2020 & 2033
- Table 43: Chile Global Cryogenic Transportation Services Market Revenue (Million) Forecast, by Application 2020 & 2033
- Table 44: Rest of Latin America Global Cryogenic Transportation Services Market Revenue (Million) Forecast, by Application 2020 & 2033
Frequently Asked Questions
1. What is the projected Compound Annual Growth Rate (CAGR) of the Global Cryogenic Transportation Services Market?
The projected CAGR is approximately 6.75%.
2. Which companies are prominent players in the Global Cryogenic Transportation Services Market?
Key companies in the market include Core Cryolab, New England Cryogenic Center, COREX Logistics, GetCryo, LGT Transport, Applied Cryo Technologies, US Cryo Carriers, McCollister's, Legacy Cryogenic, KAG, Texas Gas Transport*7 3 Other Companie, Hingham Moving, Champion Moving.
3. What are the main segments of the Global Cryogenic Transportation Services Market?
The market segments include Type, Application.
4. Can you provide details about the market size?
The market size is estimated to be USD 10.52 Million as of 2022.
5. What are some drivers contributing to market growth?
Growth of Life Sciences and Healthcare; Expanding Food and Beverage Industry; Growing Focus on Renewable Energy.
6. What are the notable trends driving market growth?
North America Dominates the Global Market Share in the Coming Years.
7. Are there any restraints impacting market growth?
High Initial Investment Costs; Skilled Workforce Shortage; Infrastructure.
8. Can you provide examples of recent developments in the market?
October 2023: COREX Logistics has officially become a member of the Irish Pharmaceutical Health Association, joining industry giants such as Bayer, GlaxoSmithKline, and Eli Lilly in representing the international research-based pharmaceutical industry in Ireland. The members take an active part in strategy development and implementation, helping to shape policy and public debate across areas such as regulation, access, pricing, and health promotion.
9. What pricing options are available for accessing the report?
Pricing options include single-user, multi-user, and enterprise licenses priced at USD 4750, USD 5250, and USD 8750 respectively.
10. Is the market size provided in terms of value or volume?
The market size is provided in terms of value, measured in Million.
11. Are there any specific market keywords associated with the report?
Yes, the market keyword associated with the report is "Global Cryogenic Transportation Services Market," which aids in identifying and referencing the specific market segment covered.
12. How do I determine which pricing option suits my needs best?
The pricing options vary based on user requirements and access needs. Individual users may opt for single-user licenses, while businesses requiring broader access may choose multi-user or enterprise licenses for cost-effective access to the report.
13. Are there any additional resources or data provided in the Global Cryogenic Transportation Services Market report?
While the report offers comprehensive insights, it's advisable to review the specific contents or supplementary materials provided to ascertain if additional resources or data are available.
14. How can I stay updated on further developments or reports in the Global Cryogenic Transportation Services Market?
To stay informed about further developments, trends, and reports in the Global Cryogenic Transportation Services Market, consider subscribing to industry newsletters, following relevant companies and organizations, or regularly checking reputable industry news sources and publications.
Methodology
Step 1 - Identification of Relevant Samples Size from Population Database


Step 2 - Approaches for Defining Global Market Size (Value, Volume* & Price*)

Note*: In applicable scenarios
Step 3 - Data Sources
Primary Research
- Web Analytics
- Survey Reports
- Research Institute
- Latest Research Reports
- Opinion Leaders
Secondary Research
- Annual Reports
- White Paper
- Latest Press Release
- Industry Association
- Paid Database
- Investor Presentations

Step 4 - Data Triangulation
Involves using different sources of information in order to increase the validity of a study
These sources are likely to be stakeholders in a program - participants, other researchers, program staff, other community members, and so on.
Then we put all data in single framework & apply various statistical tools to find out the dynamic on the market.
During the analysis stage, feedback from the stakeholder groups would be compared to determine areas of agreement as well as areas of divergence