

Key Insights
The global marine services industry is experiencing robust growth, projected to maintain a CAGR exceeding 5% from 2025 to 2033. This expansion is fueled by several key drivers. The increasing global trade volume necessitates efficient container handling and port operations, driving demand for container handling services. Simultaneously, the aging global fleet necessitates significant investment in ship repair and maintenance, bolstering this segment's growth. The growth of e-commerce and global supply chains further enhances the demand for integrated logistics solutions and efficient supply chain management within the marine sector. Technological advancements, such as automation and digitalization in port operations and vessel management, are streamlining processes and improving efficiency, contributing to market expansion. Furthermore, the ongoing focus on environmental sustainability is driving investments in eco-friendly shipping practices and technologies, creating new opportunities within the marine services industry. Regional variations exist, with Asia-Pacific expected to maintain a significant market share due to its high concentration of major ports and robust economic growth. However, North America and Europe also contribute substantially, driven by their established shipping infrastructure and focus on efficient logistics.
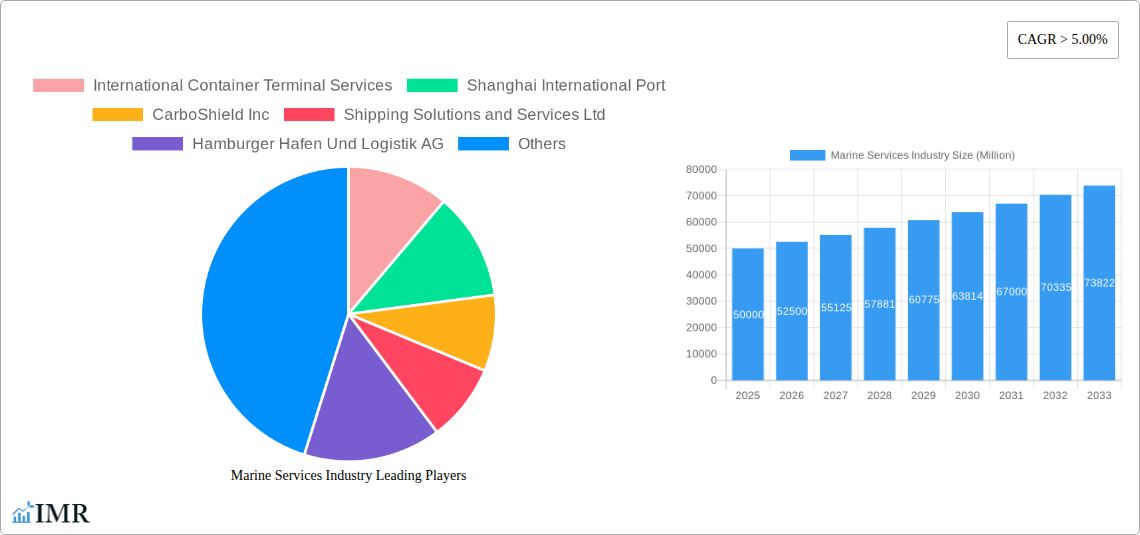
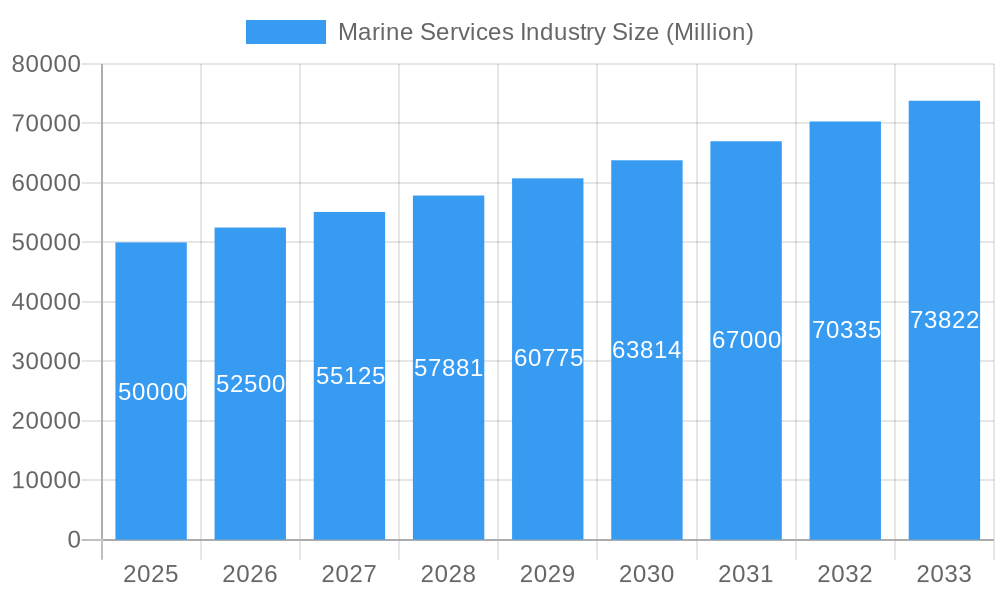
Marine Services Industry Market Size (In Billion)
Despite the positive outlook, the industry faces certain restraints. Fluctuations in global trade volumes due to geopolitical instability or economic downturns can impact demand. Stringent environmental regulations, while driving innovation, can also increase operational costs for companies. The intense competition within the market, particularly amongst large multinational players, necessitates continuous innovation and efficiency improvements to maintain profitability. Furthermore, skilled labor shortages within certain segments of the marine services sector, particularly in specialized areas like ship repair and maintenance, pose a challenge to meeting growing demand. Addressing these challenges requires a concerted effort towards technological advancements, efficient resource allocation, and sustainable practices within the industry. Successful players will leverage advanced technologies and strategic partnerships to navigate the evolving market landscape.
Marine Services Industry Company Market Share
Marine Services Industry Market Report: 2019-2033
This comprehensive report provides an in-depth analysis of the Marine Services industry, encompassing market dynamics, growth trends, regional dominance, product landscapes, key players, and future outlook. With a focus on key segments like Container Handling Services and Logistics Solutions, this report is essential for industry professionals, investors, and strategic decision-makers. The study period covers 2019-2033, with a base year of 2025 and a forecast period of 2025-2033. Market values are presented in millions of units.
Marine Services Industry Market Dynamics & Structure
The global marine services market is characterized by moderate concentration, with a few large players holding significant market share. International Container Terminal Services, DP World Limited, and AP Moller Maersk are among the leading companies, although the market also includes numerous smaller, specialized providers. Market size in 2024 is estimated at xx Million.
- Market Concentration: High, with top 5 players holding approximately xx% market share in 2024.
- Technological Innovation: Driven by automation, digitalization (e.g., IoT, AI), and sustainable technologies (e.g., cleaner fuels). Innovation barriers include high upfront investment costs and regulatory complexities.
- Regulatory Frameworks: Stringent safety and environmental regulations impact operations and investment decisions. Compliance costs represent a significant factor for smaller players.
- Competitive Product Substitutes: Limited direct substitutes exist, but efficiency improvements in other transportation modes (rail, road) pose indirect competition.
- End-User Demographics: The market serves a diverse range of end-users including shipping lines, port authorities, logistics companies, and energy companies.
- M&A Trends: Consolidation is evident, with several large-scale mergers and acquisitions (M&A) observed in recent years. Deal volume in 2019-2024 is estimated at xx deals, valued at xx Million.
Marine Services Industry Growth Trends & Insights
The marine services market is projected to experience steady growth during the forecast period (2025-2033). Growth is fueled by increasing global trade volumes, expanding port infrastructure development, and rising demand for efficient logistics solutions. The market size in 2025 is estimated at xx Million and is projected to reach xx Million by 2033, exhibiting a CAGR of xx%.
- Market Size Evolution: Steady growth driven by global trade and infrastructure development.
- Adoption Rates: High adoption of new technologies in container handling and logistics management.
- Technological Disruptions: Automation, AI, and IoT are reshaping operational efficiency and cost structures.
- Consumer Behavior Shifts: Emphasis on sustainability and reduced environmental impact is influencing service demand.
Dominant Regions, Countries, or Segments in Marine Services Industry
The Asia-Pacific region stands as the undisputed leader in the global marine services market. This dominance is a direct result of its extensive and continuously expanding port infrastructure, coupled with robust economic growth and exceptionally high trade volumes. Within this dynamic landscape, container handling services consistently represent the largest and most significant segment, closely followed by the comprehensive suite of logistics solutions designed to support global trade. The region's strategic importance and scale of operations solidify its preeminent position.
- Key Drivers:
- The relentless pace of economic expansion throughout the Asia-Pacific is a primary catalyst, directly fueling significant investments in port infrastructure development and an ever-increasing flow of trade.
- Strategic and ongoing development of world-class port infrastructure in key nations such as China and across Southeast Asia provides the foundational capacity for maritime trade.
- Supportive government policies at national and regional levels, actively promoting international trade, investment in logistics, and streamlined customs procedures, are crucial enablers of growth.
- Dominance Factors:
- The concentration of the world's busiest ports and critical shipping hubs within the Asia-Pacific is a defining characteristic of its market leadership.
- Substantial and continuous capital investments directed towards modernizing existing port facilities and expanding capacity ensure operational excellence and future readiness.
- The exponential growth of e-commerce and the subsequent surge in demand for efficient and reliable logistics networks further bolster the region's maritime service needs.
Marine Services Industry Product Landscape
The marine services industry encompasses a vast and sophisticated array of offerings, extending from the fundamental operations of container handling and essential ship repair services to highly specialized logistics solutions and critical navigation services. The industry is marked by a continuous drive for innovation, evident in the recent emergence of automated container terminals that optimize throughput, advanced ship maintenance technologies promising greater uptime and reduced costs, and sophisticated logistics platforms that leverage the power of artificial intelligence (AI) and big data analytics for enhanced decision-making and operational visibility. These cutting-edge advancements are collectively focused on significantly improving operational efficiency, driving down costs, and elevating safety standards across all facets of marine operations. Consequently, the key selling propositions for businesses in this sector revolve around delivering unparalleled efficiency, unwavering reliability, and a strong commitment to environmental sustainability.
Key Drivers, Barriers & Challenges in Marine Services Industry
Key Drivers:
- Growing global trade volumes and increasing containerization.
- Government investments in port infrastructure development and modernization.
- Technological advancements improving operational efficiency and reducing costs.
Key Challenges:
- Geopolitical instability and trade uncertainties impacting global shipping.
- Increasing fuel costs and environmental regulations impacting operational expenses.
- Intense competition among service providers leading to price pressure.
Emerging Opportunities in Marine Services Industry
- The escalating demand for seamlessly integrated logistics solutions and comprehensive supply chain optimization services presents a significant growth avenue.
- The increasing adoption and implementation of transformative digital technologies, such as blockchain, are poised to revolutionize transparency, security, and efficiency across maritime trade.
- Strategic expansion into burgeoning emerging markets, characterized by substantial untapped growth potential and increasing trade activities, offers lucrative opportunities for service providers.
Growth Accelerators in the Marine Services Industry Industry
The marine services industry is experiencing a period of accelerated growth propelled by a confluence of powerful forces. Paramount among these are rapid technological advancements, including the strategic application of artificial intelligence (AI) for optimizing shipping routes, enabling predictive maintenance schedules to minimize downtime, and driving the automation of port operations. In parallel, strategic partnerships between key industry players and robust government initiatives focused on upgrading critical infrastructure are laying the groundwork for sustained, long-term expansion and increased efficiency across the entire maritime ecosystem.
Key Players Shaping the Marine Services Industry Market
- International Container Terminal Services
- Shanghai International Port (Website unavailable)
- CarboShield Inc (Website unavailable)
- Shipping Solutions and Services Ltd (Website unavailable)
- Hamburger Hafen Und Logistik AG
- TomWorks LLC (Website unavailable)
- Montreal Port Authority
- DP World Limited
- Tianjin Port Development Holdings Ltd (Website unavailable)
- AP Moller Maersk
Notable Milestones in Marine Services Industry Sector
- June 2022: DP World and the Saudi Ports Authority forged a significant partnership, committing USD 133.33 million towards the development of a state-of-the-art logistics park in Jeddah, underscoring a commitment to enhanced regional trade capabilities.
- May 2021: Hutchison Ports, a global leader in port operations, completed the acquisition of APM Terminals Rotterdam, reinforcing its strategic presence in key European shipping lanes and expanding its terminal network.
- May 2021: Régie du Terminal à Conteneurs (RTC) bolstered its operational capacity by ordering two advanced Gottwald Mobile Harbor Cranes from Konecranes, signaling an investment in cutting-edge equipment to improve terminal efficiency and handling capabilities.
In-Depth Marine Services Industry Market Outlook
The marine services industry is poised for continued growth driven by ongoing investments in port infrastructure, technological innovations enhancing efficiency and sustainability, and the expansion of global trade. Strategic partnerships and mergers and acquisitions will play a vital role in shaping the market landscape and driving future expansion. The long-term outlook is optimistic, with significant opportunities for companies that can adapt to evolving market dynamics and customer needs.
Marine Services Industry Segmentation
-
1. Service Analysis
- 1.1. Container Handling Services
- 1.2. Ship repair and maintenance services
- 1.3. Supply Chain
- 1.4. Mechanical and Electrical Engineering Services
- 1.5. Navigation Services
- 1.6. Logistics Solutions
Marine Services Industry Segmentation By Geography
-
1. North America
- 1.1. US
- 1.2. Canada
- 1.3. Mexico
-
2. Europe
- 2.1. Germany
- 2.2. UK
- 2.3. France
- 2.4. Russia
- 2.5. Spain
- 2.6. Rest of Europe
-
3. Asia Pacific
- 3.1. India
- 3.2. China
- 3.3. Japan
- 3.4. Australia
- 3.5. Singapore
- 3.6. Malaysia
- 3.7. South Korea
- 3.8. Rest of Asia Pacific
-
4. South America
- 4.1. Brazil
- 4.2. Argentina
- 4.3. Rest Of South America
- 5. Middle East
-
6. UAE
- 6.1. Saudi Arabia
- 6.2. South Africa
- 6.3. Others
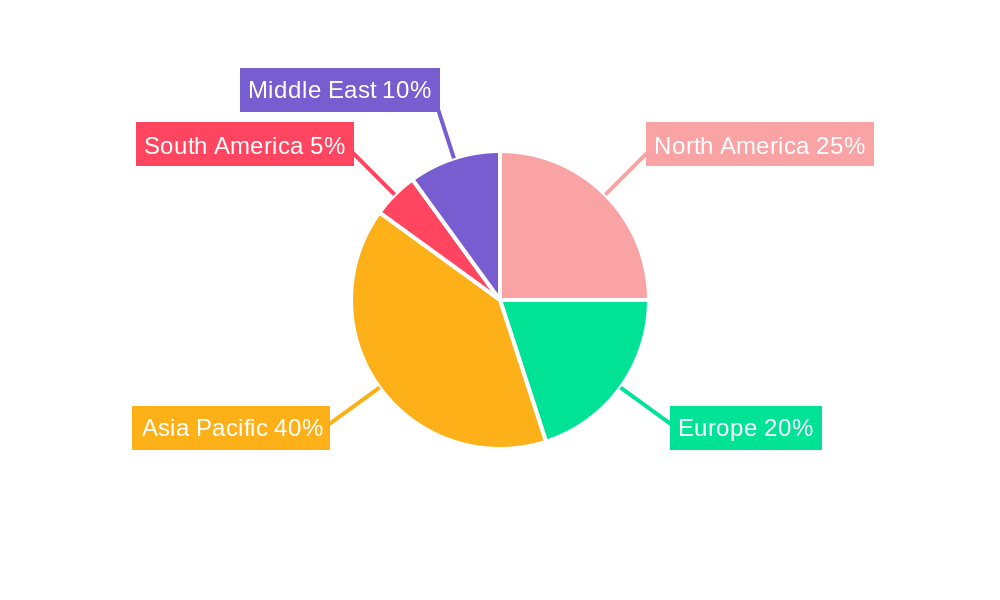
Marine Services Industry Regional Market Share
Geographic Coverage of Marine Services Industry
Marine Services Industry REPORT HIGHLIGHTS
| Aspects | Details |
|---|---|
| Study Period | 2020-2034 |
| Base Year | 2025 |
| Estimated Year | 2026 |
| Forecast Period | 2026-2034 |
| Historical Period | 2020-2025 |
| Growth Rate | CAGR of > 5.00% from 2020-2034 |
| Segmentation |
|
Table of Contents
- 1. Introduction
- 1.1. Research Scope
- 1.2. Market Segmentation
- 1.3. Research Objective
- 1.4. Definitions and Assumptions
- 2. Executive Summary
- 2.1. Market Snapshot
- 3. Market Dynamics
- 3.1. Market Drivers
- 3.2. Market Restrains
- 3.3. Market Trends
- 3.4. Market Opportunities
- 4. Market Factor Analysis
- 4.1. Porters Five Forces
- 4.1.1. Bargaining Power of Suppliers
- 4.1.2. Bargaining Power of Buyers
- 4.1.3. Threat of New Entrants
- 4.1.4. Threat of Substitutes
- 4.1.5. Competitive Rivalry
- 4.2. PESTEL analysis
- 4.3. BCG Analysis
- 4.3.1. Stars (High Growth, High Market Share)
- 4.3.2. Cash Cows (Low Growth, High Market Share)
- 4.3.3. Question Mark (High Growth, Low Market Share)
- 4.3.4. Dogs (Low Growth, Low Market Share)
- 4.4. Ansoff Matrix Analysis
- 4.5. Supply Chain Analysis
- 4.6. Regulatory Landscape
- 4.7. Current Market Potential and Opportunity Assessment (TAM–SAM–SOM Framework)
- 4.8. IMR Analyst Note
- 4.1. Porters Five Forces
- 5. Market Analysis, Insights and Forecast 2021-2033
- 5.1. Market Analysis, Insights and Forecast - by Service Analysis
- 5.1.1. Container Handling Services
- 5.1.2. Ship repair and maintenance services
- 5.1.3. Supply Chain
- 5.1.4. Mechanical and Electrical Engineering Services
- 5.1.5. Navigation Services
- 5.1.6. Logistics Solutions
- 5.2. Market Analysis, Insights and Forecast - by Region
- 5.2.1. North America
- 5.2.2. Europe
- 5.2.3. Asia Pacific
- 5.2.4. South America
- 5.2.5. Middle East
- 5.2.6. UAE
- 5.1. Market Analysis, Insights and Forecast - by Service Analysis
- 6. Global Marine Services Industry Analysis, Insights and Forecast, 2021-2033
- 6.1. Market Analysis, Insights and Forecast - by Service Analysis
- 6.1.1. Container Handling Services
- 6.1.2. Ship repair and maintenance services
- 6.1.3. Supply Chain
- 6.1.4. Mechanical and Electrical Engineering Services
- 6.1.5. Navigation Services
- 6.1.6. Logistics Solutions
- 6.1. Market Analysis, Insights and Forecast - by Service Analysis
- 7. North America Marine Services Industry Analysis, Insights and Forecast, 2020-2032
- 7.1. Market Analysis, Insights and Forecast - by Service Analysis
- 7.1.1. Container Handling Services
- 7.1.2. Ship repair and maintenance services
- 7.1.3. Supply Chain
- 7.1.4. Mechanical and Electrical Engineering Services
- 7.1.5. Navigation Services
- 7.1.6. Logistics Solutions
- 7.1. Market Analysis, Insights and Forecast - by Service Analysis
- 8. Europe Marine Services Industry Analysis, Insights and Forecast, 2020-2032
- 8.1. Market Analysis, Insights and Forecast - by Service Analysis
- 8.1.1. Container Handling Services
- 8.1.2. Ship repair and maintenance services
- 8.1.3. Supply Chain
- 8.1.4. Mechanical and Electrical Engineering Services
- 8.1.5. Navigation Services
- 8.1.6. Logistics Solutions
- 8.1. Market Analysis, Insights and Forecast - by Service Analysis
- 9. Asia Pacific Marine Services Industry Analysis, Insights and Forecast, 2020-2032
- 9.1. Market Analysis, Insights and Forecast - by Service Analysis
- 9.1.1. Container Handling Services
- 9.1.2. Ship repair and maintenance services
- 9.1.3. Supply Chain
- 9.1.4. Mechanical and Electrical Engineering Services
- 9.1.5. Navigation Services
- 9.1.6. Logistics Solutions
- 9.1. Market Analysis, Insights and Forecast - by Service Analysis
- 10. South America Marine Services Industry Analysis, Insights and Forecast, 2020-2032
- 10.1. Market Analysis, Insights and Forecast - by Service Analysis
- 10.1.1. Container Handling Services
- 10.1.2. Ship repair and maintenance services
- 10.1.3. Supply Chain
- 10.1.4. Mechanical and Electrical Engineering Services
- 10.1.5. Navigation Services
- 10.1.6. Logistics Solutions
- 10.1. Market Analysis, Insights and Forecast - by Service Analysis
- 11. Middle East Marine Services Industry Analysis, Insights and Forecast, 2020-2032
- 11.1. Market Analysis, Insights and Forecast - by Service Analysis
- 11.1.1. Container Handling Services
- 11.1.2. Ship repair and maintenance services
- 11.1.3. Supply Chain
- 11.1.4. Mechanical and Electrical Engineering Services
- 11.1.5. Navigation Services
- 11.1.6. Logistics Solutions
- 11.1. Market Analysis, Insights and Forecast - by Service Analysis
- 12. UAE Marine Services Industry Analysis, Insights and Forecast, 2020-2032
- 12.1. Market Analysis, Insights and Forecast - by Service Analysis
- 12.1.1. Container Handling Services
- 12.1.2. Ship repair and maintenance services
- 12.1.3. Supply Chain
- 12.1.4. Mechanical and Electrical Engineering Services
- 12.1.5. Navigation Services
- 12.1.6. Logistics Solutions
- 12.1. Market Analysis, Insights and Forecast - by Service Analysis
- 13. Competitive Analysis
- 13.1. Company Profiles
- 13.1.1 International Container Terminal Services
- 13.1.1.1. Company Overview
- 13.1.1.2. Products
- 13.1.1.3. Company Financials
- 13.1.1.4. SWOT Analysis
- 13.1.2 Shanghai International Port
- 13.1.2.1. Company Overview
- 13.1.2.2. Products
- 13.1.2.3. Company Financials
- 13.1.2.4. SWOT Analysis
- 13.1.3 CarboShield Inc
- 13.1.3.1. Company Overview
- 13.1.3.2. Products
- 13.1.3.3. Company Financials
- 13.1.3.4. SWOT Analysis
- 13.1.4 Shipping Solutions and Services Ltd
- 13.1.4.1. Company Overview
- 13.1.4.2. Products
- 13.1.4.3. Company Financials
- 13.1.4.4. SWOT Analysis
- 13.1.5 Hamburger Hafen Und Logistik AG
- 13.1.5.1. Company Overview
- 13.1.5.2. Products
- 13.1.5.3. Company Financials
- 13.1.5.4. SWOT Analysis
- 13.1.6 TomWorks LLC
- 13.1.6.1. Company Overview
- 13.1.6.2. Products
- 13.1.6.3. Company Financials
- 13.1.6.4. SWOT Analysis
- 13.1.7 Montreal Port Authority**List Not Exhaustive
- 13.1.7.1. Company Overview
- 13.1.7.2. Products
- 13.1.7.3. Company Financials
- 13.1.7.4. SWOT Analysis
- 13.1.8 DP World Limited
- 13.1.8.1. Company Overview
- 13.1.8.2. Products
- 13.1.8.3. Company Financials
- 13.1.8.4. SWOT Analysis
- 13.1.9 Tianjin Port Development Holdings Ltd
- 13.1.9.1. Company Overview
- 13.1.9.2. Products
- 13.1.9.3. Company Financials
- 13.1.9.4. SWOT Analysis
- 13.1.10 AP Moller Maersk
- 13.1.10.1. Company Overview
- 13.1.10.2. Products
- 13.1.10.3. Company Financials
- 13.1.10.4. SWOT Analysis
- 13.1.1 International Container Terminal Services
- 13.2. Market Entropy
- 13.2.1 Company's Key Areas Served
- 13.2.2 Recent Developments
- 13.3. Company Market Share Analysis 2025
- 13.3.1 Top 5 Companies Market Share Analysis
- 13.3.2 Top 3 Companies Market Share Analysis
- 13.4. List of Potential Customers
- 14. Research Methodology
List of Figures
- Figure 1: Global Marine Services Industry Revenue Breakdown (Million, %) by Region 2025 & 2033
- Figure 2: North America Marine Services Industry Revenue (Million), by Service Analysis 2025 & 2033
- Figure 3: North America Marine Services Industry Revenue Share (%), by Service Analysis 2025 & 2033
- Figure 4: North America Marine Services Industry Revenue (Million), by Country 2025 & 2033
- Figure 5: North America Marine Services Industry Revenue Share (%), by Country 2025 & 2033
- Figure 6: Europe Marine Services Industry Revenue (Million), by Service Analysis 2025 & 2033
- Figure 7: Europe Marine Services Industry Revenue Share (%), by Service Analysis 2025 & 2033
- Figure 8: Europe Marine Services Industry Revenue (Million), by Country 2025 & 2033
- Figure 9: Europe Marine Services Industry Revenue Share (%), by Country 2025 & 2033
- Figure 10: Asia Pacific Marine Services Industry Revenue (Million), by Service Analysis 2025 & 2033
- Figure 11: Asia Pacific Marine Services Industry Revenue Share (%), by Service Analysis 2025 & 2033
- Figure 12: Asia Pacific Marine Services Industry Revenue (Million), by Country 2025 & 2033
- Figure 13: Asia Pacific Marine Services Industry Revenue Share (%), by Country 2025 & 2033
- Figure 14: South America Marine Services Industry Revenue (Million), by Service Analysis 2025 & 2033
- Figure 15: South America Marine Services Industry Revenue Share (%), by Service Analysis 2025 & 2033
- Figure 16: South America Marine Services Industry Revenue (Million), by Country 2025 & 2033
- Figure 17: South America Marine Services Industry Revenue Share (%), by Country 2025 & 2033
- Figure 18: Middle East Marine Services Industry Revenue (Million), by Service Analysis 2025 & 2033
- Figure 19: Middle East Marine Services Industry Revenue Share (%), by Service Analysis 2025 & 2033
- Figure 20: Middle East Marine Services Industry Revenue (Million), by Country 2025 & 2033
- Figure 21: Middle East Marine Services Industry Revenue Share (%), by Country 2025 & 2033
- Figure 22: UAE Marine Services Industry Revenue (Million), by Service Analysis 2025 & 2033
- Figure 23: UAE Marine Services Industry Revenue Share (%), by Service Analysis 2025 & 2033
- Figure 24: UAE Marine Services Industry Revenue (Million), by Country 2025 & 2033
- Figure 25: UAE Marine Services Industry Revenue Share (%), by Country 2025 & 2033
List of Tables
- Table 1: Global Marine Services Industry Revenue Million Forecast, by Service Analysis 2020 & 2033
- Table 2: Global Marine Services Industry Revenue Million Forecast, by Region 2020 & 2033
- Table 3: Global Marine Services Industry Revenue Million Forecast, by Service Analysis 2020 & 2033
- Table 4: Global Marine Services Industry Revenue Million Forecast, by Country 2020 & 2033
- Table 5: US Marine Services Industry Revenue (Million) Forecast, by Application 2020 & 2033
- Table 6: Canada Marine Services Industry Revenue (Million) Forecast, by Application 2020 & 2033
- Table 7: Mexico Marine Services Industry Revenue (Million) Forecast, by Application 2020 & 2033
- Table 8: Global Marine Services Industry Revenue Million Forecast, by Service Analysis 2020 & 2033
- Table 9: Global Marine Services Industry Revenue Million Forecast, by Country 2020 & 2033
- Table 10: Germany Marine Services Industry Revenue (Million) Forecast, by Application 2020 & 2033
- Table 11: UK Marine Services Industry Revenue (Million) Forecast, by Application 2020 & 2033
- Table 12: France Marine Services Industry Revenue (Million) Forecast, by Application 2020 & 2033
- Table 13: Russia Marine Services Industry Revenue (Million) Forecast, by Application 2020 & 2033
- Table 14: Spain Marine Services Industry Revenue (Million) Forecast, by Application 2020 & 2033
- Table 15: Rest of Europe Marine Services Industry Revenue (Million) Forecast, by Application 2020 & 2033
- Table 16: Global Marine Services Industry Revenue Million Forecast, by Service Analysis 2020 & 2033
- Table 17: Global Marine Services Industry Revenue Million Forecast, by Country 2020 & 2033
- Table 18: India Marine Services Industry Revenue (Million) Forecast, by Application 2020 & 2033
- Table 19: China Marine Services Industry Revenue (Million) Forecast, by Application 2020 & 2033
- Table 20: Japan Marine Services Industry Revenue (Million) Forecast, by Application 2020 & 2033
- Table 21: Australia Marine Services Industry Revenue (Million) Forecast, by Application 2020 & 2033
- Table 22: Singapore Marine Services Industry Revenue (Million) Forecast, by Application 2020 & 2033
- Table 23: Malaysia Marine Services Industry Revenue (Million) Forecast, by Application 2020 & 2033
- Table 24: South Korea Marine Services Industry Revenue (Million) Forecast, by Application 2020 & 2033
- Table 25: Rest of Asia Pacific Marine Services Industry Revenue (Million) Forecast, by Application 2020 & 2033
- Table 26: Global Marine Services Industry Revenue Million Forecast, by Service Analysis 2020 & 2033
- Table 27: Global Marine Services Industry Revenue Million Forecast, by Country 2020 & 2033
- Table 28: Brazil Marine Services Industry Revenue (Million) Forecast, by Application 2020 & 2033
- Table 29: Argentina Marine Services Industry Revenue (Million) Forecast, by Application 2020 & 2033
- Table 30: Rest Of South America Marine Services Industry Revenue (Million) Forecast, by Application 2020 & 2033
- Table 31: Global Marine Services Industry Revenue Million Forecast, by Service Analysis 2020 & 2033
- Table 32: Global Marine Services Industry Revenue Million Forecast, by Country 2020 & 2033
- Table 33: Global Marine Services Industry Revenue Million Forecast, by Service Analysis 2020 & 2033
- Table 34: Global Marine Services Industry Revenue Million Forecast, by Country 2020 & 2033
- Table 35: Saudi Arabia Marine Services Industry Revenue (Million) Forecast, by Application 2020 & 2033
- Table 36: South Africa Marine Services Industry Revenue (Million) Forecast, by Application 2020 & 2033
- Table 37: Others Marine Services Industry Revenue (Million) Forecast, by Application 2020 & 2033
Frequently Asked Questions
1. What is the projected Compound Annual Growth Rate (CAGR) of the Marine Services Industry?
The projected CAGR is approximately > 5.00%.
2. Which companies are prominent players in the Marine Services Industry?
Key companies in the market include International Container Terminal Services, Shanghai International Port, CarboShield Inc, Shipping Solutions and Services Ltd, Hamburger Hafen Und Logistik AG, TomWorks LLC, Montreal Port Authority**List Not Exhaustive, DP World Limited, Tianjin Port Development Holdings Ltd, AP Moller Maersk.
3. What are the main segments of the Marine Services Industry?
The market segments include Service Analysis.
4. Can you provide details about the market size?
The market size is estimated to be USD XX Million as of 2022.
5. What are some drivers contributing to market growth?
The rise in online shopping and consumer demand for fast delivery; Rise in cross-border trade activities.
6. What are the notable trends driving market growth?
Increasing Maritime Trade.
7. Are there any restraints impacting market growth?
Poor infrastructure and higher logistics costs.
8. Can you provide examples of recent developments in the market?
On 19 June 2022, DP World and the Saudi Ports Authority announce a major new partnership for the Jeddah logistics park. This is a 30-year agreement with an investment value of more than SAR 500 million (USD 133.33 million) to build a state-of-the-art, port-centric Logistics Park at the Jeddah Islamic Port. The agreement aims to establish a logistics park that spans over 415,000 square meters, with an in-land container depot capacity of approximately 250,000 TEU and a warehousing storage space of 100,000 square meters. Future expansions could increase the storage space to 200,000 square meters.
9. What pricing options are available for accessing the report?
Pricing options include single-user, multi-user, and enterprise licenses priced at USD 4750, USD 5250, and USD 8750 respectively.
10. Is the market size provided in terms of value or volume?
The market size is provided in terms of value, measured in Million.
11. Are there any specific market keywords associated with the report?
Yes, the market keyword associated with the report is "Marine Services Industry," which aids in identifying and referencing the specific market segment covered.
12. How do I determine which pricing option suits my needs best?
The pricing options vary based on user requirements and access needs. Individual users may opt for single-user licenses, while businesses requiring broader access may choose multi-user or enterprise licenses for cost-effective access to the report.
13. Are there any additional resources or data provided in the Marine Services Industry report?
While the report offers comprehensive insights, it's advisable to review the specific contents or supplementary materials provided to ascertain if additional resources or data are available.
14. How can I stay updated on further developments or reports in the Marine Services Industry?
To stay informed about further developments, trends, and reports in the Marine Services Industry, consider subscribing to industry newsletters, following relevant companies and organizations, or regularly checking reputable industry news sources and publications.
Methodology
Step 1 - Identification of Relevant Samples Size from Population Database


Step 2 - Approaches for Defining Global Market Size (Value, Volume* & Price*)

Note*: In applicable scenarios
Step 3 - Data Sources
Primary Research
- Web Analytics
- Survey Reports
- Research Institute
- Latest Research Reports
- Opinion Leaders
Secondary Research
- Annual Reports
- White Paper
- Latest Press Release
- Industry Association
- Paid Database
- Investor Presentations

Step 4 - Data Triangulation
Involves using different sources of information in order to increase the validity of a study
These sources are likely to be stakeholders in a program - participants, other researchers, program staff, other community members, and so on.
Then we put all data in single framework & apply various statistical tools to find out the dynamic on the market.
During the analysis stage, feedback from the stakeholder groups would be compared to determine areas of agreement as well as areas of divergence