

Key Insights
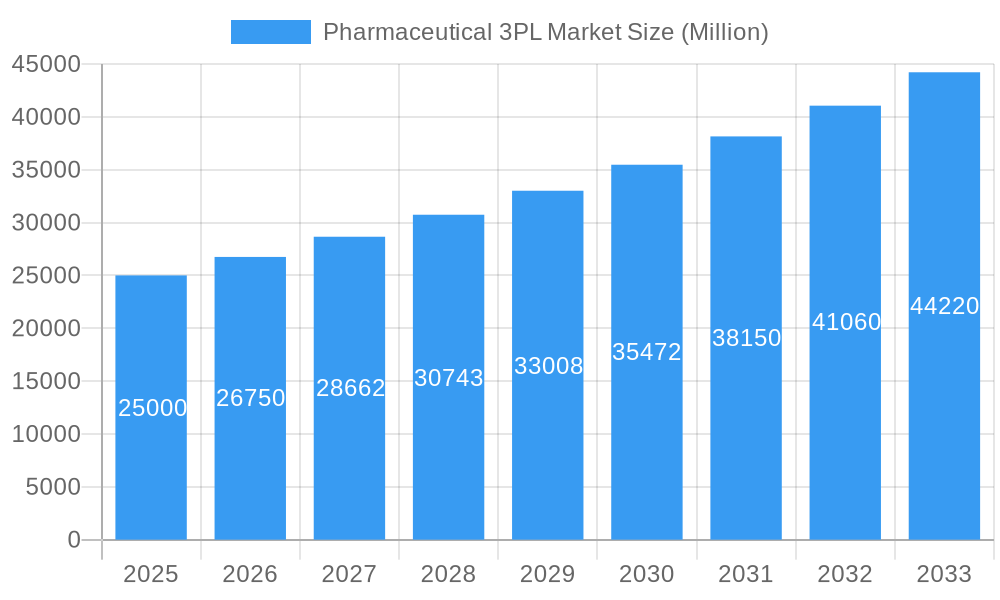
The pharmaceutical 3PL market is experiencing robust growth, driven by increasing demand for efficient and reliable supply chain solutions within the pharmaceutical industry. The market's expansion is fueled by several key factors. Firstly, the rising complexity of global pharmaceutical regulations necessitates specialized 3PL providers capable of navigating intricate compliance requirements. Secondly, the growth of e-commerce and direct-to-consumer models necessitates greater agility and scalability in pharmaceutical logistics, pushing companies to outsource these operations to specialized providers. Thirdly, the ongoing need for temperature-sensitive transportation and storage (cold chain logistics) for many pharmaceutical products is a significant driver. Finally, the industry's focus on reducing costs and improving efficiency through outsourcing non-core activities like warehousing, transportation, and distribution is further boosting market growth. A compound annual growth rate (CAGR) exceeding 7% indicates a consistently expanding market, potentially reaching billions in value within the forecast period.
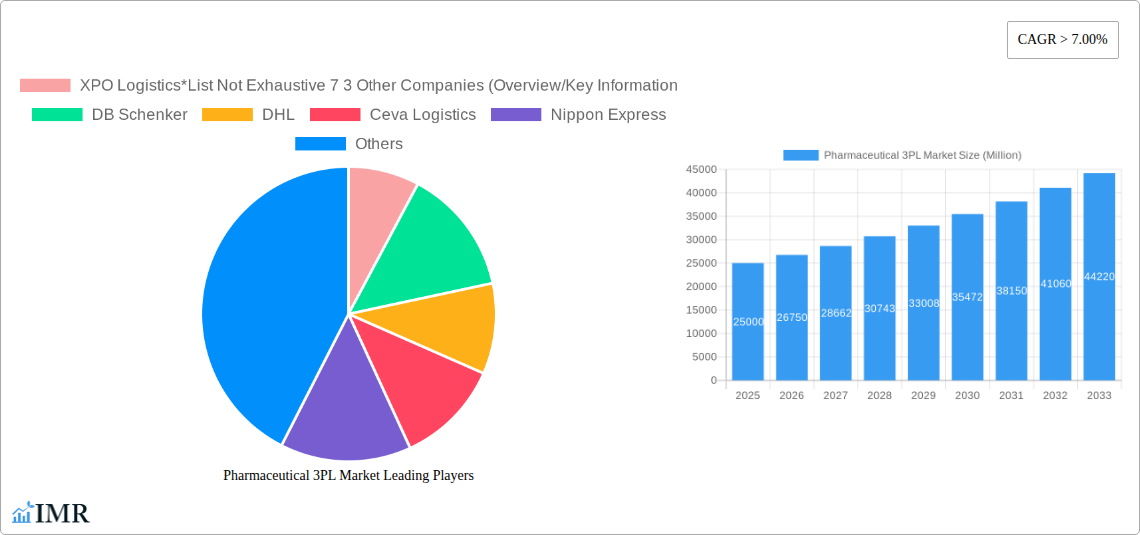
Pharmaceutical 3PL Market Market Size (In Billion)
The market is segmented by function (domestic and international transportation management, value-added warehousing and distribution) and by supply chain type (cold chain and non-cold chain). Major players like XPO Logistics, DB Schenker, DHL, Ceva Logistics, Nippon Express, UPS, FedEx, Kuehne + Nagel, Agility, and Kerry Logistics dominate the landscape, competing on factors such as global reach, specialized services, technological capabilities, and pricing. Regional variations exist; North America and Europe currently hold larger market shares due to established pharmaceutical industries and advanced logistics infrastructure. However, the Asia-Pacific region is exhibiting rapid growth driven by increasing pharmaceutical manufacturing and consumption. The forecast period (2025-2033) anticipates sustained growth across all segments and regions, influenced by technological advancements such as AI-powered logistics optimization and blockchain for enhanced supply chain transparency and traceability.
Pharmaceutical 3PL Market Company Market Share
Pharmaceutical 3PL Market: A Comprehensive Report (2019-2033)
This in-depth report provides a comprehensive analysis of the Pharmaceutical 3PL Market, offering invaluable insights for industry professionals, investors, and strategic decision-makers. Covering the period from 2019 to 2033, with a base year of 2025, this report dissects market dynamics, growth trends, regional dominance, and key player strategies to paint a clear picture of this rapidly evolving sector. The report explores both parent (3PL) and child (pharmaceutical 3PL) markets for a granular understanding of market segmentation and opportunities.
Note: Values presented in Million units. Where precise data was unavailable, estimated figures are used, denoted by "xx".
Pharmaceutical 3PL Market Dynamics & Structure
This section analyzes the competitive landscape of the Pharmaceutical 3PL market, evaluating market concentration, technological advancements, regulatory landscapes, and M&A activity. We delve into the factors influencing market structure, including the impact of substitute products, end-user demographics, and evolving industry dynamics.
- Market Concentration: The market exhibits a [xx]% concentration ratio, with [xx]% held by the top 5 players.
- Technological Innovation: Automation, AI, and blockchain are driving efficiency and security improvements, creating a [xx]% increase in investment within the sector (2024).
- Regulatory Framework: Stringent regulatory compliance requirements across countries significantly impact market operations. [xx]% of market participants reported compliance as a major operational challenge (2024).
- Competitive Substitutes: Emergence of specialized niche 3PL providers presents a competitive threat, estimated to capture [xx]% of the market by 2033.
- M&A Trends: The past five years have witnessed [xx] M&A deals, signifying industry consolidation and expansion of service offerings. This trend is expected to continue, with [xx] projected deals during the forecast period.
- End-User Demographics: Pharmaceutical giants and mid-sized companies form the bulk of the end-user segment, driving demand for tailored and scalable 3PL solutions.
Pharmaceutical 3PL Market Growth Trends & Insights
This section examines the historical and projected growth of the Pharmaceutical 3PL market, analyzing key drivers, adoption rates, and technological disruptions. It explores changing consumer behavior and its impact on market dynamics, providing quantitative insights to guide strategic planning.
The Pharmaceutical 3PL market witnessed significant growth between 2019 and 2024, achieving a CAGR of [xx]%. This growth is projected to continue with a CAGR of [xx]% from 2025 to 2033, reaching a market size of [xx] Million units by 2033. This expansion is fueled by factors such as the increasing outsourcing of logistics functions by pharmaceutical companies, growing demand for cold chain logistics, and advancements in technology, especially in warehouse automation and supply chain visibility systems. Market penetration among pharmaceutical companies is estimated at [xx]%, with significant potential for growth in emerging markets.
Dominant Regions, Countries, or Segments in Pharmaceutical 3PL Market
This section identifies leading regions, countries, and market segments (Function: Domestic Transportation Management, International Transportation Management, Value-added Warehousing and Distribution; Supply Chain: Cold Chain, Non-cold Chain) within the Pharmaceutical 3PL market, exploring factors driving their dominance.
- North America: Remains the largest region, capturing [xx]% of the market share in 2025, driven by strong regulatory frameworks and high investments in cold chain infrastructure.
- Europe: Holds [xx]% market share, driven by robust pharmaceutical manufacturing and distribution networks.
- Asia-Pacific: Is experiencing rapid growth, anticipated to reach [xx]% market share by 2033, driven by rising pharmaceutical production and expanding cold chain infrastructure in emerging economies.
Leading Segments:
- Cold Chain Logistics: Represents the fastest-growing segment, exceeding [xx]% market share by 2033, owing to stringent temperature-sensitive drug handling requirements.
- Value-added Warehousing and Distribution: Is a crucial segment due to its specialization in pharmaceutical handling and inventory management.
Key drivers include government policies promoting pharmaceutical development, improving infrastructure, and growing demand for advanced logistics services.
Pharmaceutical 3PL Market Product Landscape
The Pharmaceutical 3PL market offers a range of specialized services, including temperature-controlled transportation, specialized warehousing, inventory management, and value-added services like labeling and repackaging. Recent innovations include the use of blockchain technology for enhanced supply chain transparency and AI-powered route optimization for cost-effectiveness. Unique selling propositions focus on security, compliance, and real-time visibility, enhancing customer trust and efficient operations.
Key Drivers, Barriers & Challenges in Pharmaceutical 3PL Market
Key Drivers:
- Increasing outsourcing of logistics operations by pharmaceutical companies.
- Growing demand for cold chain logistics and temperature-sensitive drug handling.
- Technological advancements enabling enhanced supply chain visibility and efficiency.
- Stringent regulatory compliance requirements.
Key Challenges:
- Maintaining stringent quality and regulatory compliance across diverse geographical locations.
- Managing complex global supply chains with diverse stakeholders.
- Ensuring security and integrity of pharmaceutical products throughout the supply chain.
- Fluctuations in fuel prices and geopolitical factors.
Emerging Opportunities in Pharmaceutical 3PL Market
- Expansion into untapped markets in emerging economies.
- Development of specialized services for niche pharmaceutical products.
- Integration of advanced technologies such as AI, blockchain, and IoT to enhance supply chain visibility and efficiency.
- Growing focus on sustainable and environmentally friendly logistics solutions.
Growth Accelerators in the Pharmaceutical 3PL Market Industry
Technological advancements, strategic partnerships, and market expansion into emerging economies are key accelerators for long-term growth. Investments in automation, AI, and data analytics further enhance supply chain visibility and efficiency, while collaborative partnerships with pharmaceutical companies create tailored solutions and enhance value propositions.
Key Players Shaping the Pharmaceutical 3PL Market Market
- XPO Logistics
- DB Schenker
- DHL
- Ceva Logistics
- Nippon Express
- UPS
- FedEx
- Kuehne + Nagel
- Agility
- Kerry Logistics
Notable Milestones in Pharmaceutical 3PL Market Sector
- 2021: Introduction of blockchain technology for improved traceability by [Company Name].
- 2022: [Company Name] launches AI-powered route optimization software.
- 2023: Major merger between two leading 3PL providers creates a larger market player.
In-Depth Pharmaceutical 3PL Market Market Outlook
The Pharmaceutical 3PL market is poised for significant growth driven by continuous technological advancements and increasing demand for specialized logistics services. Strategic partnerships, investments in infrastructure, and expansion into new markets will drive long-term growth. Opportunities exist in personalized medicine, personalized drug delivery, and the increasing adoption of advanced analytics for improved supply chain management.
Pharmaceutical 3PL Market Segmentation
-
1. Function
- 1.1. Domestic Transportation Management
- 1.2. International Transportation Management
- 1.3. Value-added Warehousing and Distribution
-
2. Supply Chain
- 2.1. Cold Chain
- 2.2. Non-cold Chain
Pharmaceutical 3PL Market Segmentation By Geography
-
1. North America
- 1.1. United States
- 1.2. Canada
- 1.3. Mexico
-
2. South America
- 2.1. Brazil
- 2.2. Argentina
- 2.3. Rest of South America
-
3. Europe
- 3.1. United Kingdom
- 3.2. Germany
- 3.3. France
- 3.4. Russia
- 3.5. Spain
- 3.6. Rest of Europe
-
4. Middle East and Africa
- 4.1. Saudi Arabia
- 4.2. United Arab Emirates
- 4.3. Qatar
- 4.4. South Africa
- 4.5. Rest of Middle East and Africa
-
5. Asia Pacific
- 5.1. India
- 5.2. China
- 5.3. Singapore
- 5.4. Japan
- 5.5. South Korea
- 5.6. Vietnam
- 5.7. Australia
- 5.8. Rest of Asia Pacific

Pharmaceutical 3PL Market Regional Market Share
Geographic Coverage of Pharmaceutical 3PL Market
Pharmaceutical 3PL Market REPORT HIGHLIGHTS
| Aspects | Details |
|---|---|
| Study Period | 2020-2034 |
| Base Year | 2025 |
| Estimated Year | 2026 |
| Forecast Period | 2026-2034 |
| Historical Period | 2020-2025 |
| Growth Rate | CAGR of 6.62% from 2020-2034 |
| Segmentation |
|
Table of Contents
- 1. Introduction
- 1.1. Research Scope
- 1.2. Market Segmentation
- 1.3. Research Objective
- 1.4. Definitions and Assumptions
- 2. Executive Summary
- 2.1. Market Snapshot
- 3. Market Dynamics
- 3.1. Market Drivers
- 3.2. Market Restrains
- 3.3. Market Trends
- 3.4. Market Opportunities
- 4. Market Factor Analysis
- 4.1. Porters Five Forces
- 4.1.1. Bargaining Power of Suppliers
- 4.1.2. Bargaining Power of Buyers
- 4.1.3. Threat of New Entrants
- 4.1.4. Threat of Substitutes
- 4.1.5. Competitive Rivalry
- 4.2. PESTEL analysis
- 4.3. BCG Analysis
- 4.3.1. Stars (High Growth, High Market Share)
- 4.3.2. Cash Cows (Low Growth, High Market Share)
- 4.3.3. Question Mark (High Growth, Low Market Share)
- 4.3.4. Dogs (Low Growth, Low Market Share)
- 4.4. Ansoff Matrix Analysis
- 4.5. Supply Chain Analysis
- 4.6. Regulatory Landscape
- 4.7. Current Market Potential and Opportunity Assessment (TAM–SAM–SOM Framework)
- 4.8. IMR Analyst Note
- 4.1. Porters Five Forces
- 5. Market Analysis, Insights and Forecast 2021-2033
- 5.1. Market Analysis, Insights and Forecast - by Function
- 5.1.1. Domestic Transportation Management
- 5.1.2. International Transportation Management
- 5.1.3. Value-added Warehousing and Distribution
- 5.2. Market Analysis, Insights and Forecast - by Supply Chain
- 5.2.1. Cold Chain
- 5.2.2. Non-cold Chain
- 5.3. Market Analysis, Insights and Forecast - by Region
- 5.3.1. North America
- 5.3.2. South America
- 5.3.3. Europe
- 5.3.4. Middle East and Africa
- 5.3.5. Asia Pacific
- 5.1. Market Analysis, Insights and Forecast - by Function
- 6. Global Pharmaceutical 3PL Market Analysis, Insights and Forecast, 2021-2033
- 6.1. Market Analysis, Insights and Forecast - by Function
- 6.1.1. Domestic Transportation Management
- 6.1.2. International Transportation Management
- 6.1.3. Value-added Warehousing and Distribution
- 6.2. Market Analysis, Insights and Forecast - by Supply Chain
- 6.2.1. Cold Chain
- 6.2.2. Non-cold Chain
- 6.1. Market Analysis, Insights and Forecast - by Function
- 7. North America Pharmaceutical 3PL Market Analysis, Insights and Forecast, 2020-2032
- 7.1. Market Analysis, Insights and Forecast - by Function
- 7.1.1. Domestic Transportation Management
- 7.1.2. International Transportation Management
- 7.1.3. Value-added Warehousing and Distribution
- 7.2. Market Analysis, Insights and Forecast - by Supply Chain
- 7.2.1. Cold Chain
- 7.2.2. Non-cold Chain
- 7.1. Market Analysis, Insights and Forecast - by Function
- 8. South America Pharmaceutical 3PL Market Analysis, Insights and Forecast, 2020-2032
- 8.1. Market Analysis, Insights and Forecast - by Function
- 8.1.1. Domestic Transportation Management
- 8.1.2. International Transportation Management
- 8.1.3. Value-added Warehousing and Distribution
- 8.2. Market Analysis, Insights and Forecast - by Supply Chain
- 8.2.1. Cold Chain
- 8.2.2. Non-cold Chain
- 8.1. Market Analysis, Insights and Forecast - by Function
- 9. Europe Pharmaceutical 3PL Market Analysis, Insights and Forecast, 2020-2032
- 9.1. Market Analysis, Insights and Forecast - by Function
- 9.1.1. Domestic Transportation Management
- 9.1.2. International Transportation Management
- 9.1.3. Value-added Warehousing and Distribution
- 9.2. Market Analysis, Insights and Forecast - by Supply Chain
- 9.2.1. Cold Chain
- 9.2.2. Non-cold Chain
- 9.1. Market Analysis, Insights and Forecast - by Function
- 10. Middle East and Africa Pharmaceutical 3PL Market Analysis, Insights and Forecast, 2020-2032
- 10.1. Market Analysis, Insights and Forecast - by Function
- 10.1.1. Domestic Transportation Management
- 10.1.2. International Transportation Management
- 10.1.3. Value-added Warehousing and Distribution
- 10.2. Market Analysis, Insights and Forecast - by Supply Chain
- 10.2.1. Cold Chain
- 10.2.2. Non-cold Chain
- 10.1. Market Analysis, Insights and Forecast - by Function
- 11. Asia Pacific Pharmaceutical 3PL Market Analysis, Insights and Forecast, 2020-2032
- 11.1. Market Analysis, Insights and Forecast - by Function
- 11.1.1. Domestic Transportation Management
- 11.1.2. International Transportation Management
- 11.1.3. Value-added Warehousing and Distribution
- 11.2. Market Analysis, Insights and Forecast - by Supply Chain
- 11.2.1. Cold Chain
- 11.2.2. Non-cold Chain
- 11.1. Market Analysis, Insights and Forecast - by Function
- 12. Competitive Analysis
- 12.1. Company Profiles
- 12.1.1 XPO Logistics*List Not Exhaustive 7 3 Other Companies (Overview/Key Information
- 12.1.1.1. Company Overview
- 12.1.1.2. Products
- 12.1.1.3. Company Financials
- 12.1.1.4. SWOT Analysis
- 12.1.2 DB Schenker
- 12.1.2.1. Company Overview
- 12.1.2.2. Products
- 12.1.2.3. Company Financials
- 12.1.2.4. SWOT Analysis
- 12.1.3 DHL
- 12.1.3.1. Company Overview
- 12.1.3.2. Products
- 12.1.3.3. Company Financials
- 12.1.3.4. SWOT Analysis
- 12.1.4 Ceva Logistics
- 12.1.4.1. Company Overview
- 12.1.4.2. Products
- 12.1.4.3. Company Financials
- 12.1.4.4. SWOT Analysis
- 12.1.5 Nippon Express
- 12.1.5.1. Company Overview
- 12.1.5.2. Products
- 12.1.5.3. Company Financials
- 12.1.5.4. SWOT Analysis
- 12.1.6 UPS
- 12.1.6.1. Company Overview
- 12.1.6.2. Products
- 12.1.6.3. Company Financials
- 12.1.6.4. SWOT Analysis
- 12.1.7 FedEx
- 12.1.7.1. Company Overview
- 12.1.7.2. Products
- 12.1.7.3. Company Financials
- 12.1.7.4. SWOT Analysis
- 12.1.8 Kuehne + Nagel
- 12.1.8.1. Company Overview
- 12.1.8.2. Products
- 12.1.8.3. Company Financials
- 12.1.8.4. SWOT Analysis
- 12.1.9 Agility
- 12.1.9.1. Company Overview
- 12.1.9.2. Products
- 12.1.9.3. Company Financials
- 12.1.9.4. SWOT Analysis
- 12.1.10 Kerry Logistics
- 12.1.10.1. Company Overview
- 12.1.10.2. Products
- 12.1.10.3. Company Financials
- 12.1.10.4. SWOT Analysis
- 12.1.1 XPO Logistics*List Not Exhaustive 7 3 Other Companies (Overview/Key Information
- 12.2. Market Entropy
- 12.2.1 Company's Key Areas Served
- 12.2.2 Recent Developments
- 12.3. Company Market Share Analysis 2025
- 12.3.1 Top 5 Companies Market Share Analysis
- 12.3.2 Top 3 Companies Market Share Analysis
- 12.4. List of Potential Customers
- 13. Research Methodology
List of Figures
- Figure 1: Global Pharmaceutical 3PL Market Revenue Breakdown (billion, %) by Region 2025 & 2033
- Figure 2: North America Pharmaceutical 3PL Market Revenue (billion), by Function 2025 & 2033
- Figure 3: North America Pharmaceutical 3PL Market Revenue Share (%), by Function 2025 & 2033
- Figure 4: North America Pharmaceutical 3PL Market Revenue (billion), by Supply Chain 2025 & 2033
- Figure 5: North America Pharmaceutical 3PL Market Revenue Share (%), by Supply Chain 2025 & 2033
- Figure 6: North America Pharmaceutical 3PL Market Revenue (billion), by Country 2025 & 2033
- Figure 7: North America Pharmaceutical 3PL Market Revenue Share (%), by Country 2025 & 2033
- Figure 8: South America Pharmaceutical 3PL Market Revenue (billion), by Function 2025 & 2033
- Figure 9: South America Pharmaceutical 3PL Market Revenue Share (%), by Function 2025 & 2033
- Figure 10: South America Pharmaceutical 3PL Market Revenue (billion), by Supply Chain 2025 & 2033
- Figure 11: South America Pharmaceutical 3PL Market Revenue Share (%), by Supply Chain 2025 & 2033
- Figure 12: South America Pharmaceutical 3PL Market Revenue (billion), by Country 2025 & 2033
- Figure 13: South America Pharmaceutical 3PL Market Revenue Share (%), by Country 2025 & 2033
- Figure 14: Europe Pharmaceutical 3PL Market Revenue (billion), by Function 2025 & 2033
- Figure 15: Europe Pharmaceutical 3PL Market Revenue Share (%), by Function 2025 & 2033
- Figure 16: Europe Pharmaceutical 3PL Market Revenue (billion), by Supply Chain 2025 & 2033
- Figure 17: Europe Pharmaceutical 3PL Market Revenue Share (%), by Supply Chain 2025 & 2033
- Figure 18: Europe Pharmaceutical 3PL Market Revenue (billion), by Country 2025 & 2033
- Figure 19: Europe Pharmaceutical 3PL Market Revenue Share (%), by Country 2025 & 2033
- Figure 20: Middle East and Africa Pharmaceutical 3PL Market Revenue (billion), by Function 2025 & 2033
- Figure 21: Middle East and Africa Pharmaceutical 3PL Market Revenue Share (%), by Function 2025 & 2033
- Figure 22: Middle East and Africa Pharmaceutical 3PL Market Revenue (billion), by Supply Chain 2025 & 2033
- Figure 23: Middle East and Africa Pharmaceutical 3PL Market Revenue Share (%), by Supply Chain 2025 & 2033
- Figure 24: Middle East and Africa Pharmaceutical 3PL Market Revenue (billion), by Country 2025 & 2033
- Figure 25: Middle East and Africa Pharmaceutical 3PL Market Revenue Share (%), by Country 2025 & 2033
- Figure 26: Asia Pacific Pharmaceutical 3PL Market Revenue (billion), by Function 2025 & 2033
- Figure 27: Asia Pacific Pharmaceutical 3PL Market Revenue Share (%), by Function 2025 & 2033
- Figure 28: Asia Pacific Pharmaceutical 3PL Market Revenue (billion), by Supply Chain 2025 & 2033
- Figure 29: Asia Pacific Pharmaceutical 3PL Market Revenue Share (%), by Supply Chain 2025 & 2033
- Figure 30: Asia Pacific Pharmaceutical 3PL Market Revenue (billion), by Country 2025 & 2033
- Figure 31: Asia Pacific Pharmaceutical 3PL Market Revenue Share (%), by Country 2025 & 2033
List of Tables
- Table 1: Global Pharmaceutical 3PL Market Revenue billion Forecast, by Function 2020 & 2033
- Table 2: Global Pharmaceutical 3PL Market Revenue billion Forecast, by Supply Chain 2020 & 2033
- Table 3: Global Pharmaceutical 3PL Market Revenue billion Forecast, by Region 2020 & 2033
- Table 4: Global Pharmaceutical 3PL Market Revenue billion Forecast, by Function 2020 & 2033
- Table 5: Global Pharmaceutical 3PL Market Revenue billion Forecast, by Supply Chain 2020 & 2033
- Table 6: Global Pharmaceutical 3PL Market Revenue billion Forecast, by Country 2020 & 2033
- Table 7: United States Pharmaceutical 3PL Market Revenue (billion) Forecast, by Application 2020 & 2033
- Table 8: Canada Pharmaceutical 3PL Market Revenue (billion) Forecast, by Application 2020 & 2033
- Table 9: Mexico Pharmaceutical 3PL Market Revenue (billion) Forecast, by Application 2020 & 2033
- Table 10: Global Pharmaceutical 3PL Market Revenue billion Forecast, by Function 2020 & 2033
- Table 11: Global Pharmaceutical 3PL Market Revenue billion Forecast, by Supply Chain 2020 & 2033
- Table 12: Global Pharmaceutical 3PL Market Revenue billion Forecast, by Country 2020 & 2033
- Table 13: Brazil Pharmaceutical 3PL Market Revenue (billion) Forecast, by Application 2020 & 2033
- Table 14: Argentina Pharmaceutical 3PL Market Revenue (billion) Forecast, by Application 2020 & 2033
- Table 15: Rest of South America Pharmaceutical 3PL Market Revenue (billion) Forecast, by Application 2020 & 2033
- Table 16: Global Pharmaceutical 3PL Market Revenue billion Forecast, by Function 2020 & 2033
- Table 17: Global Pharmaceutical 3PL Market Revenue billion Forecast, by Supply Chain 2020 & 2033
- Table 18: Global Pharmaceutical 3PL Market Revenue billion Forecast, by Country 2020 & 2033
- Table 19: United Kingdom Pharmaceutical 3PL Market Revenue (billion) Forecast, by Application 2020 & 2033
- Table 20: Germany Pharmaceutical 3PL Market Revenue (billion) Forecast, by Application 2020 & 2033
- Table 21: France Pharmaceutical 3PL Market Revenue (billion) Forecast, by Application 2020 & 2033
- Table 22: Russia Pharmaceutical 3PL Market Revenue (billion) Forecast, by Application 2020 & 2033
- Table 23: Spain Pharmaceutical 3PL Market Revenue (billion) Forecast, by Application 2020 & 2033
- Table 24: Rest of Europe Pharmaceutical 3PL Market Revenue (billion) Forecast, by Application 2020 & 2033
- Table 25: Global Pharmaceutical 3PL Market Revenue billion Forecast, by Function 2020 & 2033
- Table 26: Global Pharmaceutical 3PL Market Revenue billion Forecast, by Supply Chain 2020 & 2033
- Table 27: Global Pharmaceutical 3PL Market Revenue billion Forecast, by Country 2020 & 2033
- Table 28: Saudi Arabia Pharmaceutical 3PL Market Revenue (billion) Forecast, by Application 2020 & 2033
- Table 29: United Arab Emirates Pharmaceutical 3PL Market Revenue (billion) Forecast, by Application 2020 & 2033
- Table 30: Qatar Pharmaceutical 3PL Market Revenue (billion) Forecast, by Application 2020 & 2033
- Table 31: South Africa Pharmaceutical 3PL Market Revenue (billion) Forecast, by Application 2020 & 2033
- Table 32: Rest of Middle East and Africa Pharmaceutical 3PL Market Revenue (billion) Forecast, by Application 2020 & 2033
- Table 33: Global Pharmaceutical 3PL Market Revenue billion Forecast, by Function 2020 & 2033
- Table 34: Global Pharmaceutical 3PL Market Revenue billion Forecast, by Supply Chain 2020 & 2033
- Table 35: Global Pharmaceutical 3PL Market Revenue billion Forecast, by Country 2020 & 2033
- Table 36: India Pharmaceutical 3PL Market Revenue (billion) Forecast, by Application 2020 & 2033
- Table 37: China Pharmaceutical 3PL Market Revenue (billion) Forecast, by Application 2020 & 2033
- Table 38: Singapore Pharmaceutical 3PL Market Revenue (billion) Forecast, by Application 2020 & 2033
- Table 39: Japan Pharmaceutical 3PL Market Revenue (billion) Forecast, by Application 2020 & 2033
- Table 40: South Korea Pharmaceutical 3PL Market Revenue (billion) Forecast, by Application 2020 & 2033
- Table 41: Vietnam Pharmaceutical 3PL Market Revenue (billion) Forecast, by Application 2020 & 2033
- Table 42: Australia Pharmaceutical 3PL Market Revenue (billion) Forecast, by Application 2020 & 2033
- Table 43: Rest of Asia Pacific Pharmaceutical 3PL Market Revenue (billion) Forecast, by Application 2020 & 2033
Frequently Asked Questions
1. What is the projected Compound Annual Growth Rate (CAGR) of the Pharmaceutical 3PL Market?
The projected CAGR is approximately 6.62%.
2. Which companies are prominent players in the Pharmaceutical 3PL Market?
Key companies in the market include XPO Logistics*List Not Exhaustive 7 3 Other Companies (Overview/Key Information, DB Schenker, DHL, Ceva Logistics, Nippon Express, UPS, FedEx, Kuehne + Nagel, Agility, Kerry Logistics.
3. What are the main segments of the Pharmaceutical 3PL Market?
The market segments include Function, Supply Chain.
4. Can you provide details about the market size?
The market size is estimated to be USD 143.44 billion as of 2022.
5. What are some drivers contributing to market growth?
Growing Demand for Over the Counter Drugs Across the European Region; Growing Manufacture Activity from Pharmaceutical Companies.
6. What are the notable trends driving market growth?
Growth in Demand During the Pandemic.
7. Are there any restraints impacting market growth?
High Cost Associated with the Transportation Ordered.
8. Can you provide examples of recent developments in the market?
N/A
9. What pricing options are available for accessing the report?
Pricing options include single-user, multi-user, and enterprise licenses priced at USD 4750, USD 5250, and USD 8750 respectively.
10. Is the market size provided in terms of value or volume?
The market size is provided in terms of value, measured in billion.
11. Are there any specific market keywords associated with the report?
Yes, the market keyword associated with the report is "Pharmaceutical 3PL Market," which aids in identifying and referencing the specific market segment covered.
12. How do I determine which pricing option suits my needs best?
The pricing options vary based on user requirements and access needs. Individual users may opt for single-user licenses, while businesses requiring broader access may choose multi-user or enterprise licenses for cost-effective access to the report.
13. Are there any additional resources or data provided in the Pharmaceutical 3PL Market report?
While the report offers comprehensive insights, it's advisable to review the specific contents or supplementary materials provided to ascertain if additional resources or data are available.
14. How can I stay updated on further developments or reports in the Pharmaceutical 3PL Market?
To stay informed about further developments, trends, and reports in the Pharmaceutical 3PL Market, consider subscribing to industry newsletters, following relevant companies and organizations, or regularly checking reputable industry news sources and publications.
Methodology
Step 1 - Identification of Relevant Samples Size from Population Database


Step 2 - Approaches for Defining Global Market Size (Value, Volume* & Price*)

Note*: In applicable scenarios
Step 3 - Data Sources
Primary Research
- Web Analytics
- Survey Reports
- Research Institute
- Latest Research Reports
- Opinion Leaders
Secondary Research
- Annual Reports
- White Paper
- Latest Press Release
- Industry Association
- Paid Database
- Investor Presentations

Step 4 - Data Triangulation
Involves using different sources of information in order to increase the validity of a study
These sources are likely to be stakeholders in a program - participants, other researchers, program staff, other community members, and so on.
Then we put all data in single framework & apply various statistical tools to find out the dynamic on the market.
During the analysis stage, feedback from the stakeholder groups would be compared to determine areas of agreement as well as areas of divergence