

Key Insights
The Satellite Communication (SATCOM) market is poised for significant expansion, driven by escalating demand for high-bandwidth connectivity across diverse industries. The market is projected to reach $98.28 billion by 2025, with a Compound Annual Growth Rate (CAGR) of 11% from the base year 2025 to 2033. Key growth catalysts include the burgeoning proliferation of IoT devices, the increasing adoption of cloud computing solutions, and the critical need for reliable connectivity in remote and underserved regions. Technological advancements, such as the development of more efficient satellites and the expansion of high-throughput satellite constellations, are also major contributors to market growth. The SATCOM industry is segmented by satellite mass, orbit class (GEO, LEO, MEO), communication type (broadcasting, mobile, satellite phone), and end-user (commercial, military & government). Leading players like SpaceX, L3Harris, Intelsat, and Airbus are at the forefront of innovation in this dynamic sector.
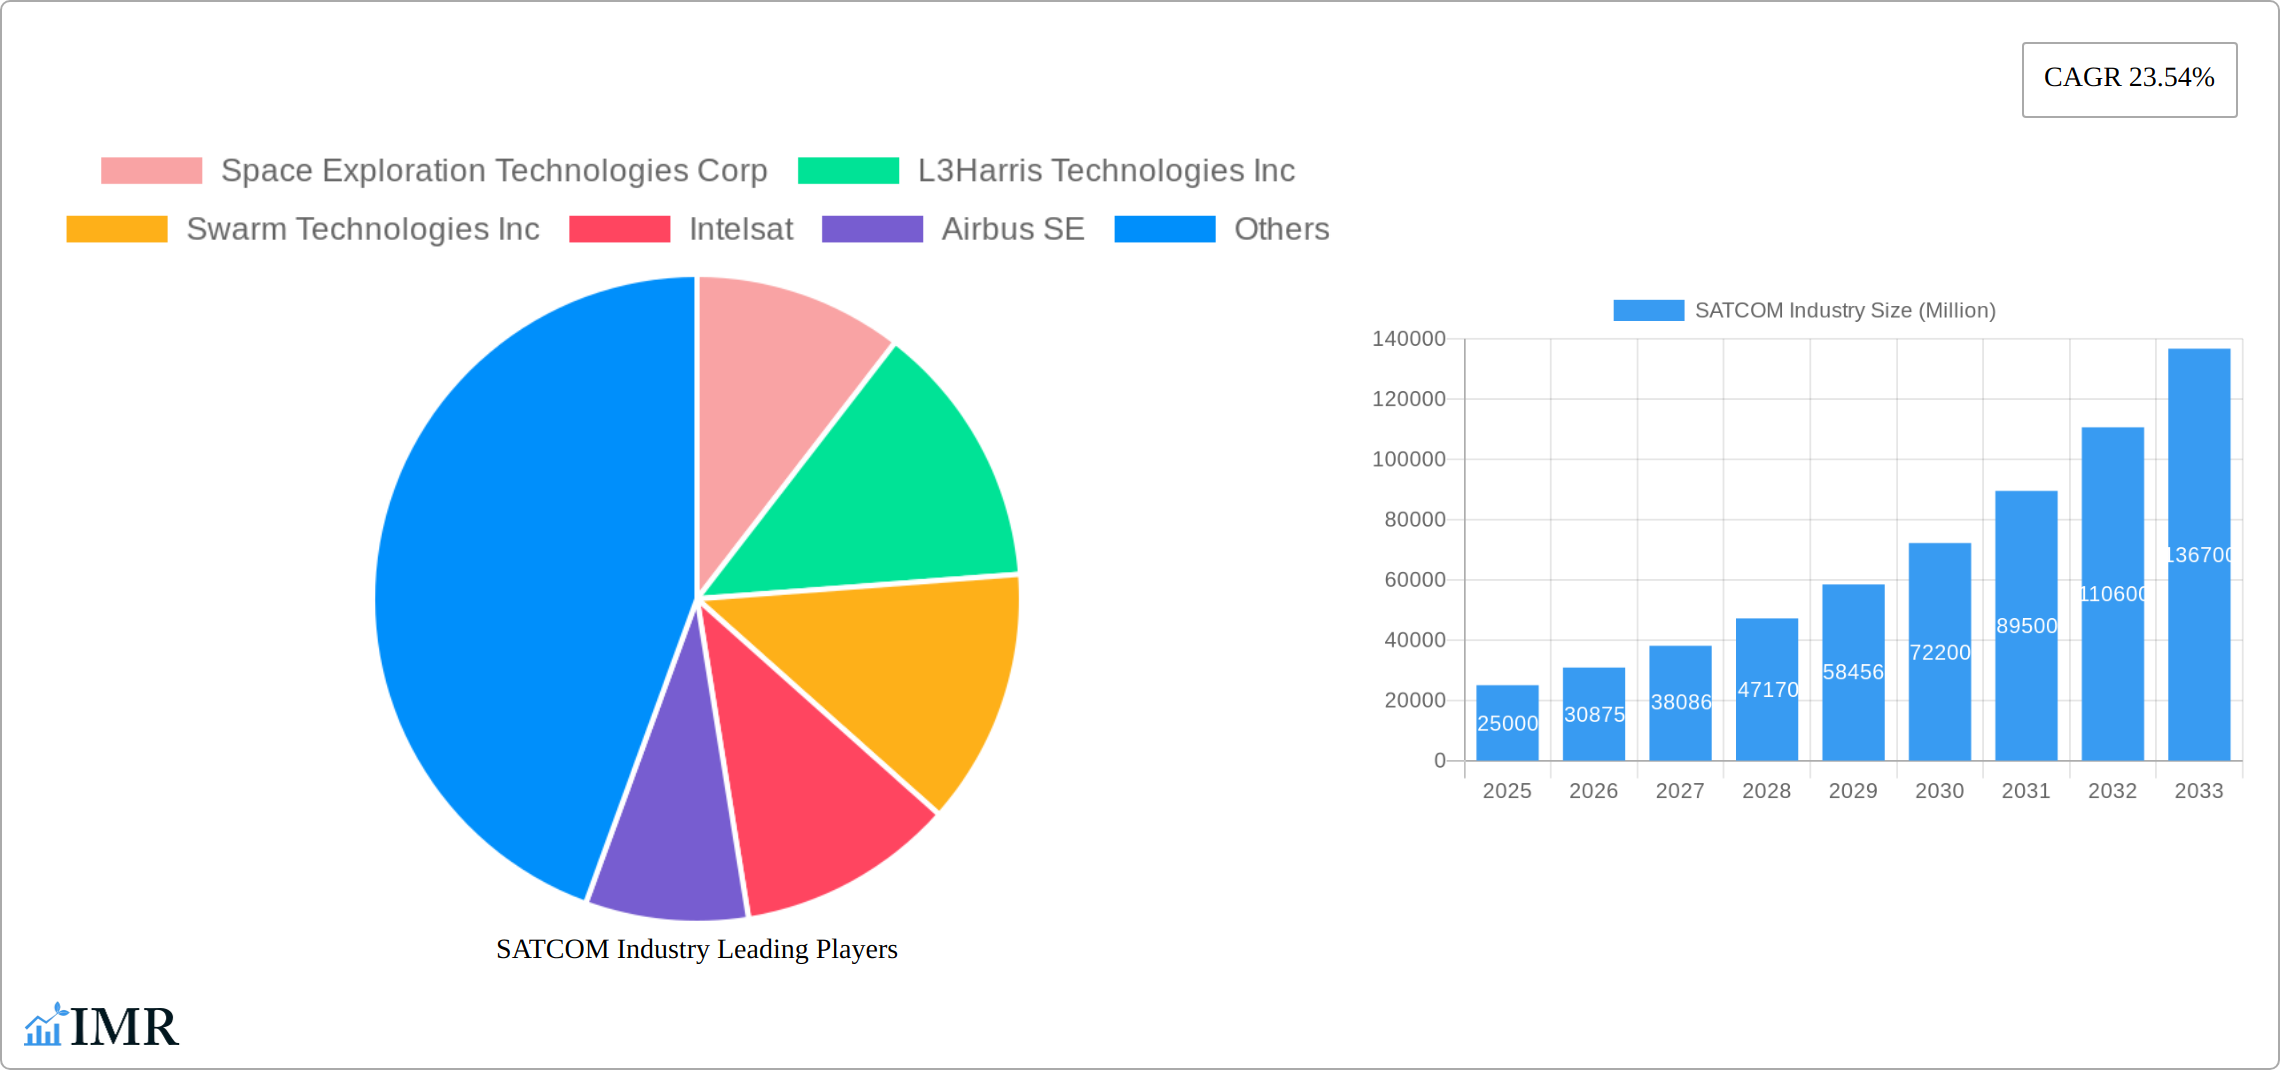
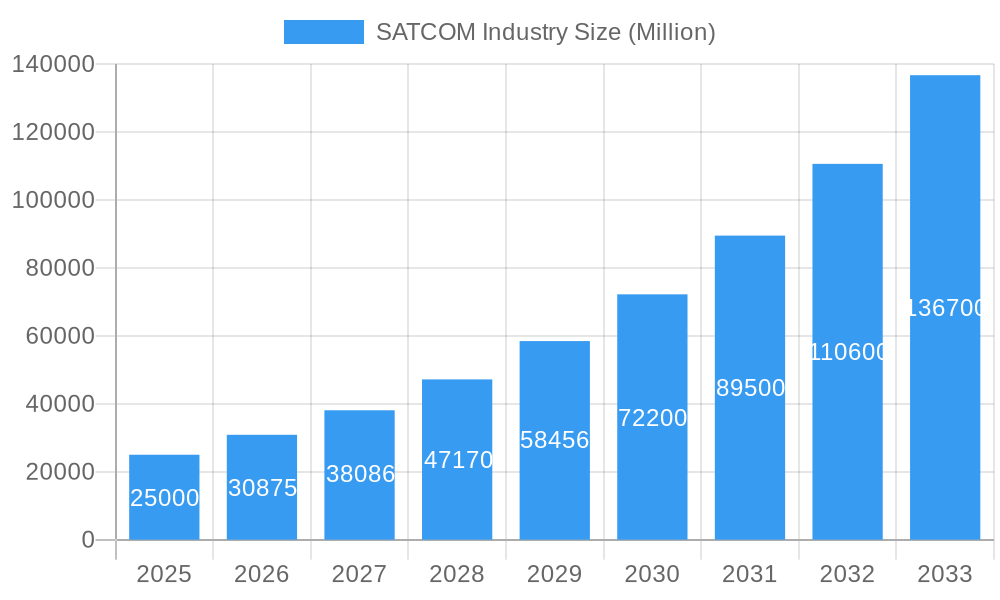
SATCOM Industry Market Size (In Billion)
Further market acceleration stems from the integration of emerging technologies like 5G and the global drive for enhanced broadband access. Government investments in national space programs and communication infrastructure are also bolstering market expansion. Notwithstanding these opportunities, the industry faces challenges including the substantial costs associated with satellite launches and operations, evolving regulatory landscapes, and concerns regarding signal interference and cybersecurity. Despite these obstacles, the SATCOM industry presents a robust long-term growth trajectory, with substantial opportunities anticipated across various segments and geographies, propelled by continuous technological innovation and the persistent demand for ubiquitous global connectivity.
SATCOM Industry Company Market Share
SATCOM Industry Market Report: 2019-2033
This comprehensive report provides a detailed analysis of the Satellite Communication (SATCOM) industry, encompassing market dynamics, growth trends, key players, and future outlook. The study period covers 2019-2033, with 2025 as the base and estimated year. This report is essential for industry professionals, investors, and strategists seeking in-depth insights into this rapidly evolving sector. The report segments the market by satellite mass, orbit class, communication type, and end-user, providing granular analysis to inform strategic decision-making. Market values are presented in million units.
SATCOM Industry Market Dynamics & Structure
The Satellite Communication (SATCOM) industry is characterized by a moderately concentrated market structure, where several large, established players command significant influence across diverse market segments. A primary catalyst for market evolution is relentless technological innovation. This is prominently seen in the development of miniaturized, highly efficient satellites and the continuous advancement of sophisticated networking architectures. Navigating the industry necessitates a deep understanding of stringent regulatory frameworks, particularly concerning spectrum allocation and the operational parameters of satellite systems, which fundamentally shape market dynamics. While terrestrial communication technologies, such as the pervasive 5G networks, present a competitive landscape, SATCOM retains an indispensable advantage in providing connectivity solutions for remote, underserved, and challenging geographical environments. The industry's end-user base is remarkably diversified, spanning critical sectors including commercial enterprises, military and government operations, and a spectrum of other specialized applications. The recent past has witnessed a notable surge in Mergers & Acquisitions (M&A) activity, a trend anticipated to persist as organizations strategically consolidate to achieve economies of scale, broaden their service portfolios, and enhance their overall operational capabilities and technological prowess.
- Market Concentration: The SATCOM market exhibits moderate concentration, with the top 5 industry leaders projected to collectively hold approximately 60-70% of the global market share by the end of 2025.
- Technological Innovation: Key drivers include the ongoing miniaturization of satellite platforms, substantial increases in bandwidth capacity, and persistent efforts to enhance overall system efficiency and reliability.
- Regulatory Frameworks: The industry operates within a complex web of regulatory requirements that vary significantly across different geographical regions, directly impacting market entry strategies, operational permits, and capital investment decisions.
- Competitive Substitutes: Terrestrial communication networks, most notably 5G, pose a significant competitive challenge, particularly in densely populated urban and suburban areas where robust ground-based infrastructure is readily available.
- End-User Demographics: The commercial sector currently represents the largest segment of SATCOM service utilization, followed closely by the Military & Government sector, and then a diversified "Other" category encompassing various niche applications.
- M&A Trends: Continued consolidation is a strong expectation, with analysts forecasting approximately 8-12 major M&A transactions between 2025 and 2033, driven by the pursuit of enhanced capabilities and market expansion. Significant barriers to innovation include substantial Research & Development (R&D) expenditures and the intricate nature of regulatory approval processes.
SATCOM Industry Growth Trends & Insights
The global SATCOM market has demonstrated robust and significant growth throughout the historical period spanning 2019 to 2024, predominantly propelled by an escalating demand for high-bandwidth, reliable connectivity solutions across a wide array of industrial and consumer sectors. Projections indicate that the market size is poised for substantial expansion, with an anticipated Compound Annual Growth Rate (CAGR) of approximately 12-15% during the forecast period from 2025 to 2033. This upward trajectory is expected to culminate in a market valuation of roughly USD 350-400 billion by the year 2033. This impressive growth is being fueled by several transformative technological advancements, including the rapid proliferation of Low Earth Orbit (LEO) satellite constellations, the increasing adoption of flexible and adaptable Software Defined Radios (SDRs), and an ever-growing imperative to deliver high-speed broadband services to previously underserved remote and rural geographies. Shifting consumer behaviors, characterized by an increased reliance on data-intensive applications, streaming services, and the expansion of the Internet of Things (IoT) ecosystem, are further accelerating market expansion. Consequently, SATCOM market penetration is projected to rise from an estimated 20-25% in 2025 to a substantial 40-50% by 2033, with developing economies playing a pivotal role in this growth narrative.
Dominant Regions, Countries, or Segments in SATCOM Industry
Currently, North America and Europe stand as the foremost contributors to the global SATCOM market share. This dominance is underpinned by substantial government investments in advanced defense capabilities and critical communication infrastructure, coupled with a high density of commercial entities relying on satellite connectivity. However, the Asia-Pacific region is emerging as the fastest-growing market, propelled by rapid economic development, substantial investments in expanding telecommunications infrastructure, and a burgeoning adoption of satellite-based services across various economic sectors. Within the market segmentation, the Low Earth Orbit (LEO) segment is exhibiting the most dynamic growth rate. This is largely attributed to its inherent capability to deliver low-latency broadband connectivity and the ongoing, large-scale deployment of numerous LEO satellite constellations. While the Commercial end-user segment continues to represent the largest share, the Military & Government segment is anticipated to experience significant expansion, driven by increasing national defense budgets and evolving security imperatives.
- Key Drivers (North America & Europe): Sustained strong government spending on defense and critical infrastructure, widespread adoption of cutting-edge satellite technologies, and the presence of highly established communication infrastructure.
- Key Drivers (Asia-Pacific): Rapid economic expansion, a surging demand for ubiquitous broadband internet access, and proactive government initiatives aimed at enhancing digital connectivity.
- Dominant Segments: Globally, the LEO orbit class, the Commercial end-user segment, Broadcasting as a communication type, and satellites with a mass range of 10-100kg are currently dominant or exhibiting the highest growth.
SATCOM Industry Product Landscape
The SATCOM product landscape is undergoing a period of rapid and transformative evolution. A central focus of innovation lies in the design and deployment of smaller, lighter satellite platforms that offer significantly enhanced bandwidth capabilities and leverage the latest advancements in network technologies. Emerging products are meticulously engineered to deliver improved performance metrics, including higher throughput capacities, reduced latency for near real-time communication, and augmented reliability in demanding operational environments. Unique selling propositions for these products often stem from proprietary technologies integrated into antenna designs, advanced signal processing algorithms, or sophisticated network management systems. Key technological breakthroughs in this domain include the intelligent incorporation of Artificial Intelligence (AI) and Machine Learning (ML) for dynamic network optimization, as well as the utilization of advanced composite materials to bolster satellite durability and extend operational lifespans.
Key Drivers, Barriers & Challenges in SATCOM Industry
Key Drivers:
- The escalating global demand for reliable broadband connectivity in remote geographical areas and rapidly developing economies.
- Continuous technological advancements that are progressively reducing operational costs and significantly enhancing system performance and capabilities.
- Substantial and ongoing government investment, particularly in defense, national security applications, and the expansion of digital infrastructure.
- The accelerating adoption and integration of Internet of Things (IoT) devices and other data-intensive applications that require ubiquitous and resilient connectivity.
Key Challenges:
- The inherently high initial capital investment required for the research, development, manufacturing, and launch of satellite systems.
- Navigating complex and often disparate regulatory landscapes, alongside persistent challenges in securing sufficient and appropriate radio spectrum allocations.
- Intensifying competition from terrestrial communication technologies, which offer cost-effective alternatives in well-served regions.
- Vulnerability to supply chain disruptions, which can impact the manufacturing processes and delivery timelines for critical satellite components and systems.
Emerging Opportunities in SATCOM Industry
- Expansion into underserved markets in developing countries.
- Growth in IoT and M2M communication applications.
- Development of new applications in areas such as precision agriculture and disaster relief.
- Increased use of satellite-based broadband for maritime and aviation applications.
- Emergence of hybrid satellite-terrestrial communication networks.
Growth Accelerators in the SATCOM Industry
Technological breakthroughs in satellite miniaturization and propulsion systems are crucial drivers, enabling the deployment of larger constellations at reduced costs. Strategic partnerships between satellite operators, technology providers, and end-users foster innovation and market expansion. Effective marketing strategies focusing on the unique advantages of SATCOM in areas with limited terrestrial infrastructure are key to driving further adoption.
Key Players Shaping the SATCOM Industry Market
- Space Exploration Technologies Corp
- L3Harris Technologies Inc
- Swarm Technologies Inc
- Intelsat
- Airbus SE
- Viasat Inc
- Cobham Limited
- China Aerospace Science and Technology Corporation (CASC)
- Thales
- SKY Perfect JSAT Corporation
- SES S.A.
- Maxar Technologies Inc
- Thuraya Telecommunications Company
- EchoStar Corporation
Notable Milestones in SATCOM Industry Sector
- February 2023: Anuvu partners with Telesat to develop new antennas and ground station infrastructure for Anuvu Constellation.
- February 2023: SES, ThinKom, and Hughes demonstrate a multi-orbit service for government aerial missions using ThinAir Ka2517 terminal.
- January 2023: Viasat wins US Marine Corps contract for end-to-end satellite communication support.
In-Depth SATCOM Industry Market Outlook
The future of the SATCOM industry looks bright, fueled by continuous technological advancements, expanding applications, and increased demand for global connectivity. Strategic investments in LEO constellations, alongside innovations in satellite technology and network architectures, will unlock significant market potential. Companies that effectively adapt to evolving market dynamics, embrace technological innovations, and foster strong partnerships will be well-positioned for long-term success in this dynamic industry.
SATCOM Industry Segmentation
-
1. Satellite Mass
- 1.1. 10-100kg
- 1.2. 100-500kg
- 1.3. 500-1000kg
- 1.4. Below 10 Kg
- 1.5. above 1000kg
-
2. Orbit Class
- 2.1. GEO
- 2.2. LEO
- 2.3. MEO
-
3. Communication Type
- 3.1. Broadcasting
- 3.2. Mobile Communication
- 3.3. Satellite Phone
- 3.4. Others
-
4. End User
- 4.1. Commercial
- 4.2. Military & Government
- 4.3. Other
SATCOM Industry Segmentation By Geography
-
1. North America
- 1.1. United States
- 1.2. Canada
- 1.3. Mexico
-
2. South America
- 2.1. Brazil
- 2.2. Argentina
- 2.3. Rest of South America
-
3. Europe
- 3.1. United Kingdom
- 3.2. Germany
- 3.3. France
- 3.4. Italy
- 3.5. Spain
- 3.6. Russia
- 3.7. Benelux
- 3.8. Nordics
- 3.9. Rest of Europe
-
4. Middle East & Africa
- 4.1. Turkey
- 4.2. Israel
- 4.3. GCC
- 4.4. North Africa
- 4.5. South Africa
- 4.6. Rest of Middle East & Africa
-
5. Asia Pacific
- 5.1. China
- 5.2. India
- 5.3. Japan
- 5.4. South Korea
- 5.5. ASEAN
- 5.6. Oceania
- 5.7. Rest of Asia Pacific
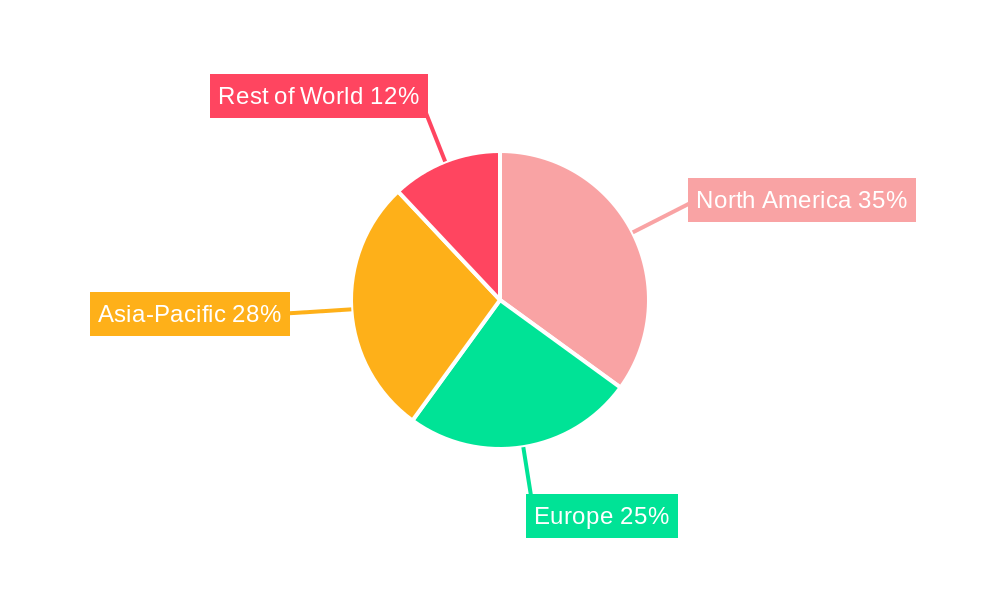
SATCOM Industry Regional Market Share
Geographic Coverage of SATCOM Industry
SATCOM Industry REPORT HIGHLIGHTS
| Aspects | Details |
|---|---|
| Study Period | 2020-2034 |
| Base Year | 2025 |
| Estimated Year | 2026 |
| Forecast Period | 2026-2034 |
| Historical Period | 2020-2025 |
| Growth Rate | CAGR of 11% from 2020-2034 |
| Segmentation |
|
Table of Contents
- 1. Introduction
- 1.1. Research Scope
- 1.2. Market Segmentation
- 1.3. Research Objective
- 1.4. Definitions and Assumptions
- 2. Executive Summary
- 2.1. Market Snapshot
- 3. Market Dynamics
- 3.1. Market Drivers
- 3.2. Market Restrains
- 3.3. Market Trends
- 3.4. Market Opportunities
- 4. Market Factor Analysis
- 4.1. Porters Five Forces
- 4.1.1. Bargaining Power of Suppliers
- 4.1.2. Bargaining Power of Buyers
- 4.1.3. Threat of New Entrants
- 4.1.4. Threat of Substitutes
- 4.1.5. Competitive Rivalry
- 4.2. PESTEL analysis
- 4.3. BCG Analysis
- 4.3.1. Stars (High Growth, High Market Share)
- 4.3.2. Cash Cows (Low Growth, High Market Share)
- 4.3.3. Question Mark (High Growth, Low Market Share)
- 4.3.4. Dogs (Low Growth, Low Market Share)
- 4.4. Ansoff Matrix Analysis
- 4.5. Supply Chain Analysis
- 4.6. Regulatory Landscape
- 4.7. Current Market Potential and Opportunity Assessment (TAM–SAM–SOM Framework)
- 4.8. IMR Analyst Note
- 4.1. Porters Five Forces
- 5. Market Analysis, Insights and Forecast 2021-2033
- 5.1. Market Analysis, Insights and Forecast - by Satellite Mass
- 5.1.1. 10-100kg
- 5.1.2. 100-500kg
- 5.1.3. 500-1000kg
- 5.1.4. Below 10 Kg
- 5.1.5. above 1000kg
- 5.2. Market Analysis, Insights and Forecast - by Orbit Class
- 5.2.1. GEO
- 5.2.2. LEO
- 5.2.3. MEO
- 5.3. Market Analysis, Insights and Forecast - by Communication Type
- 5.3.1. Broadcasting
- 5.3.2. Mobile Communication
- 5.3.3. Satellite Phone
- 5.3.4. Others
- 5.4. Market Analysis, Insights and Forecast - by End User
- 5.4.1. Commercial
- 5.4.2. Military & Government
- 5.4.3. Other
- 5.5. Market Analysis, Insights and Forecast - by Region
- 5.5.1. North America
- 5.5.2. South America
- 5.5.3. Europe
- 5.5.4. Middle East & Africa
- 5.5.5. Asia Pacific
- 5.1. Market Analysis, Insights and Forecast - by Satellite Mass
- 6. Global SATCOM Industry Analysis, Insights and Forecast, 2021-2033
- 6.1. Market Analysis, Insights and Forecast - by Satellite Mass
- 6.1.1. 10-100kg
- 6.1.2. 100-500kg
- 6.1.3. 500-1000kg
- 6.1.4. Below 10 Kg
- 6.1.5. above 1000kg
- 6.2. Market Analysis, Insights and Forecast - by Orbit Class
- 6.2.1. GEO
- 6.2.2. LEO
- 6.2.3. MEO
- 6.3. Market Analysis, Insights and Forecast - by Communication Type
- 6.3.1. Broadcasting
- 6.3.2. Mobile Communication
- 6.3.3. Satellite Phone
- 6.3.4. Others
- 6.4. Market Analysis, Insights and Forecast - by End User
- 6.4.1. Commercial
- 6.4.2. Military & Government
- 6.4.3. Other
- 6.1. Market Analysis, Insights and Forecast - by Satellite Mass
- 7. North America SATCOM Industry Analysis, Insights and Forecast, 2020-2032
- 7.1. Market Analysis, Insights and Forecast - by Satellite Mass
- 7.1.1. 10-100kg
- 7.1.2. 100-500kg
- 7.1.3. 500-1000kg
- 7.1.4. Below 10 Kg
- 7.1.5. above 1000kg
- 7.2. Market Analysis, Insights and Forecast - by Orbit Class
- 7.2.1. GEO
- 7.2.2. LEO
- 7.2.3. MEO
- 7.3. Market Analysis, Insights and Forecast - by Communication Type
- 7.3.1. Broadcasting
- 7.3.2. Mobile Communication
- 7.3.3. Satellite Phone
- 7.3.4. Others
- 7.4. Market Analysis, Insights and Forecast - by End User
- 7.4.1. Commercial
- 7.4.2. Military & Government
- 7.4.3. Other
- 7.1. Market Analysis, Insights and Forecast - by Satellite Mass
- 8. South America SATCOM Industry Analysis, Insights and Forecast, 2020-2032
- 8.1. Market Analysis, Insights and Forecast - by Satellite Mass
- 8.1.1. 10-100kg
- 8.1.2. 100-500kg
- 8.1.3. 500-1000kg
- 8.1.4. Below 10 Kg
- 8.1.5. above 1000kg
- 8.2. Market Analysis, Insights and Forecast - by Orbit Class
- 8.2.1. GEO
- 8.2.2. LEO
- 8.2.3. MEO
- 8.3. Market Analysis, Insights and Forecast - by Communication Type
- 8.3.1. Broadcasting
- 8.3.2. Mobile Communication
- 8.3.3. Satellite Phone
- 8.3.4. Others
- 8.4. Market Analysis, Insights and Forecast - by End User
- 8.4.1. Commercial
- 8.4.2. Military & Government
- 8.4.3. Other
- 8.1. Market Analysis, Insights and Forecast - by Satellite Mass
- 9. Europe SATCOM Industry Analysis, Insights and Forecast, 2020-2032
- 9.1. Market Analysis, Insights and Forecast - by Satellite Mass
- 9.1.1. 10-100kg
- 9.1.2. 100-500kg
- 9.1.3. 500-1000kg
- 9.1.4. Below 10 Kg
- 9.1.5. above 1000kg
- 9.2. Market Analysis, Insights and Forecast - by Orbit Class
- 9.2.1. GEO
- 9.2.2. LEO
- 9.2.3. MEO
- 9.3. Market Analysis, Insights and Forecast - by Communication Type
- 9.3.1. Broadcasting
- 9.3.2. Mobile Communication
- 9.3.3. Satellite Phone
- 9.3.4. Others
- 9.4. Market Analysis, Insights and Forecast - by End User
- 9.4.1. Commercial
- 9.4.2. Military & Government
- 9.4.3. Other
- 9.1. Market Analysis, Insights and Forecast - by Satellite Mass
- 10. Middle East & Africa SATCOM Industry Analysis, Insights and Forecast, 2020-2032
- 10.1. Market Analysis, Insights and Forecast - by Satellite Mass
- 10.1.1. 10-100kg
- 10.1.2. 100-500kg
- 10.1.3. 500-1000kg
- 10.1.4. Below 10 Kg
- 10.1.5. above 1000kg
- 10.2. Market Analysis, Insights and Forecast - by Orbit Class
- 10.2.1. GEO
- 10.2.2. LEO
- 10.2.3. MEO
- 10.3. Market Analysis, Insights and Forecast - by Communication Type
- 10.3.1. Broadcasting
- 10.3.2. Mobile Communication
- 10.3.3. Satellite Phone
- 10.3.4. Others
- 10.4. Market Analysis, Insights and Forecast - by End User
- 10.4.1. Commercial
- 10.4.2. Military & Government
- 10.4.3. Other
- 10.1. Market Analysis, Insights and Forecast - by Satellite Mass
- 11. Asia Pacific SATCOM Industry Analysis, Insights and Forecast, 2020-2032
- 11.1. Market Analysis, Insights and Forecast - by Satellite Mass
- 11.1.1. 10-100kg
- 11.1.2. 100-500kg
- 11.1.3. 500-1000kg
- 11.1.4. Below 10 Kg
- 11.1.5. above 1000kg
- 11.2. Market Analysis, Insights and Forecast - by Orbit Class
- 11.2.1. GEO
- 11.2.2. LEO
- 11.2.3. MEO
- 11.3. Market Analysis, Insights and Forecast - by Communication Type
- 11.3.1. Broadcasting
- 11.3.2. Mobile Communication
- 11.3.3. Satellite Phone
- 11.3.4. Others
- 11.4. Market Analysis, Insights and Forecast - by End User
- 11.4.1. Commercial
- 11.4.2. Military & Government
- 11.4.3. Other
- 11.1. Market Analysis, Insights and Forecast - by Satellite Mass
- 12. Competitive Analysis
- 12.1. Company Profiles
- 12.1.1 Space Exploration Technologies Corp
- 12.1.1.1. Company Overview
- 12.1.1.2. Products
- 12.1.1.3. Company Financials
- 12.1.1.4. SWOT Analysis
- 12.1.2 L3Harris Technologies Inc
- 12.1.2.1. Company Overview
- 12.1.2.2. Products
- 12.1.2.3. Company Financials
- 12.1.2.4. SWOT Analysis
- 12.1.3 Swarm Technologies Inc
- 12.1.3.1. Company Overview
- 12.1.3.2. Products
- 12.1.3.3. Company Financials
- 12.1.3.4. SWOT Analysis
- 12.1.4 Intelsat
- 12.1.4.1. Company Overview
- 12.1.4.2. Products
- 12.1.4.3. Company Financials
- 12.1.4.4. SWOT Analysis
- 12.1.5 Airbus SE
- 12.1.5.1. Company Overview
- 12.1.5.2. Products
- 12.1.5.3. Company Financials
- 12.1.5.4. SWOT Analysis
- 12.1.6 Viasat Inc
- 12.1.6.1. Company Overview
- 12.1.6.2. Products
- 12.1.6.3. Company Financials
- 12.1.6.4. SWOT Analysis
- 12.1.7 Cobham Limited
- 12.1.7.1. Company Overview
- 12.1.7.2. Products
- 12.1.7.3. Company Financials
- 12.1.7.4. SWOT Analysis
- 12.1.8 China Aerospace Science and Technology Corporation (CASC)
- 12.1.8.1. Company Overview
- 12.1.8.2. Products
- 12.1.8.3. Company Financials
- 12.1.8.4. SWOT Analysis
- 12.1.9 Thales
- 12.1.9.1. Company Overview
- 12.1.9.2. Products
- 12.1.9.3. Company Financials
- 12.1.9.4. SWOT Analysis
- 12.1.10 SKY Perfect JSAT Corporation
- 12.1.10.1. Company Overview
- 12.1.10.2. Products
- 12.1.10.3. Company Financials
- 12.1.10.4. SWOT Analysis
- 12.1.11 SES S A
- 12.1.11.1. Company Overview
- 12.1.11.2. Products
- 12.1.11.3. Company Financials
- 12.1.11.4. SWOT Analysis
- 12.1.12 Maxar Technologies Inc
- 12.1.12.1. Company Overview
- 12.1.12.2. Products
- 12.1.12.3. Company Financials
- 12.1.12.4. SWOT Analysis
- 12.1.13 Thuraya Telecommunications Company
- 12.1.13.1. Company Overview
- 12.1.13.2. Products
- 12.1.13.3. Company Financials
- 12.1.13.4. SWOT Analysis
- 12.1.14 EchoStar Corporation
- 12.1.14.1. Company Overview
- 12.1.14.2. Products
- 12.1.14.3. Company Financials
- 12.1.14.4. SWOT Analysis
- 12.1.1 Space Exploration Technologies Corp
- 12.2. Market Entropy
- 12.2.1 Company's Key Areas Served
- 12.2.2 Recent Developments
- 12.3. Company Market Share Analysis 2025
- 12.3.1 Top 5 Companies Market Share Analysis
- 12.3.2 Top 3 Companies Market Share Analysis
- 12.4. List of Potential Customers
- 13. Research Methodology
List of Figures
- Figure 1: Global SATCOM Industry Revenue Breakdown (billion, %) by Region 2025 & 2033
- Figure 2: North America SATCOM Industry Revenue (billion), by Satellite Mass 2025 & 2033
- Figure 3: North America SATCOM Industry Revenue Share (%), by Satellite Mass 2025 & 2033
- Figure 4: North America SATCOM Industry Revenue (billion), by Orbit Class 2025 & 2033
- Figure 5: North America SATCOM Industry Revenue Share (%), by Orbit Class 2025 & 2033
- Figure 6: North America SATCOM Industry Revenue (billion), by Communication Type 2025 & 2033
- Figure 7: North America SATCOM Industry Revenue Share (%), by Communication Type 2025 & 2033
- Figure 8: North America SATCOM Industry Revenue (billion), by End User 2025 & 2033
- Figure 9: North America SATCOM Industry Revenue Share (%), by End User 2025 & 2033
- Figure 10: North America SATCOM Industry Revenue (billion), by Country 2025 & 2033
- Figure 11: North America SATCOM Industry Revenue Share (%), by Country 2025 & 2033
- Figure 12: South America SATCOM Industry Revenue (billion), by Satellite Mass 2025 & 2033
- Figure 13: South America SATCOM Industry Revenue Share (%), by Satellite Mass 2025 & 2033
- Figure 14: South America SATCOM Industry Revenue (billion), by Orbit Class 2025 & 2033
- Figure 15: South America SATCOM Industry Revenue Share (%), by Orbit Class 2025 & 2033
- Figure 16: South America SATCOM Industry Revenue (billion), by Communication Type 2025 & 2033
- Figure 17: South America SATCOM Industry Revenue Share (%), by Communication Type 2025 & 2033
- Figure 18: South America SATCOM Industry Revenue (billion), by End User 2025 & 2033
- Figure 19: South America SATCOM Industry Revenue Share (%), by End User 2025 & 2033
- Figure 20: South America SATCOM Industry Revenue (billion), by Country 2025 & 2033
- Figure 21: South America SATCOM Industry Revenue Share (%), by Country 2025 & 2033
- Figure 22: Europe SATCOM Industry Revenue (billion), by Satellite Mass 2025 & 2033
- Figure 23: Europe SATCOM Industry Revenue Share (%), by Satellite Mass 2025 & 2033
- Figure 24: Europe SATCOM Industry Revenue (billion), by Orbit Class 2025 & 2033
- Figure 25: Europe SATCOM Industry Revenue Share (%), by Orbit Class 2025 & 2033
- Figure 26: Europe SATCOM Industry Revenue (billion), by Communication Type 2025 & 2033
- Figure 27: Europe SATCOM Industry Revenue Share (%), by Communication Type 2025 & 2033
- Figure 28: Europe SATCOM Industry Revenue (billion), by End User 2025 & 2033
- Figure 29: Europe SATCOM Industry Revenue Share (%), by End User 2025 & 2033
- Figure 30: Europe SATCOM Industry Revenue (billion), by Country 2025 & 2033
- Figure 31: Europe SATCOM Industry Revenue Share (%), by Country 2025 & 2033
- Figure 32: Middle East & Africa SATCOM Industry Revenue (billion), by Satellite Mass 2025 & 2033
- Figure 33: Middle East & Africa SATCOM Industry Revenue Share (%), by Satellite Mass 2025 & 2033
- Figure 34: Middle East & Africa SATCOM Industry Revenue (billion), by Orbit Class 2025 & 2033
- Figure 35: Middle East & Africa SATCOM Industry Revenue Share (%), by Orbit Class 2025 & 2033
- Figure 36: Middle East & Africa SATCOM Industry Revenue (billion), by Communication Type 2025 & 2033
- Figure 37: Middle East & Africa SATCOM Industry Revenue Share (%), by Communication Type 2025 & 2033
- Figure 38: Middle East & Africa SATCOM Industry Revenue (billion), by End User 2025 & 2033
- Figure 39: Middle East & Africa SATCOM Industry Revenue Share (%), by End User 2025 & 2033
- Figure 40: Middle East & Africa SATCOM Industry Revenue (billion), by Country 2025 & 2033
- Figure 41: Middle East & Africa SATCOM Industry Revenue Share (%), by Country 2025 & 2033
- Figure 42: Asia Pacific SATCOM Industry Revenue (billion), by Satellite Mass 2025 & 2033
- Figure 43: Asia Pacific SATCOM Industry Revenue Share (%), by Satellite Mass 2025 & 2033
- Figure 44: Asia Pacific SATCOM Industry Revenue (billion), by Orbit Class 2025 & 2033
- Figure 45: Asia Pacific SATCOM Industry Revenue Share (%), by Orbit Class 2025 & 2033
- Figure 46: Asia Pacific SATCOM Industry Revenue (billion), by Communication Type 2025 & 2033
- Figure 47: Asia Pacific SATCOM Industry Revenue Share (%), by Communication Type 2025 & 2033
- Figure 48: Asia Pacific SATCOM Industry Revenue (billion), by End User 2025 & 2033
- Figure 49: Asia Pacific SATCOM Industry Revenue Share (%), by End User 2025 & 2033
- Figure 50: Asia Pacific SATCOM Industry Revenue (billion), by Country 2025 & 2033
- Figure 51: Asia Pacific SATCOM Industry Revenue Share (%), by Country 2025 & 2033
List of Tables
- Table 1: Global SATCOM Industry Revenue billion Forecast, by Satellite Mass 2020 & 2033
- Table 2: Global SATCOM Industry Revenue billion Forecast, by Orbit Class 2020 & 2033
- Table 3: Global SATCOM Industry Revenue billion Forecast, by Communication Type 2020 & 2033
- Table 4: Global SATCOM Industry Revenue billion Forecast, by End User 2020 & 2033
- Table 5: Global SATCOM Industry Revenue billion Forecast, by Region 2020 & 2033
- Table 6: Global SATCOM Industry Revenue billion Forecast, by Satellite Mass 2020 & 2033
- Table 7: Global SATCOM Industry Revenue billion Forecast, by Orbit Class 2020 & 2033
- Table 8: Global SATCOM Industry Revenue billion Forecast, by Communication Type 2020 & 2033
- Table 9: Global SATCOM Industry Revenue billion Forecast, by End User 2020 & 2033
- Table 10: Global SATCOM Industry Revenue billion Forecast, by Country 2020 & 2033
- Table 11: United States SATCOM Industry Revenue (billion) Forecast, by Application 2020 & 2033
- Table 12: Canada SATCOM Industry Revenue (billion) Forecast, by Application 2020 & 2033
- Table 13: Mexico SATCOM Industry Revenue (billion) Forecast, by Application 2020 & 2033
- Table 14: Global SATCOM Industry Revenue billion Forecast, by Satellite Mass 2020 & 2033
- Table 15: Global SATCOM Industry Revenue billion Forecast, by Orbit Class 2020 & 2033
- Table 16: Global SATCOM Industry Revenue billion Forecast, by Communication Type 2020 & 2033
- Table 17: Global SATCOM Industry Revenue billion Forecast, by End User 2020 & 2033
- Table 18: Global SATCOM Industry Revenue billion Forecast, by Country 2020 & 2033
- Table 19: Brazil SATCOM Industry Revenue (billion) Forecast, by Application 2020 & 2033
- Table 20: Argentina SATCOM Industry Revenue (billion) Forecast, by Application 2020 & 2033
- Table 21: Rest of South America SATCOM Industry Revenue (billion) Forecast, by Application 2020 & 2033
- Table 22: Global SATCOM Industry Revenue billion Forecast, by Satellite Mass 2020 & 2033
- Table 23: Global SATCOM Industry Revenue billion Forecast, by Orbit Class 2020 & 2033
- Table 24: Global SATCOM Industry Revenue billion Forecast, by Communication Type 2020 & 2033
- Table 25: Global SATCOM Industry Revenue billion Forecast, by End User 2020 & 2033
- Table 26: Global SATCOM Industry Revenue billion Forecast, by Country 2020 & 2033
- Table 27: United Kingdom SATCOM Industry Revenue (billion) Forecast, by Application 2020 & 2033
- Table 28: Germany SATCOM Industry Revenue (billion) Forecast, by Application 2020 & 2033
- Table 29: France SATCOM Industry Revenue (billion) Forecast, by Application 2020 & 2033
- Table 30: Italy SATCOM Industry Revenue (billion) Forecast, by Application 2020 & 2033
- Table 31: Spain SATCOM Industry Revenue (billion) Forecast, by Application 2020 & 2033
- Table 32: Russia SATCOM Industry Revenue (billion) Forecast, by Application 2020 & 2033
- Table 33: Benelux SATCOM Industry Revenue (billion) Forecast, by Application 2020 & 2033
- Table 34: Nordics SATCOM Industry Revenue (billion) Forecast, by Application 2020 & 2033
- Table 35: Rest of Europe SATCOM Industry Revenue (billion) Forecast, by Application 2020 & 2033
- Table 36: Global SATCOM Industry Revenue billion Forecast, by Satellite Mass 2020 & 2033
- Table 37: Global SATCOM Industry Revenue billion Forecast, by Orbit Class 2020 & 2033
- Table 38: Global SATCOM Industry Revenue billion Forecast, by Communication Type 2020 & 2033
- Table 39: Global SATCOM Industry Revenue billion Forecast, by End User 2020 & 2033
- Table 40: Global SATCOM Industry Revenue billion Forecast, by Country 2020 & 2033
- Table 41: Turkey SATCOM Industry Revenue (billion) Forecast, by Application 2020 & 2033
- Table 42: Israel SATCOM Industry Revenue (billion) Forecast, by Application 2020 & 2033
- Table 43: GCC SATCOM Industry Revenue (billion) Forecast, by Application 2020 & 2033
- Table 44: North Africa SATCOM Industry Revenue (billion) Forecast, by Application 2020 & 2033
- Table 45: South Africa SATCOM Industry Revenue (billion) Forecast, by Application 2020 & 2033
- Table 46: Rest of Middle East & Africa SATCOM Industry Revenue (billion) Forecast, by Application 2020 & 2033
- Table 47: Global SATCOM Industry Revenue billion Forecast, by Satellite Mass 2020 & 2033
- Table 48: Global SATCOM Industry Revenue billion Forecast, by Orbit Class 2020 & 2033
- Table 49: Global SATCOM Industry Revenue billion Forecast, by Communication Type 2020 & 2033
- Table 50: Global SATCOM Industry Revenue billion Forecast, by End User 2020 & 2033
- Table 51: Global SATCOM Industry Revenue billion Forecast, by Country 2020 & 2033
- Table 52: China SATCOM Industry Revenue (billion) Forecast, by Application 2020 & 2033
- Table 53: India SATCOM Industry Revenue (billion) Forecast, by Application 2020 & 2033
- Table 54: Japan SATCOM Industry Revenue (billion) Forecast, by Application 2020 & 2033
- Table 55: South Korea SATCOM Industry Revenue (billion) Forecast, by Application 2020 & 2033
- Table 56: ASEAN SATCOM Industry Revenue (billion) Forecast, by Application 2020 & 2033
- Table 57: Oceania SATCOM Industry Revenue (billion) Forecast, by Application 2020 & 2033
- Table 58: Rest of Asia Pacific SATCOM Industry Revenue (billion) Forecast, by Application 2020 & 2033
Frequently Asked Questions
1. What is the projected Compound Annual Growth Rate (CAGR) of the SATCOM Industry?
The projected CAGR is approximately 11%.
2. Which companies are prominent players in the SATCOM Industry?
Key companies in the market include Space Exploration Technologies Corp, L3Harris Technologies Inc, Swarm Technologies Inc, Intelsat, Airbus SE, Viasat Inc, Cobham Limited, China Aerospace Science and Technology Corporation (CASC), Thales, SKY Perfect JSAT Corporation, SES S A, Maxar Technologies Inc, Thuraya Telecommunications Company, EchoStar Corporation.
3. What are the main segments of the SATCOM Industry?
The market segments include Satellite Mass, Orbit Class, Communication Type, End User.
4. Can you provide details about the market size?
The market size is estimated to be USD 98.28 billion as of 2022.
5. What are some drivers contributing to market growth?
N/A
6. What are the notable trends driving market growth?
OTHER KEY INDUSTRY TRENDS COVERED IN THE REPORT.
7. Are there any restraints impacting market growth?
N/A
8. Can you provide examples of recent developments in the market?
February 2023: Anuvu, a provider of high-speed connectivity solutions has signed an agreement with Telesat for new antennas and ground-station infrastructure to support the development of the Anuvu Constellation.February 2023: SES, in partnership with ThinKom and Hughes, has introduced a revolutionary high-performance multi-orbit service capable of supporting multiple solutions for government aerial missions. Open Architecture ThinKom ThinAir Ka2517 aerial satcom terminal has been successfully demonstrated on SES's Medium Earth Orbit (MEO) and Geostationary (GEO) satellite networksJanuary 2023: Satellite communications provider Viasat has been awarded a contract by the United States Marine Corps to provide end-to-end satellite communications support, extending the agreement under which it provides satellite communications solutions under managed services.
9. What pricing options are available for accessing the report?
Pricing options include single-user, multi-user, and enterprise licenses priced at USD 3800, USD 4500, and USD 5800 respectively.
10. Is the market size provided in terms of value or volume?
The market size is provided in terms of value, measured in billion.
11. Are there any specific market keywords associated with the report?
Yes, the market keyword associated with the report is "SATCOM Industry," which aids in identifying and referencing the specific market segment covered.
12. How do I determine which pricing option suits my needs best?
The pricing options vary based on user requirements and access needs. Individual users may opt for single-user licenses, while businesses requiring broader access may choose multi-user or enterprise licenses for cost-effective access to the report.
13. Are there any additional resources or data provided in the SATCOM Industry report?
While the report offers comprehensive insights, it's advisable to review the specific contents or supplementary materials provided to ascertain if additional resources or data are available.
14. How can I stay updated on further developments or reports in the SATCOM Industry?
To stay informed about further developments, trends, and reports in the SATCOM Industry, consider subscribing to industry newsletters, following relevant companies and organizations, or regularly checking reputable industry news sources and publications.
Methodology
Step 1 - Identification of Relevant Samples Size from Population Database


Step 2 - Approaches for Defining Global Market Size (Value, Volume* & Price*)

Note*: In applicable scenarios
Step 3 - Data Sources
Primary Research
- Web Analytics
- Survey Reports
- Research Institute
- Latest Research Reports
- Opinion Leaders
Secondary Research
- Annual Reports
- White Paper
- Latest Press Release
- Industry Association
- Paid Database
- Investor Presentations

Step 4 - Data Triangulation
Involves using different sources of information in order to increase the validity of a study
These sources are likely to be stakeholders in a program - participants, other researchers, program staff, other community members, and so on.
Then we put all data in single framework & apply various statistical tools to find out the dynamic on the market.
During the analysis stage, feedback from the stakeholder groups would be compared to determine areas of agreement as well as areas of divergence