

Key Insights
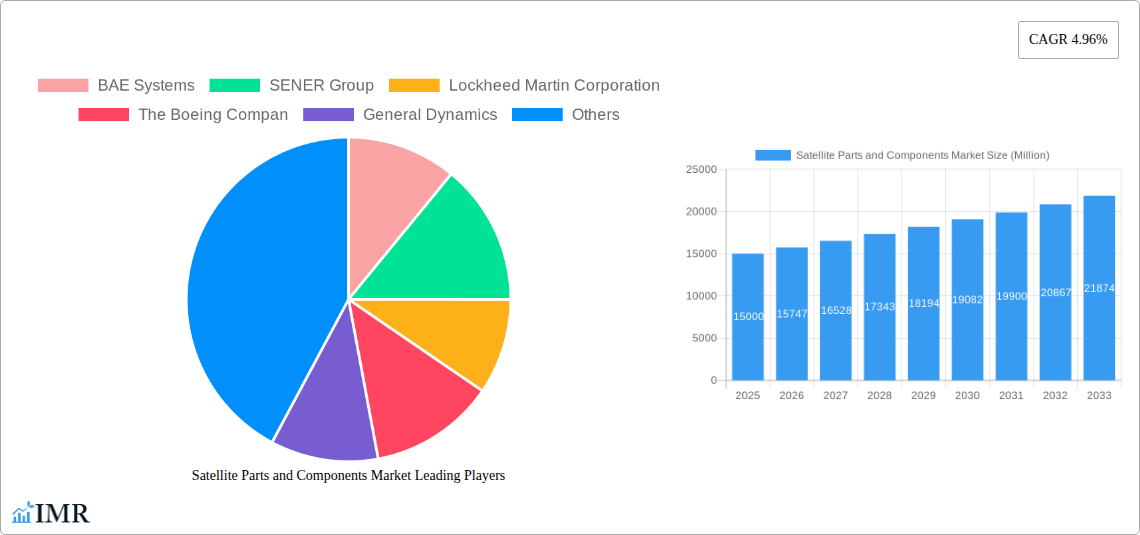
The global Satellite Parts and Components market is poised for significant expansion, fueled by escalating demand for satellite-enabled services across telecommunications, navigation, Earth observation, and defense. Projected to achieve a Compound Annual Growth Rate (CAGR) of 7% from 2025, the market is estimated at $25 billion in the base year 2025, with robust growth anticipated through 2033. Key growth drivers include the proliferation of small satellites, technological advancements leading to miniaturization and cost reduction, and the surge in NewSpace initiatives. Innovations in high-throughput satellites, phased array antennas, and advanced sensor technologies further bolster market expansion. Despite challenges like stringent regulations and high upfront investment, the long-term benefits and increasing commercial viability of satellite technology are driving sustained growth. The market is segmented by component type: Payload (including cameras, sensors, transponders, mission computers), Antenna (parabolic, phased array), and Structure (satellite bus, solar panels, propulsion systems). North America currently leads the market due to substantial investments and a strong industry presence. However, the Asia-Pacific region is expected to experience accelerated growth, driven by government initiatives and increasing private investment. The competitive landscape features established aerospace leaders such as Lockheed Martin, Boeing, and Thales, alongside innovative new entrants specializing in niche components and small satellite platforms, fostering both competition and collaborative advancements.
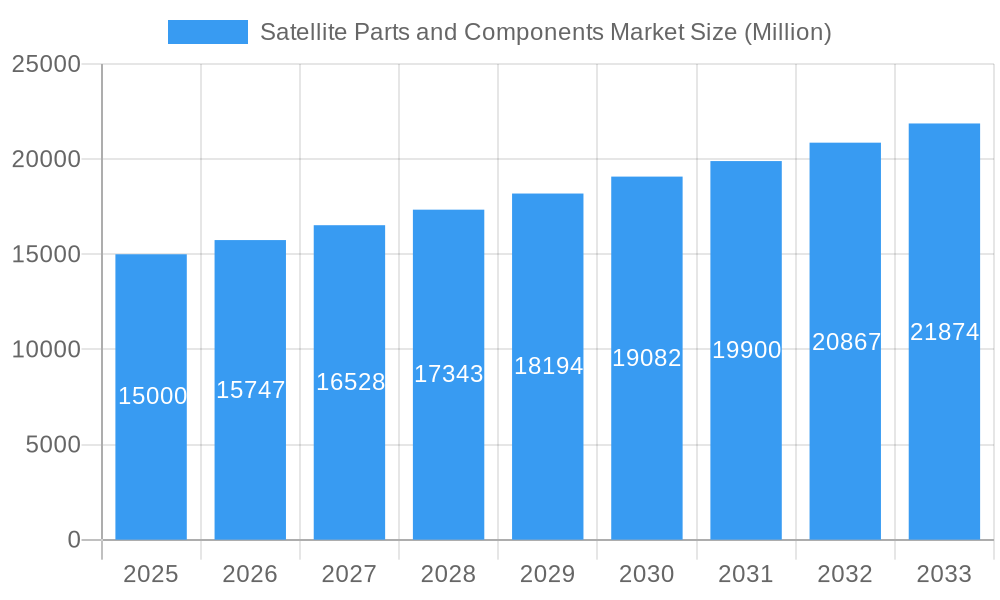
Satellite Parts and Components Market Market Size (In Billion)
The forecast period from 2025 to 2033 is expected to witness substantial market growth, potentially surpassing earlier projections. Continued component miniaturization, coupled with rising demand for Internet of Things (IoT) connectivity and enhanced Earth observation capabilities, will serve as significant growth catalysts. Segments like phased array antennas and advanced sensors are anticipated to outperform others due to their superior performance and broader applications. Expansion into emerging economies, particularly in the Asia-Pacific region, will also contribute to overall market growth. While supply chain complexities may present challenges, the long-term outlook for the Satellite Parts and Components market remains exceptionally positive, driven by ongoing innovation and escalating demand.
Satellite Parts and Components Market Company Market Share
Satellite Parts and Components Market: A Comprehensive Report (2019-2033)
This comprehensive report provides a detailed analysis of the Satellite Parts and Components Market, encompassing market dynamics, growth trends, regional dominance, product landscape, key players, and future outlook. With a study period spanning 2019-2033, a base year of 2025, and a forecast period of 2025-2033, this report offers invaluable insights for industry professionals, investors, and strategic decision-makers. The report analyzes the parent market of aerospace and defense and the child market of satellite technology, providing a holistic view of market segmentation and growth opportunities.
Satellite Parts and Components Market Dynamics & Structure
The Satellite Parts and Components market is characterized by a moderately concentrated landscape, with a few major players holding significant market share. Technological innovation, particularly in miniaturization, advanced materials, and improved sensor technology, are key drivers. Stringent regulatory frameworks governing space launches and satellite operations influence market dynamics. Competitive pressures arise from the emergence of substitute technologies and new entrants. The market is segmented by payload (cameras, sensors, transponders, mission computers), antenna (parabolic antennas, phased array antennas), and structure (satellite bus, solar panels, propulsion systems). M&A activity in the sector has been consistent, with xx million deals recorded between 2019 and 2024, indicating consolidation and strategic expansion efforts.
- Market Concentration: Moderately concentrated, with top 5 players holding approximately xx% market share in 2024.
- Technological Innovation: Miniaturization, AI-powered sensors, and advanced propulsion systems are driving innovation.
- Regulatory Landscape: Stringent international regulations impacting launch approvals and satellite operations.
- Competitive Substitutes: Emerging technologies like CubeSats and nanosatellites pose competitive challenges.
- End-User Demographics: Government agencies (military and civilian), commercial satellite operators, and research institutions.
- M&A Trends: xx million deals recorded between 2019-2024, driven by strategic expansion and technological integration.
Satellite Parts and Components Market Growth Trends & Insights
The Satellite Parts and Components market experienced robust growth between 2019 and 2024, with a Compound Annual Growth Rate (CAGR) of xx%. This growth is fueled by increasing demand for satellite-based services, driven by factors such as the expanding global telecommunications infrastructure, growing adoption of Earth observation technologies, and the rise of the space-based internet. Market penetration for advanced satellite technologies is growing steadily, with xx% of new satellite launches utilizing cutting-edge components in 2024. Technological disruptions, such as the rise of smaller, more affordable satellites, further fuel market expansion. Consumer behavior shifts toward increased reliance on satellite-based navigation, communication, and data services contribute to the growing demand. The market size is projected to reach xx million units by 2033.
Dominant Regions, Countries, or Segments in Satellite Parts and Components Market
North America currently holds the dominant position in the Satellite Parts and Components market, representing xx% of the global market share in 2024. This dominance stems from a robust space industry infrastructure, significant government investments in space exploration, and the presence of major aerospace and defense companies. Europe follows closely, holding xx% market share. Within the segment breakdown, the payload segment, specifically cameras and sensors, displays the strongest growth, driven by the increasing demand for high-resolution Earth observation data and advancements in imaging technology. The antenna segment, particularly phased array antennas, is showing significant growth due to improved performance and adaptability.
- Key Drivers for North America: Strong government spending on space programs, a well-established aerospace industry, and technological advancements.
- Key Drivers for Europe: Significant investments in space research and development, a growing commercial satellite sector, and supportive government policies.
- Payload Segment Drivers: Demand for advanced sensors and high-resolution cameras for Earth observation and other applications.
- Antenna Segment Drivers: Adoption of phased array antennas for improved performance and flexibility in satellite communications.
- Structure Segment Drivers: Demand for lightweight, high-performance materials for satellite structures and propulsion systems.
Satellite Parts and Components Market Product Landscape
The Satellite Parts and Components market showcases continuous product innovation, featuring advancements in miniaturization, improved performance, and enhanced reliability. New-generation sensors provide higher resolution and accuracy, while advancements in antenna technology have led to more efficient communication systems. These advancements are reflected in enhanced performance metrics, including increased data throughput, improved signal reception, and extended lifespan for satellite components. Key selling propositions include reduced size and weight, increased power efficiency, and improved operational reliability.
Key Drivers, Barriers & Challenges in Satellite Parts and Components Market
Key Drivers: The increasing demand for satellite-based communication, navigation, and Earth observation services, alongside government investments in space exploration, are driving market growth. Technological advancements such as miniaturization, AI integration, and improved power efficiency further contribute to this expansion.
Challenges and Restraints: High manufacturing costs, complex supply chains, and stringent regulatory hurdles present challenges. Competition from new entrants and the emergence of disruptive technologies can impact market dynamics. Supply chain disruptions, as witnessed during the recent global chip shortage, can lead to production delays and increased costs. These factors collectively contribute to the complexities faced by market participants.
Emerging Opportunities in Satellite Parts and Components Market
The growing adoption of small satellites (CubeSats and nanosatellites) presents significant growth opportunities, along with the rising demand for satellite internet services and increased investment in space-based data analytics. The development of advanced materials and sustainable propulsion technologies offers avenues for innovation and competitive differentiation. Untapped markets in emerging economies also present significant potential for expansion.
Growth Accelerators in the Satellite Parts and Components Market Industry
Technological breakthroughs in areas like AI-powered satellite imagery analysis, advanced materials for spacecraft construction, and miniaturized satellite components are key growth catalysts. Strategic partnerships between established aerospace companies and emerging technology firms foster innovation and market expansion. Government initiatives promoting space exploration and commercial space activities provide additional impetus for growth.
Key Players Shaping the Satellite Parts and Components Market Market
- BAE Systems
- SENER Group
- Lockheed Martin Corporation
- The Boeing Company
- General Dynamics
- Thales
- OHB SE
- Innovative Solutions in Space BV
- Sitael S p A
- Northrop Grumman Corporation
- Jena-Optronik
- AAC Clyde Space
Notable Milestones in Satellite Parts and Components Market Sector
- November 2022: Two star trackers from Jena-Optronik GmbH guided NASA's Orion spacecraft during the Artemis I mission.
- December 2022: Jena-Optronik's ASTRO CL star sensor was integrated into Maxar's new LEO platform.
- January 2023: ISISPACE launched 47 payloads from 8 countries via its ISILAUNCH38 mission on a Falcon 9 rocket, in partnership with SpaceBD.
In-Depth Satellite Parts and Components Market Market Outlook
The Satellite Parts and Components market is poised for sustained growth, driven by ongoing technological advancements, increased demand for satellite-based services, and expanding government and commercial investments in space exploration. Strategic partnerships, focus on miniaturization, and the emergence of new applications will shape future market dynamics. The market presents significant opportunities for companies focused on innovation, technological advancements, and strategic expansion into emerging markets. The forecast for 2025-2033 indicates a promising future with continued expansion and diversification across various segments.
Satellite Parts and Components Market Segmentation
- 1. Production Analysis
- 2. Consumption Analysis
- 3. Import Market Analysis (Value & Volume)
- 4. Export Market Analysis (Value & Volume)
- 5. Price Trend Analysis
Satellite Parts and Components Market Segmentation By Geography
-
1. North America
- 1.1. United States
- 1.2. Canada
- 1.3. Mexico
-
2. South America
- 2.1. Brazil
- 2.2. Argentina
- 2.3. Rest of South America
-
3. Europe
- 3.1. United Kingdom
- 3.2. Germany
- 3.3. France
- 3.4. Italy
- 3.5. Spain
- 3.6. Russia
- 3.7. Benelux
- 3.8. Nordics
- 3.9. Rest of Europe
-
4. Middle East & Africa
- 4.1. Turkey
- 4.2. Israel
- 4.3. GCC
- 4.4. North Africa
- 4.5. South Africa
- 4.6. Rest of Middle East & Africa
-
5. Asia Pacific
- 5.1. China
- 5.2. India
- 5.3. Japan
- 5.4. South Korea
- 5.5. ASEAN
- 5.6. Oceania
- 5.7. Rest of Asia Pacific
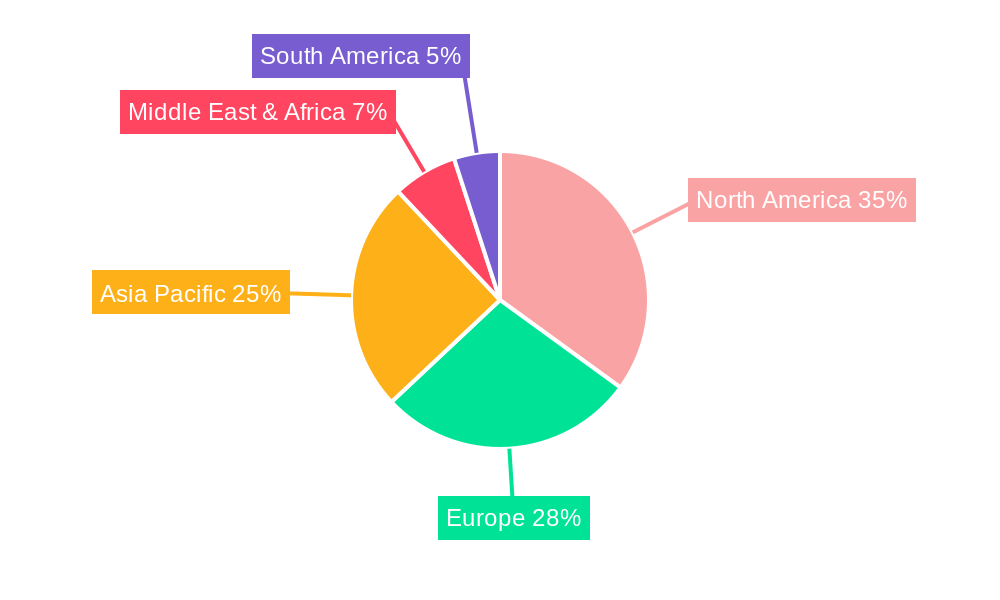
Satellite Parts and Components Market Regional Market Share
Geographic Coverage of Satellite Parts and Components Market
Satellite Parts and Components Market REPORT HIGHLIGHTS
| Aspects | Details |
|---|---|
| Study Period | 2020-2034 |
| Base Year | 2025 |
| Estimated Year | 2026 |
| Forecast Period | 2026-2034 |
| Historical Period | 2020-2025 |
| Growth Rate | CAGR of 7% from 2020-2034 |
| Segmentation |
|
Table of Contents
- 1. Introduction
- 1.1. Research Scope
- 1.2. Market Segmentation
- 1.3. Research Objective
- 1.4. Definitions and Assumptions
- 2. Executive Summary
- 2.1. Market Snapshot
- 3. Market Dynamics
- 3.1. Market Drivers
- 3.2. Market Restrains
- 3.3. Market Trends
- 3.4. Market Opportunities
- 4. Market Factor Analysis
- 4.1. Porters Five Forces
- 4.1.1. Bargaining Power of Suppliers
- 4.1.2. Bargaining Power of Buyers
- 4.1.3. Threat of New Entrants
- 4.1.4. Threat of Substitutes
- 4.1.5. Competitive Rivalry
- 4.2. PESTEL analysis
- 4.3. BCG Analysis
- 4.3.1. Stars (High Growth, High Market Share)
- 4.3.2. Cash Cows (Low Growth, High Market Share)
- 4.3.3. Question Mark (High Growth, Low Market Share)
- 4.3.4. Dogs (Low Growth, Low Market Share)
- 4.4. Ansoff Matrix Analysis
- 4.5. Supply Chain Analysis
- 4.6. Regulatory Landscape
- 4.7. Current Market Potential and Opportunity Assessment (TAM–SAM–SOM Framework)
- 4.8. IMR Analyst Note
- 4.1. Porters Five Forces
- 5. Market Analysis, Insights and Forecast 2021-2033
- 5.1. Market Analysis, Insights and Forecast - by Production Analysis
- 5.2. Market Analysis, Insights and Forecast - by Consumption Analysis
- 5.3. Market Analysis, Insights and Forecast - by Import Market Analysis (Value & Volume)
- 5.4. Market Analysis, Insights and Forecast - by Export Market Analysis (Value & Volume)
- 5.5. Market Analysis, Insights and Forecast - by Price Trend Analysis
- 5.6. Market Analysis, Insights and Forecast - by Region
- 5.6.1. North America
- 5.6.2. South America
- 5.6.3. Europe
- 5.6.4. Middle East & Africa
- 5.6.5. Asia Pacific
- 6. Global Satellite Parts and Components Market Analysis, Insights and Forecast, 2021-2033
- 6.1. Market Analysis, Insights and Forecast - by Production Analysis
- 6.2. Market Analysis, Insights and Forecast - by Consumption Analysis
- 6.3. Market Analysis, Insights and Forecast - by Import Market Analysis (Value & Volume)
- 6.4. Market Analysis, Insights and Forecast - by Export Market Analysis (Value & Volume)
- 6.5. Market Analysis, Insights and Forecast - by Price Trend Analysis
- 7. North America Satellite Parts and Components Market Analysis, Insights and Forecast, 2020-2032
- 7.1. Market Analysis, Insights and Forecast - by Production Analysis
- 7.2. Market Analysis, Insights and Forecast - by Consumption Analysis
- 7.3. Market Analysis, Insights and Forecast - by Import Market Analysis (Value & Volume)
- 7.4. Market Analysis, Insights and Forecast - by Export Market Analysis (Value & Volume)
- 7.5. Market Analysis, Insights and Forecast - by Price Trend Analysis
- 8. South America Satellite Parts and Components Market Analysis, Insights and Forecast, 2020-2032
- 8.1. Market Analysis, Insights and Forecast - by Production Analysis
- 8.2. Market Analysis, Insights and Forecast - by Consumption Analysis
- 8.3. Market Analysis, Insights and Forecast - by Import Market Analysis (Value & Volume)
- 8.4. Market Analysis, Insights and Forecast - by Export Market Analysis (Value & Volume)
- 8.5. Market Analysis, Insights and Forecast - by Price Trend Analysis
- 9. Europe Satellite Parts and Components Market Analysis, Insights and Forecast, 2020-2032
- 9.1. Market Analysis, Insights and Forecast - by Production Analysis
- 9.2. Market Analysis, Insights and Forecast - by Consumption Analysis
- 9.3. Market Analysis, Insights and Forecast - by Import Market Analysis (Value & Volume)
- 9.4. Market Analysis, Insights and Forecast - by Export Market Analysis (Value & Volume)
- 9.5. Market Analysis, Insights and Forecast - by Price Trend Analysis
- 10. Middle East & Africa Satellite Parts and Components Market Analysis, Insights and Forecast, 2020-2032
- 10.1. Market Analysis, Insights and Forecast - by Production Analysis
- 10.2. Market Analysis, Insights and Forecast - by Consumption Analysis
- 10.3. Market Analysis, Insights and Forecast - by Import Market Analysis (Value & Volume)
- 10.4. Market Analysis, Insights and Forecast - by Export Market Analysis (Value & Volume)
- 10.5. Market Analysis, Insights and Forecast - by Price Trend Analysis
- 11. Asia Pacific Satellite Parts and Components Market Analysis, Insights and Forecast, 2020-2032
- 11.1. Market Analysis, Insights and Forecast - by Production Analysis
- 11.2. Market Analysis, Insights and Forecast - by Consumption Analysis
- 11.3. Market Analysis, Insights and Forecast - by Import Market Analysis (Value & Volume)
- 11.4. Market Analysis, Insights and Forecast - by Export Market Analysis (Value & Volume)
- 11.5. Market Analysis, Insights and Forecast - by Price Trend Analysis
- 12. Competitive Analysis
- 12.1. Company Profiles
- 12.1.1 BAE Systems
- 12.1.1.1. Company Overview
- 12.1.1.2. Products
- 12.1.1.3. Company Financials
- 12.1.1.4. SWOT Analysis
- 12.1.2 SENER Group
- 12.1.2.1. Company Overview
- 12.1.2.2. Products
- 12.1.2.3. Company Financials
- 12.1.2.4. SWOT Analysis
- 12.1.3 Lockheed Martin Corporation
- 12.1.3.1. Company Overview
- 12.1.3.2. Products
- 12.1.3.3. Company Financials
- 12.1.3.4. SWOT Analysis
- 12.1.4 The Boeing Compan
- 12.1.4.1. Company Overview
- 12.1.4.2. Products
- 12.1.4.3. Company Financials
- 12.1.4.4. SWOT Analysis
- 12.1.5 General Dynamics
- 12.1.5.1. Company Overview
- 12.1.5.2. Products
- 12.1.5.3. Company Financials
- 12.1.5.4. SWOT Analysis
- 12.1.6 Thales
- 12.1.6.1. Company Overview
- 12.1.6.2. Products
- 12.1.6.3. Company Financials
- 12.1.6.4. SWOT Analysis
- 12.1.7 OHB SE
- 12.1.7.1. Company Overview
- 12.1.7.2. Products
- 12.1.7.3. Company Financials
- 12.1.7.4. SWOT Analysis
- 12.1.8 Innovative Solutions in Space BV
- 12.1.8.1. Company Overview
- 12.1.8.2. Products
- 12.1.8.3. Company Financials
- 12.1.8.4. SWOT Analysis
- 12.1.9 Sitael S p A
- 12.1.9.1. Company Overview
- 12.1.9.2. Products
- 12.1.9.3. Company Financials
- 12.1.9.4. SWOT Analysis
- 12.1.10 Northrop Grumman Corporation
- 12.1.10.1. Company Overview
- 12.1.10.2. Products
- 12.1.10.3. Company Financials
- 12.1.10.4. SWOT Analysis
- 12.1.11 Jena-Optronik
- 12.1.11.1. Company Overview
- 12.1.11.2. Products
- 12.1.11.3. Company Financials
- 12.1.11.4. SWOT Analysis
- 12.1.12 AAC Clyde Space
- 12.1.12.1. Company Overview
- 12.1.12.2. Products
- 12.1.12.3. Company Financials
- 12.1.12.4. SWOT Analysis
- 12.1.1 BAE Systems
- 12.2. Market Entropy
- 12.2.1 Company's Key Areas Served
- 12.2.2 Recent Developments
- 12.3. Company Market Share Analysis 2025
- 12.3.1 Top 5 Companies Market Share Analysis
- 12.3.2 Top 3 Companies Market Share Analysis
- 12.4. List of Potential Customers
- 13. Research Methodology
List of Figures
- Figure 1: Global Satellite Parts and Components Market Revenue Breakdown (billion, %) by Region 2025 & 2033
- Figure 2: North America Satellite Parts and Components Market Revenue (billion), by Production Analysis 2025 & 2033
- Figure 3: North America Satellite Parts and Components Market Revenue Share (%), by Production Analysis 2025 & 2033
- Figure 4: North America Satellite Parts and Components Market Revenue (billion), by Consumption Analysis 2025 & 2033
- Figure 5: North America Satellite Parts and Components Market Revenue Share (%), by Consumption Analysis 2025 & 2033
- Figure 6: North America Satellite Parts and Components Market Revenue (billion), by Import Market Analysis (Value & Volume) 2025 & 2033
- Figure 7: North America Satellite Parts and Components Market Revenue Share (%), by Import Market Analysis (Value & Volume) 2025 & 2033
- Figure 8: North America Satellite Parts and Components Market Revenue (billion), by Export Market Analysis (Value & Volume) 2025 & 2033
- Figure 9: North America Satellite Parts and Components Market Revenue Share (%), by Export Market Analysis (Value & Volume) 2025 & 2033
- Figure 10: North America Satellite Parts and Components Market Revenue (billion), by Price Trend Analysis 2025 & 2033
- Figure 11: North America Satellite Parts and Components Market Revenue Share (%), by Price Trend Analysis 2025 & 2033
- Figure 12: North America Satellite Parts and Components Market Revenue (billion), by Country 2025 & 2033
- Figure 13: North America Satellite Parts and Components Market Revenue Share (%), by Country 2025 & 2033
- Figure 14: South America Satellite Parts and Components Market Revenue (billion), by Production Analysis 2025 & 2033
- Figure 15: South America Satellite Parts and Components Market Revenue Share (%), by Production Analysis 2025 & 2033
- Figure 16: South America Satellite Parts and Components Market Revenue (billion), by Consumption Analysis 2025 & 2033
- Figure 17: South America Satellite Parts and Components Market Revenue Share (%), by Consumption Analysis 2025 & 2033
- Figure 18: South America Satellite Parts and Components Market Revenue (billion), by Import Market Analysis (Value & Volume) 2025 & 2033
- Figure 19: South America Satellite Parts and Components Market Revenue Share (%), by Import Market Analysis (Value & Volume) 2025 & 2033
- Figure 20: South America Satellite Parts and Components Market Revenue (billion), by Export Market Analysis (Value & Volume) 2025 & 2033
- Figure 21: South America Satellite Parts and Components Market Revenue Share (%), by Export Market Analysis (Value & Volume) 2025 & 2033
- Figure 22: South America Satellite Parts and Components Market Revenue (billion), by Price Trend Analysis 2025 & 2033
- Figure 23: South America Satellite Parts and Components Market Revenue Share (%), by Price Trend Analysis 2025 & 2033
- Figure 24: South America Satellite Parts and Components Market Revenue (billion), by Country 2025 & 2033
- Figure 25: South America Satellite Parts and Components Market Revenue Share (%), by Country 2025 & 2033
- Figure 26: Europe Satellite Parts and Components Market Revenue (billion), by Production Analysis 2025 & 2033
- Figure 27: Europe Satellite Parts and Components Market Revenue Share (%), by Production Analysis 2025 & 2033
- Figure 28: Europe Satellite Parts and Components Market Revenue (billion), by Consumption Analysis 2025 & 2033
- Figure 29: Europe Satellite Parts and Components Market Revenue Share (%), by Consumption Analysis 2025 & 2033
- Figure 30: Europe Satellite Parts and Components Market Revenue (billion), by Import Market Analysis (Value & Volume) 2025 & 2033
- Figure 31: Europe Satellite Parts and Components Market Revenue Share (%), by Import Market Analysis (Value & Volume) 2025 & 2033
- Figure 32: Europe Satellite Parts and Components Market Revenue (billion), by Export Market Analysis (Value & Volume) 2025 & 2033
- Figure 33: Europe Satellite Parts and Components Market Revenue Share (%), by Export Market Analysis (Value & Volume) 2025 & 2033
- Figure 34: Europe Satellite Parts and Components Market Revenue (billion), by Price Trend Analysis 2025 & 2033
- Figure 35: Europe Satellite Parts and Components Market Revenue Share (%), by Price Trend Analysis 2025 & 2033
- Figure 36: Europe Satellite Parts and Components Market Revenue (billion), by Country 2025 & 2033
- Figure 37: Europe Satellite Parts and Components Market Revenue Share (%), by Country 2025 & 2033
- Figure 38: Middle East & Africa Satellite Parts and Components Market Revenue (billion), by Production Analysis 2025 & 2033
- Figure 39: Middle East & Africa Satellite Parts and Components Market Revenue Share (%), by Production Analysis 2025 & 2033
- Figure 40: Middle East & Africa Satellite Parts and Components Market Revenue (billion), by Consumption Analysis 2025 & 2033
- Figure 41: Middle East & Africa Satellite Parts and Components Market Revenue Share (%), by Consumption Analysis 2025 & 2033
- Figure 42: Middle East & Africa Satellite Parts and Components Market Revenue (billion), by Import Market Analysis (Value & Volume) 2025 & 2033
- Figure 43: Middle East & Africa Satellite Parts and Components Market Revenue Share (%), by Import Market Analysis (Value & Volume) 2025 & 2033
- Figure 44: Middle East & Africa Satellite Parts and Components Market Revenue (billion), by Export Market Analysis (Value & Volume) 2025 & 2033
- Figure 45: Middle East & Africa Satellite Parts and Components Market Revenue Share (%), by Export Market Analysis (Value & Volume) 2025 & 2033
- Figure 46: Middle East & Africa Satellite Parts and Components Market Revenue (billion), by Price Trend Analysis 2025 & 2033
- Figure 47: Middle East & Africa Satellite Parts and Components Market Revenue Share (%), by Price Trend Analysis 2025 & 2033
- Figure 48: Middle East & Africa Satellite Parts and Components Market Revenue (billion), by Country 2025 & 2033
- Figure 49: Middle East & Africa Satellite Parts and Components Market Revenue Share (%), by Country 2025 & 2033
- Figure 50: Asia Pacific Satellite Parts and Components Market Revenue (billion), by Production Analysis 2025 & 2033
- Figure 51: Asia Pacific Satellite Parts and Components Market Revenue Share (%), by Production Analysis 2025 & 2033
- Figure 52: Asia Pacific Satellite Parts and Components Market Revenue (billion), by Consumption Analysis 2025 & 2033
- Figure 53: Asia Pacific Satellite Parts and Components Market Revenue Share (%), by Consumption Analysis 2025 & 2033
- Figure 54: Asia Pacific Satellite Parts and Components Market Revenue (billion), by Import Market Analysis (Value & Volume) 2025 & 2033
- Figure 55: Asia Pacific Satellite Parts and Components Market Revenue Share (%), by Import Market Analysis (Value & Volume) 2025 & 2033
- Figure 56: Asia Pacific Satellite Parts and Components Market Revenue (billion), by Export Market Analysis (Value & Volume) 2025 & 2033
- Figure 57: Asia Pacific Satellite Parts and Components Market Revenue Share (%), by Export Market Analysis (Value & Volume) 2025 & 2033
- Figure 58: Asia Pacific Satellite Parts and Components Market Revenue (billion), by Price Trend Analysis 2025 & 2033
- Figure 59: Asia Pacific Satellite Parts and Components Market Revenue Share (%), by Price Trend Analysis 2025 & 2033
- Figure 60: Asia Pacific Satellite Parts and Components Market Revenue (billion), by Country 2025 & 2033
- Figure 61: Asia Pacific Satellite Parts and Components Market Revenue Share (%), by Country 2025 & 2033
List of Tables
- Table 1: Global Satellite Parts and Components Market Revenue billion Forecast, by Production Analysis 2020 & 2033
- Table 2: Global Satellite Parts and Components Market Revenue billion Forecast, by Consumption Analysis 2020 & 2033
- Table 3: Global Satellite Parts and Components Market Revenue billion Forecast, by Import Market Analysis (Value & Volume) 2020 & 2033
- Table 4: Global Satellite Parts and Components Market Revenue billion Forecast, by Export Market Analysis (Value & Volume) 2020 & 2033
- Table 5: Global Satellite Parts and Components Market Revenue billion Forecast, by Price Trend Analysis 2020 & 2033
- Table 6: Global Satellite Parts and Components Market Revenue billion Forecast, by Region 2020 & 2033
- Table 7: Global Satellite Parts and Components Market Revenue billion Forecast, by Production Analysis 2020 & 2033
- Table 8: Global Satellite Parts and Components Market Revenue billion Forecast, by Consumption Analysis 2020 & 2033
- Table 9: Global Satellite Parts and Components Market Revenue billion Forecast, by Import Market Analysis (Value & Volume) 2020 & 2033
- Table 10: Global Satellite Parts and Components Market Revenue billion Forecast, by Export Market Analysis (Value & Volume) 2020 & 2033
- Table 11: Global Satellite Parts and Components Market Revenue billion Forecast, by Price Trend Analysis 2020 & 2033
- Table 12: Global Satellite Parts and Components Market Revenue billion Forecast, by Country 2020 & 2033
- Table 13: United States Satellite Parts and Components Market Revenue (billion) Forecast, by Application 2020 & 2033
- Table 14: Canada Satellite Parts and Components Market Revenue (billion) Forecast, by Application 2020 & 2033
- Table 15: Mexico Satellite Parts and Components Market Revenue (billion) Forecast, by Application 2020 & 2033
- Table 16: Global Satellite Parts and Components Market Revenue billion Forecast, by Production Analysis 2020 & 2033
- Table 17: Global Satellite Parts and Components Market Revenue billion Forecast, by Consumption Analysis 2020 & 2033
- Table 18: Global Satellite Parts and Components Market Revenue billion Forecast, by Import Market Analysis (Value & Volume) 2020 & 2033
- Table 19: Global Satellite Parts and Components Market Revenue billion Forecast, by Export Market Analysis (Value & Volume) 2020 & 2033
- Table 20: Global Satellite Parts and Components Market Revenue billion Forecast, by Price Trend Analysis 2020 & 2033
- Table 21: Global Satellite Parts and Components Market Revenue billion Forecast, by Country 2020 & 2033
- Table 22: Brazil Satellite Parts and Components Market Revenue (billion) Forecast, by Application 2020 & 2033
- Table 23: Argentina Satellite Parts and Components Market Revenue (billion) Forecast, by Application 2020 & 2033
- Table 24: Rest of South America Satellite Parts and Components Market Revenue (billion) Forecast, by Application 2020 & 2033
- Table 25: Global Satellite Parts and Components Market Revenue billion Forecast, by Production Analysis 2020 & 2033
- Table 26: Global Satellite Parts and Components Market Revenue billion Forecast, by Consumption Analysis 2020 & 2033
- Table 27: Global Satellite Parts and Components Market Revenue billion Forecast, by Import Market Analysis (Value & Volume) 2020 & 2033
- Table 28: Global Satellite Parts and Components Market Revenue billion Forecast, by Export Market Analysis (Value & Volume) 2020 & 2033
- Table 29: Global Satellite Parts and Components Market Revenue billion Forecast, by Price Trend Analysis 2020 & 2033
- Table 30: Global Satellite Parts and Components Market Revenue billion Forecast, by Country 2020 & 2033
- Table 31: United Kingdom Satellite Parts and Components Market Revenue (billion) Forecast, by Application 2020 & 2033
- Table 32: Germany Satellite Parts and Components Market Revenue (billion) Forecast, by Application 2020 & 2033
- Table 33: France Satellite Parts and Components Market Revenue (billion) Forecast, by Application 2020 & 2033
- Table 34: Italy Satellite Parts and Components Market Revenue (billion) Forecast, by Application 2020 & 2033
- Table 35: Spain Satellite Parts and Components Market Revenue (billion) Forecast, by Application 2020 & 2033
- Table 36: Russia Satellite Parts and Components Market Revenue (billion) Forecast, by Application 2020 & 2033
- Table 37: Benelux Satellite Parts and Components Market Revenue (billion) Forecast, by Application 2020 & 2033
- Table 38: Nordics Satellite Parts and Components Market Revenue (billion) Forecast, by Application 2020 & 2033
- Table 39: Rest of Europe Satellite Parts and Components Market Revenue (billion) Forecast, by Application 2020 & 2033
- Table 40: Global Satellite Parts and Components Market Revenue billion Forecast, by Production Analysis 2020 & 2033
- Table 41: Global Satellite Parts and Components Market Revenue billion Forecast, by Consumption Analysis 2020 & 2033
- Table 42: Global Satellite Parts and Components Market Revenue billion Forecast, by Import Market Analysis (Value & Volume) 2020 & 2033
- Table 43: Global Satellite Parts and Components Market Revenue billion Forecast, by Export Market Analysis (Value & Volume) 2020 & 2033
- Table 44: Global Satellite Parts and Components Market Revenue billion Forecast, by Price Trend Analysis 2020 & 2033
- Table 45: Global Satellite Parts and Components Market Revenue billion Forecast, by Country 2020 & 2033
- Table 46: Turkey Satellite Parts and Components Market Revenue (billion) Forecast, by Application 2020 & 2033
- Table 47: Israel Satellite Parts and Components Market Revenue (billion) Forecast, by Application 2020 & 2033
- Table 48: GCC Satellite Parts and Components Market Revenue (billion) Forecast, by Application 2020 & 2033
- Table 49: North Africa Satellite Parts and Components Market Revenue (billion) Forecast, by Application 2020 & 2033
- Table 50: South Africa Satellite Parts and Components Market Revenue (billion) Forecast, by Application 2020 & 2033
- Table 51: Rest of Middle East & Africa Satellite Parts and Components Market Revenue (billion) Forecast, by Application 2020 & 2033
- Table 52: Global Satellite Parts and Components Market Revenue billion Forecast, by Production Analysis 2020 & 2033
- Table 53: Global Satellite Parts and Components Market Revenue billion Forecast, by Consumption Analysis 2020 & 2033
- Table 54: Global Satellite Parts and Components Market Revenue billion Forecast, by Import Market Analysis (Value & Volume) 2020 & 2033
- Table 55: Global Satellite Parts and Components Market Revenue billion Forecast, by Export Market Analysis (Value & Volume) 2020 & 2033
- Table 56: Global Satellite Parts and Components Market Revenue billion Forecast, by Price Trend Analysis 2020 & 2033
- Table 57: Global Satellite Parts and Components Market Revenue billion Forecast, by Country 2020 & 2033
- Table 58: China Satellite Parts and Components Market Revenue (billion) Forecast, by Application 2020 & 2033
- Table 59: India Satellite Parts and Components Market Revenue (billion) Forecast, by Application 2020 & 2033
- Table 60: Japan Satellite Parts and Components Market Revenue (billion) Forecast, by Application 2020 & 2033
- Table 61: South Korea Satellite Parts and Components Market Revenue (billion) Forecast, by Application 2020 & 2033
- Table 62: ASEAN Satellite Parts and Components Market Revenue (billion) Forecast, by Application 2020 & 2033
- Table 63: Oceania Satellite Parts and Components Market Revenue (billion) Forecast, by Application 2020 & 2033
- Table 64: Rest of Asia Pacific Satellite Parts and Components Market Revenue (billion) Forecast, by Application 2020 & 2033
Frequently Asked Questions
1. What is the projected Compound Annual Growth Rate (CAGR) of the Satellite Parts and Components Market?
The projected CAGR is approximately 7%.
2. Which companies are prominent players in the Satellite Parts and Components Market?
Key companies in the market include BAE Systems, SENER Group, Lockheed Martin Corporation, The Boeing Compan, General Dynamics, Thales, OHB SE, Innovative Solutions in Space BV, Sitael S p A, Northrop Grumman Corporation, Jena-Optronik, AAC Clyde Space.
3. What are the main segments of the Satellite Parts and Components Market?
The market segments include Production Analysis, Consumption Analysis, Import Market Analysis (Value & Volume), Export Market Analysis (Value & Volume), Price Trend Analysis.
4. Can you provide details about the market size?
The market size is estimated to be USD 25 billion as of 2022.
5. What are some drivers contributing to market growth?
N/A
6. What are the notable trends driving market growth?
OTHER KEY INDUSTRY TRENDS COVERED IN THE REPORT.
7. Are there any restraints impacting market growth?
N/A
8. Can you provide examples of recent developments in the market?
January 2023: ISISPACE has launched 47 payloads from 8 different countries during its ISILAUNCH38 mission on board Falcon 9 Rocket. ISILAUNCH partnered with SpaceBD from Japan, to jointly manifest payloads from Japan, Europe, and other parts of the world on the launch on one of the ports on this launch.December 2022: ASTRO CL, the smallest member of the Jena-Optronik star sensor family was be used on the new LEO platform from Maxar. Each satellite is equipped with two ASTRO CL sensors, which support the attitude control of these satellites.November 2022: As part of NASA's Artemis I mission, the Orion spacecraft successfully launched into space on November 16, 2022. Two star trackers from Jena-Optronik GmbH guided the Orion on its way to lunar orbit.
9. What pricing options are available for accessing the report?
Pricing options include single-user, multi-user, and enterprise licenses priced at USD 3800, USD 4500, and USD 5800 respectively.
10. Is the market size provided in terms of value or volume?
The market size is provided in terms of value, measured in billion.
11. Are there any specific market keywords associated with the report?
Yes, the market keyword associated with the report is "Satellite Parts and Components Market," which aids in identifying and referencing the specific market segment covered.
12. How do I determine which pricing option suits my needs best?
The pricing options vary based on user requirements and access needs. Individual users may opt for single-user licenses, while businesses requiring broader access may choose multi-user or enterprise licenses for cost-effective access to the report.
13. Are there any additional resources or data provided in the Satellite Parts and Components Market report?
While the report offers comprehensive insights, it's advisable to review the specific contents or supplementary materials provided to ascertain if additional resources or data are available.
14. How can I stay updated on further developments or reports in the Satellite Parts and Components Market?
To stay informed about further developments, trends, and reports in the Satellite Parts and Components Market, consider subscribing to industry newsletters, following relevant companies and organizations, or regularly checking reputable industry news sources and publications.
Methodology
Step 1 - Identification of Relevant Samples Size from Population Database


Step 2 - Approaches for Defining Global Market Size (Value, Volume* & Price*)

Note*: In applicable scenarios
Step 3 - Data Sources
Primary Research
- Web Analytics
- Survey Reports
- Research Institute
- Latest Research Reports
- Opinion Leaders
Secondary Research
- Annual Reports
- White Paper
- Latest Press Release
- Industry Association
- Paid Database
- Investor Presentations

Step 4 - Data Triangulation
Involves using different sources of information in order to increase the validity of a study
These sources are likely to be stakeholders in a program - participants, other researchers, program staff, other community members, and so on.
Then we put all data in single framework & apply various statistical tools to find out the dynamic on the market.
During the analysis stage, feedback from the stakeholder groups would be compared to determine areas of agreement as well as areas of divergence