

Key Insights
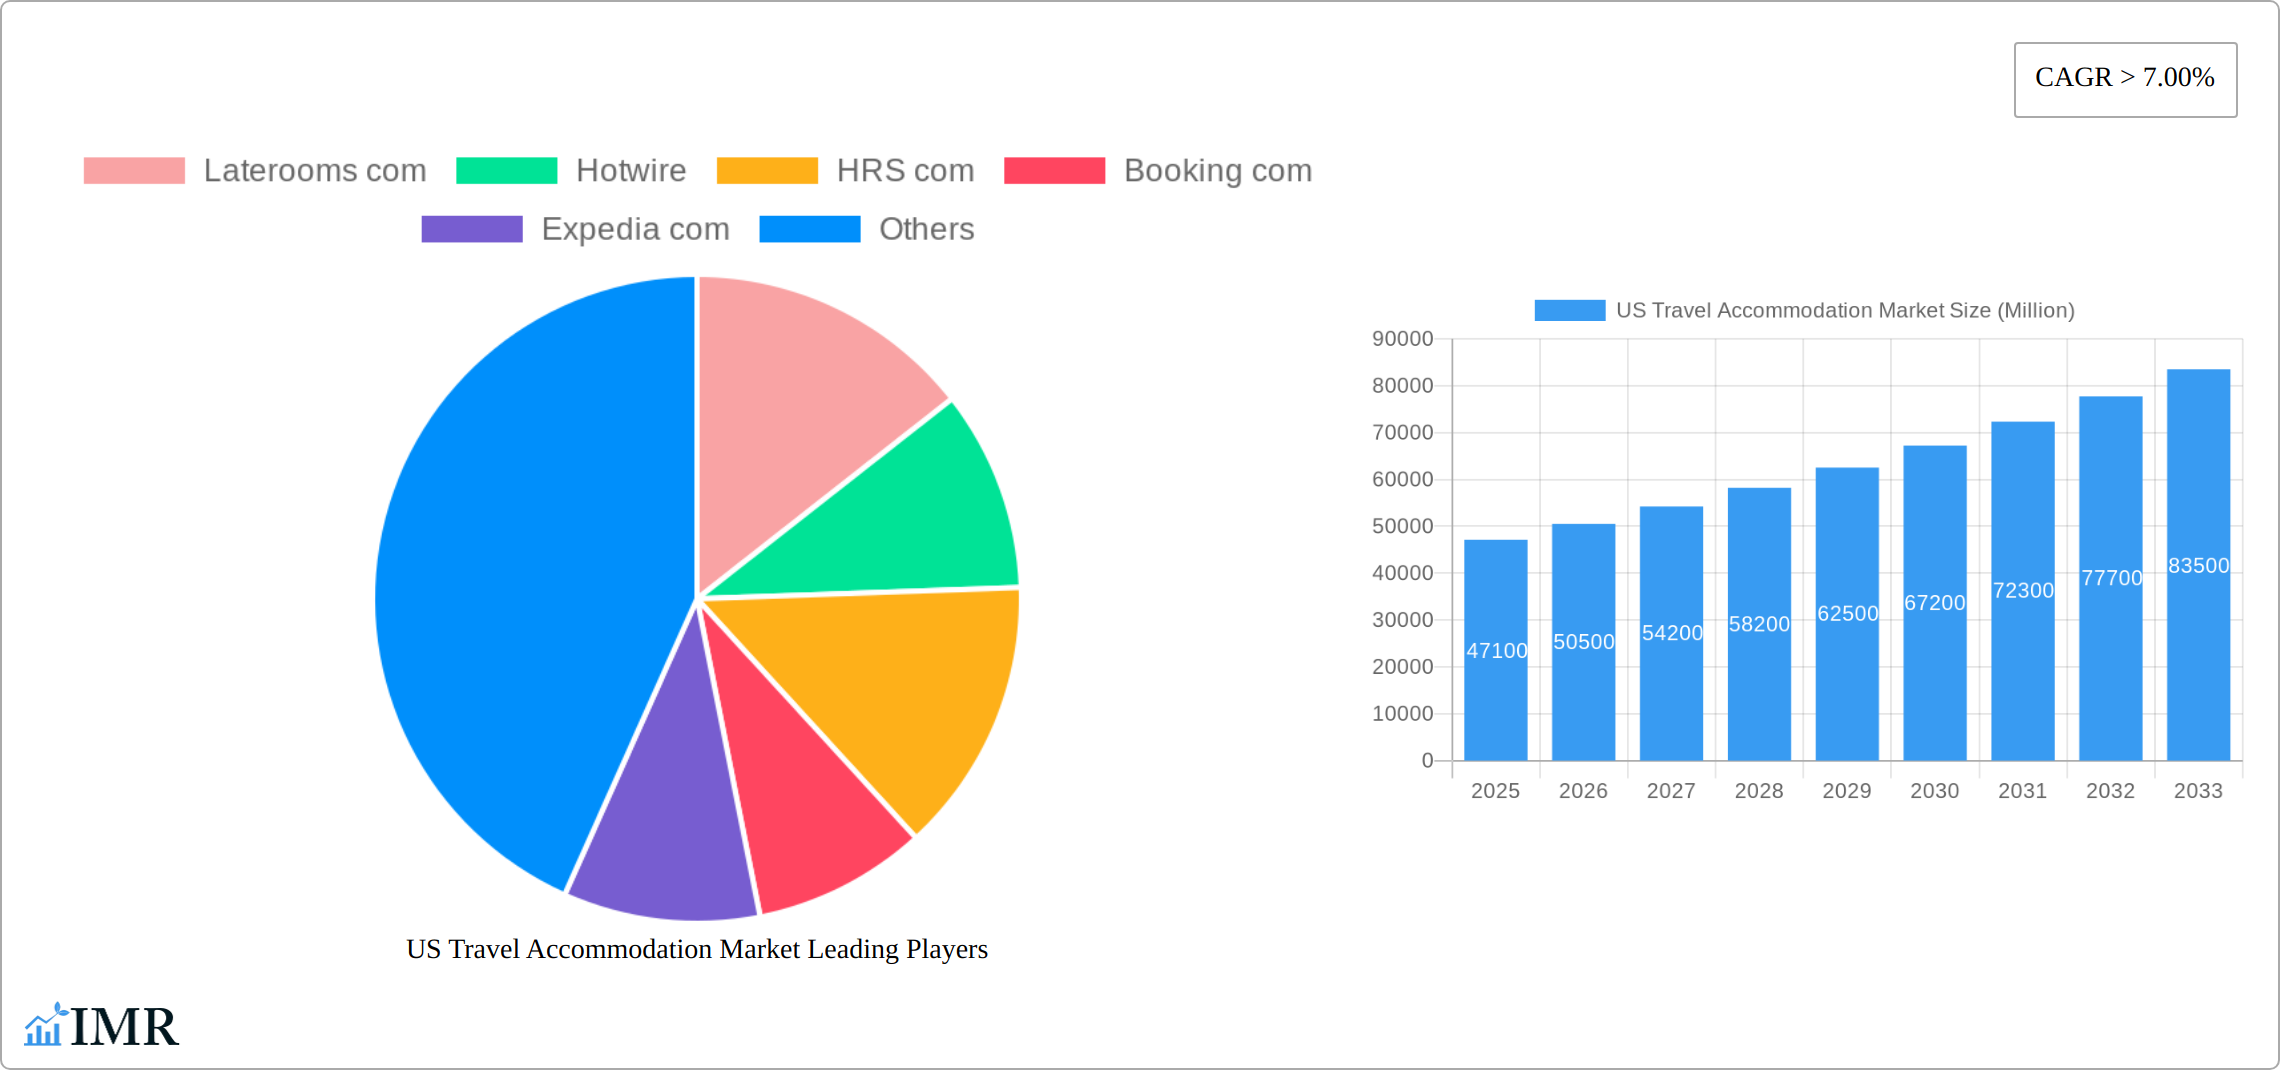
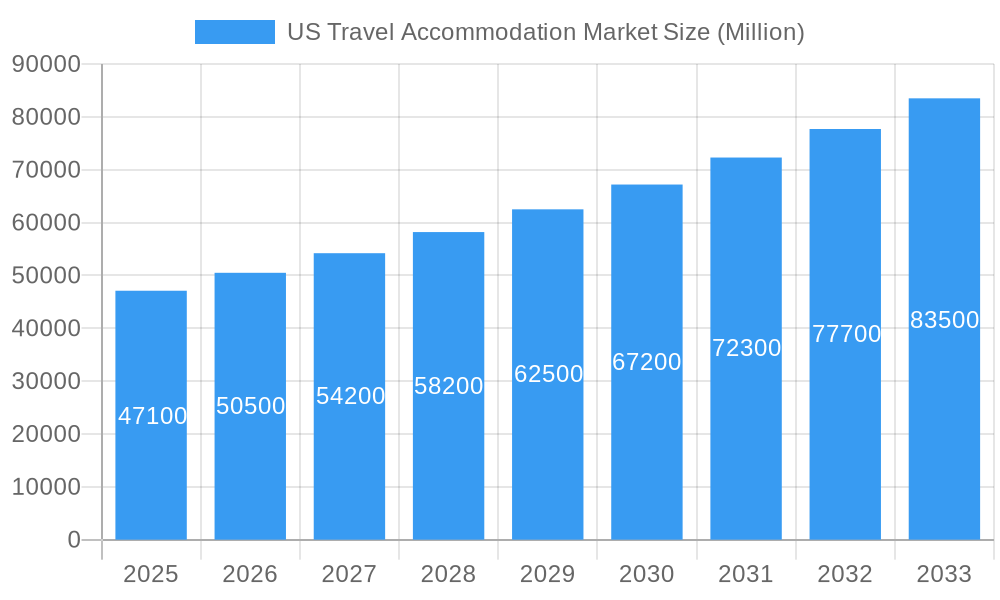
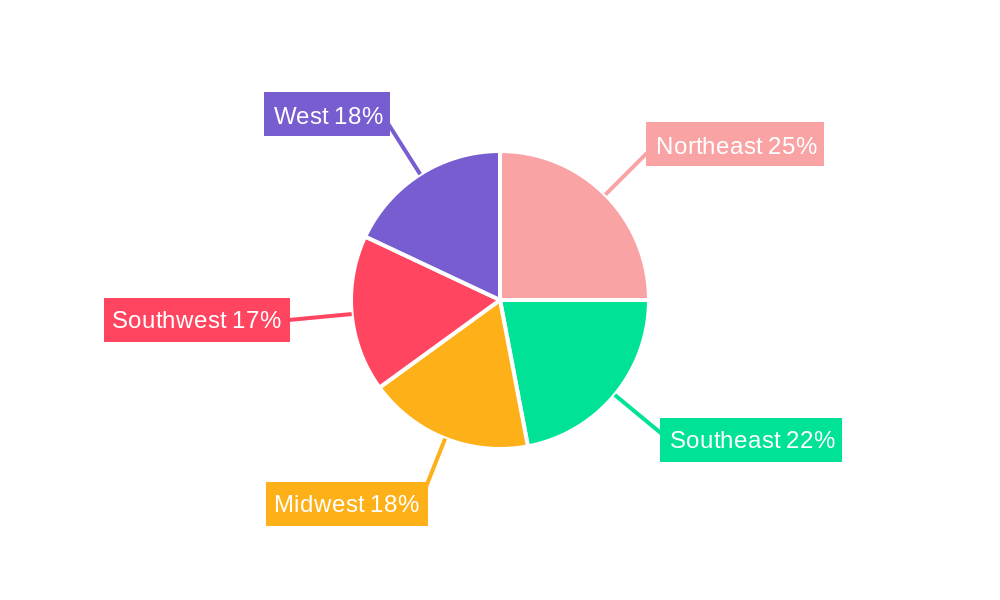
The US travel accommodation market, valued at $47.10 billion in 2025, exhibits robust growth potential, projected to expand at a Compound Annual Growth Rate (CAGR) exceeding 7% from 2025 to 2033. This expansion is fueled by several key factors. Increased disposable incomes and a rising preference for leisure travel among Americans are driving demand. The convenience and competitive pricing offered by online travel agencies (OTAs) like Expedia, Booking.com, and Airbnb are further stimulating market growth. Technological advancements, such as improved mobile booking applications and personalized travel recommendations, enhance user experience and contribute to market expansion. The market is segmented by platform type (mobile applications and websites) and booking mode (third-party and direct/captive portals). While the dominance of online booking platforms is undeniable, the emergence of niche players and the continued popularity of direct bookings through hotel websites suggest a dynamic and evolving landscape. Regional variations exist, with the Northeast, Southeast, Midwest, Southwest, and West exhibiting unique growth trajectories influenced by factors such as tourism hotspots and regional economic conditions. The sustained growth trajectory is expected despite potential restraints such as economic downturns and fluctuating fuel prices. However, the inherent resilience of the travel sector and the evolving consumer preference towards unique and personalized experiences are anticipated to mitigate these challenges.
US Travel Accommodation Market Market Size (In Billion)
The market's segmentation offers diverse investment opportunities. Mobile applications are witnessing explosive growth due to increasing smartphone penetration and user preference for on-the-go booking. The third-party online portals segment remains a significant revenue generator, though direct bookings are gradually increasing as hotels invest in enhancing their online presence and customer loyalty programs. Geographical variations in market growth warrant a focused approach to regional marketing and investment strategies. Understanding the unique needs and preferences of travelers in each region is crucial for optimizing market penetration. Future growth will likely be influenced by innovative technological solutions, including artificial intelligence-driven personalization, augmented reality experiences, and sustainable tourism initiatives. The continued dominance of key players like Booking.com and Expedia.com will likely persist, but the potential for disruptive entrants and niche players presents opportunities for both established and emerging businesses.
US Travel Accommodation Market Company Market Share
US Travel Accommodation Market: 2019-2033 Forecast Report
This comprehensive report provides an in-depth analysis of the US travel accommodation market, encompassing market dynamics, growth trends, key players, and future outlook. Covering the period 2019-2033, with a base year of 2025, this report is an essential resource for industry professionals, investors, and anyone seeking to understand this dynamic sector. The market is segmented by platform type (mobile application, website) and booking mode (third-party online portals, direct/captive portals), offering granular insights into various market segments. The total market size is estimated at xx Million in 2025.
US Travel Accommodation Market Dynamics & Structure
The US travel accommodation market is characterized by high competition, rapid technological advancements, and evolving regulatory landscapes. Market concentration is moderate, with a few major players holding significant market share, but a large number of smaller players contributing significantly to the overall market value. The market is experiencing significant technological innovation, particularly in areas such as mobile booking platforms, personalized recommendations, and AI-driven services. Regulatory frameworks, including those related to data privacy and consumer protection, are increasingly shaping the market landscape. The market is also impacted by substitute products and services, such as vacation rentals (Airbnb) and home-sharing platforms. The end-user demographics encompass a diverse range of travelers, from leisure to business travelers, with varying needs and preferences.
- Market Concentration: Moderate, with top 5 players holding approximately xx% market share in 2025.
- Technological Innovation: Mobile booking apps, AI-powered recommendations, and personalized services are key drivers.
- Regulatory Frameworks: Data privacy regulations (e.g., CCPA) and consumer protection laws are influential.
- Competitive Product Substitutes: Vacation rentals (Airbnb), home-sharing platforms pose a significant challenge.
- End-User Demographics: Diverse, encompassing leisure, business, and budget-conscious travelers.
- M&A Trends: A moderate number of M&A deals, primarily focused on technological integration and expansion into new markets, with xx deals recorded in 2024.
US Travel Accommodation Market Growth Trends & Insights
The US travel accommodation market has witnessed robust growth over the past years. The market size expanded from xx Million in 2019 to xx Million in 2024, demonstrating a CAGR of xx%. This growth is driven by several factors, including rising disposable incomes, increased travel frequency, the adoption of online booking platforms, and technological advancements. The market penetration of online booking platforms is nearing saturation in major urban areas, while there remains potential for growth in rural markets and among less tech-savvy demographics. Technological disruptions, such as the rise of AI-powered chatbots and personalized travel recommendations, are further transforming the market landscape. Changing consumer preferences, including a preference for unique travel experiences and sustainable accommodation options, are shaping industry trends.
Dominant Regions, Countries, or Segments in US Travel Accommodation Market
The Northeast and West Coast regions of the US represent the dominant geographical segments within the market, owing to high population density, robust tourism infrastructure, and favorable economic conditions. Within platform types, mobile applications are the fastest-growing segment, driven by the increasing adoption of smartphones and user-friendly mobile booking interfaces. Similarly, third-party online portals dominate the booking mode, driven by the convenience and competitive pricing they offer.
- Key Drivers (Northeast & West Coast): High population density, strong tourism infrastructure, and high disposable incomes.
- Key Drivers (Mobile Applications): Smartphone penetration, user-friendly interfaces, and personalized offerings.
- Key Drivers (Third-Party Portals): Convenience, competitive pricing, wider selection of accommodation options.
- Market Share: Mobile Apps (xx%), Website (xx%), Third-party Portals (xx%), Direct/Captive Portals (xx%).
- Growth Potential: Rural markets, untapped niche segments (e.g., sustainable tourism).
US Travel Accommodation Market Product Landscape
The US travel accommodation market is a dynamic and diverse landscape offering a wide array of products and services. Innovation is rapidly reshaping the industry, focusing on enhancing the user experience through personalized recommendations, seamless integrations with ancillary services (like transportation and activity booking), and loyalty programs that reward repeat business. Key performance indicators (KPIs) for success include not only booking conversion rates and average revenue per booking (ARPB) but also increasingly emphasize customer satisfaction scores (CSAT) and Net Promoter Score (NPS) as indicators of long-term loyalty and brand health. Competitive differentiation is achieved through unique selling propositions (USPs) such as exclusive discounts, bundled packages offering significant cost savings, and partnerships that deliver unparalleled value. Technological advancements are driving this evolution, including AI-powered chatbots for instant customer service, immersive virtual reality (VR) hotel tours allowing customers to virtually explore properties before booking, and frictionless mobile booking processes optimized for speed and convenience.
Key Drivers, Barriers & Challenges in US Travel Accommodation Market
Key Drivers:
- Increasing disposable incomes and travel frequency.
- Adoption of online booking platforms and mobile technology.
- Rise of budget-friendly travel options.
- Growth of niche tourism segments.
Key Challenges:
- Intense competition among online travel agencies (OTAs).
- Fluctuations in fuel prices and travel costs.
- Regulatory hurdles and data privacy concerns.
- Supply chain disruptions impacting hotel availability. (e.g., xx% decrease in available rooms in 2022 due to staffing shortages)
Emerging Opportunities in US Travel Accommodation Market
- Sustainable and eco-friendly accommodations: Growing demand for eco-conscious travel options.
- Experiential travel packages: Rise in demand for curated travel experiences.
- Hyper-personalized travel recommendations: Leveraging AI and data analytics for customized travel itineraries.
- Expansion into rural and underserved markets: Targeting new demographics and geographic regions.
Growth Accelerators in the US Travel Accommodation Market Industry
Strategic partnerships are a significant catalyst for growth within the US travel accommodation market. Collaborations between Online Travel Agencies (OTAs), airlines, hotels, and activity providers are creating bundled travel packages that streamline the booking process and enhance the overall customer experience, attracting a wider range of travelers. The continuous advancement of technology plays a pivotal role, with AI-powered personalization engines tailoring recommendations to individual preferences and seamless booking platforms minimizing friction points in the customer journey. Expansion into untapped markets, the rise of niche travel offerings catering to specific interests (e.g., adventure tourism, wellness retreats), and a growing emphasis on sustainable tourism practices are further accelerating market growth.
Key Players Shaping the US Travel Accommodation Market Market
- Laterooms com
- Hotwire
- HRS com
- Booking com
- Expedia com
- Tripadvisor com
- Orbitz com
- Hotels com
- Airbnb com
- Priceline com
- Agoda com
Notable Milestones in US Travel Accommodation Market Sector
- September 2023: Philippine Airlines launched PAL Holidays powered by Expedia Group, significantly expanding Expedia's reach into the Asian market and offering a comprehensive travel platform integrating flights and accommodation.
- March 2023: Expedia Group's partnership with Wheel the World marked a significant step towards greater accessibility in travel, improving options for travelers with disabilities and enhancing the company's commitment to inclusive tourism.
- [Add another recent milestone here, e.g., a new technology adoption or a significant merger/acquisition] Example: October 2023: Booking.com launched a new carbon offsetting program, reflecting the growing importance of sustainable travel options.
In-Depth US Travel Accommodation Market Market Outlook
The US travel accommodation market is poised for continued growth driven by technological advancements, strategic partnerships, and the expansion into new market segments. The focus on personalized experiences, sustainable tourism, and seamless booking processes will further shape market dynamics. Opportunities lie in expanding into rural markets, developing niche travel offerings, and leveraging data analytics to enhance customer experience. The continued adoption of mobile booking and the rise of AI-powered travel planning tools will drive significant market expansion in the coming years.
US Travel Accommodation Market Segmentation
-
1. Platform Type
- 1.1. Mobile Application
- 1.2. Website
-
2. Mode of Booking Type
- 2.1. Third Party online portals
- 2.2. Direct/Captive portals
US Travel Accommodation Market Segmentation By Geography
-
1. North America
- 1.1. United States
- 1.2. Canada
- 1.3. Mexico
-
2. South America
- 2.1. Brazil
- 2.2. Argentina
- 2.3. Rest of South America
-
3. Europe
- 3.1. United Kingdom
- 3.2. Germany
- 3.3. France
- 3.4. Italy
- 3.5. Spain
- 3.6. Russia
- 3.7. Benelux
- 3.8. Nordics
- 3.9. Rest of Europe
-
4. Middle East & Africa
- 4.1. Turkey
- 4.2. Israel
- 4.3. GCC
- 4.4. North Africa
- 4.5. South Africa
- 4.6. Rest of Middle East & Africa
-
5. Asia Pacific
- 5.1. China
- 5.2. India
- 5.3. Japan
- 5.4. South Korea
- 5.5. ASEAN
- 5.6. Oceania
- 5.7. Rest of Asia Pacific
US Travel Accommodation Market Regional Market Share
Geographic Coverage of US Travel Accommodation Market
US Travel Accommodation Market REPORT HIGHLIGHTS
| Aspects | Details |
|---|---|
| Study Period | 2020-2034 |
| Base Year | 2025 |
| Estimated Year | 2026 |
| Forecast Period | 2026-2034 |
| Historical Period | 2020-2025 |
| Growth Rate | CAGR of > 7.00% from 2020-2034 |
| Segmentation |
|
Table of Contents
- 1. Introduction
- 1.1. Research Scope
- 1.2. Market Segmentation
- 1.3. Research Objective
- 1.4. Definitions and Assumptions
- 2. Executive Summary
- 2.1. Market Snapshot
- 3. Market Dynamics
- 3.1. Market Drivers
- 3.2. Market Restrains
- 3.3. Market Trends
- 3.4. Market Opportunities
- 4. Market Factor Analysis
- 4.1. Porters Five Forces
- 4.1.1. Bargaining Power of Suppliers
- 4.1.2. Bargaining Power of Buyers
- 4.1.3. Threat of New Entrants
- 4.1.4. Threat of Substitutes
- 4.1.5. Competitive Rivalry
- 4.2. PESTEL analysis
- 4.3. BCG Analysis
- 4.3.1. Stars (High Growth, High Market Share)
- 4.3.2. Cash Cows (Low Growth, High Market Share)
- 4.3.3. Question Mark (High Growth, Low Market Share)
- 4.3.4. Dogs (Low Growth, Low Market Share)
- 4.4. Ansoff Matrix Analysis
- 4.5. Supply Chain Analysis
- 4.6. Regulatory Landscape
- 4.7. Current Market Potential and Opportunity Assessment (TAM–SAM–SOM Framework)
- 4.8. IMR Analyst Note
- 4.1. Porters Five Forces
- 5. Market Analysis, Insights and Forecast 2021-2033
- 5.1. Market Analysis, Insights and Forecast - by Platform Type
- 5.1.1. Mobile Application
- 5.1.2. Website
- 5.2. Market Analysis, Insights and Forecast - by Mode of Booking Type
- 5.2.1. Third Party online portals
- 5.2.2. Direct/Captive portals
- 5.3. Market Analysis, Insights and Forecast - by Region
- 5.3.1. North America
- 5.3.2. South America
- 5.3.3. Europe
- 5.3.4. Middle East & Africa
- 5.3.5. Asia Pacific
- 5.1. Market Analysis, Insights and Forecast - by Platform Type
- 6. Global US Travel Accommodation Market Analysis, Insights and Forecast, 2021-2033
- 6.1. Market Analysis, Insights and Forecast - by Platform Type
- 6.1.1. Mobile Application
- 6.1.2. Website
- 6.2. Market Analysis, Insights and Forecast - by Mode of Booking Type
- 6.2.1. Third Party online portals
- 6.2.2. Direct/Captive portals
- 6.1. Market Analysis, Insights and Forecast - by Platform Type
- 7. North America US Travel Accommodation Market Analysis, Insights and Forecast, 2020-2032
- 7.1. Market Analysis, Insights and Forecast - by Platform Type
- 7.1.1. Mobile Application
- 7.1.2. Website
- 7.2. Market Analysis, Insights and Forecast - by Mode of Booking Type
- 7.2.1. Third Party online portals
- 7.2.2. Direct/Captive portals
- 7.1. Market Analysis, Insights and Forecast - by Platform Type
- 8. South America US Travel Accommodation Market Analysis, Insights and Forecast, 2020-2032
- 8.1. Market Analysis, Insights and Forecast - by Platform Type
- 8.1.1. Mobile Application
- 8.1.2. Website
- 8.2. Market Analysis, Insights and Forecast - by Mode of Booking Type
- 8.2.1. Third Party online portals
- 8.2.2. Direct/Captive portals
- 8.1. Market Analysis, Insights and Forecast - by Platform Type
- 9. Europe US Travel Accommodation Market Analysis, Insights and Forecast, 2020-2032
- 9.1. Market Analysis, Insights and Forecast - by Platform Type
- 9.1.1. Mobile Application
- 9.1.2. Website
- 9.2. Market Analysis, Insights and Forecast - by Mode of Booking Type
- 9.2.1. Third Party online portals
- 9.2.2. Direct/Captive portals
- 9.1. Market Analysis, Insights and Forecast - by Platform Type
- 10. Middle East & Africa US Travel Accommodation Market Analysis, Insights and Forecast, 2020-2032
- 10.1. Market Analysis, Insights and Forecast - by Platform Type
- 10.1.1. Mobile Application
- 10.1.2. Website
- 10.2. Market Analysis, Insights and Forecast - by Mode of Booking Type
- 10.2.1. Third Party online portals
- 10.2.2. Direct/Captive portals
- 10.1. Market Analysis, Insights and Forecast - by Platform Type
- 11. Asia Pacific US Travel Accommodation Market Analysis, Insights and Forecast, 2020-2032
- 11.1. Market Analysis, Insights and Forecast - by Platform Type
- 11.1.1. Mobile Application
- 11.1.2. Website
- 11.2. Market Analysis, Insights and Forecast - by Mode of Booking Type
- 11.2.1. Third Party online portals
- 11.2.2. Direct/Captive portals
- 11.1. Market Analysis, Insights and Forecast - by Platform Type
- 12. Competitive Analysis
- 12.1. Company Profiles
- 12.1.1 Laterooms com
- 12.1.1.1. Company Overview
- 12.1.1.2. Products
- 12.1.1.3. Company Financials
- 12.1.1.4. SWOT Analysis
- 12.1.2 Hotwire
- 12.1.2.1. Company Overview
- 12.1.2.2. Products
- 12.1.2.3. Company Financials
- 12.1.2.4. SWOT Analysis
- 12.1.3 HRS com
- 12.1.3.1. Company Overview
- 12.1.3.2. Products
- 12.1.3.3. Company Financials
- 12.1.3.4. SWOT Analysis
- 12.1.4 Booking com
- 12.1.4.1. Company Overview
- 12.1.4.2. Products
- 12.1.4.3. Company Financials
- 12.1.4.4. SWOT Analysis
- 12.1.5 Expedia com
- 12.1.5.1. Company Overview
- 12.1.5.2. Products
- 12.1.5.3. Company Financials
- 12.1.5.4. SWOT Analysis
- 12.1.6 Tripadvisor com**List Not Exhaustive
- 12.1.6.1. Company Overview
- 12.1.6.2. Products
- 12.1.6.3. Company Financials
- 12.1.6.4. SWOT Analysis
- 12.1.7 Orbitz com
- 12.1.7.1. Company Overview
- 12.1.7.2. Products
- 12.1.7.3. Company Financials
- 12.1.7.4. SWOT Analysis
- 12.1.8 Hotels com
- 12.1.8.1. Company Overview
- 12.1.8.2. Products
- 12.1.8.3. Company Financials
- 12.1.8.4. SWOT Analysis
- 12.1.9 Airbnb com
- 12.1.9.1. Company Overview
- 12.1.9.2. Products
- 12.1.9.3. Company Financials
- 12.1.9.4. SWOT Analysis
- 12.1.10 Priceline com
- 12.1.10.1. Company Overview
- 12.1.10.2. Products
- 12.1.10.3. Company Financials
- 12.1.10.4. SWOT Analysis
- 12.1.11 Agoda com
- 12.1.11.1. Company Overview
- 12.1.11.2. Products
- 12.1.11.3. Company Financials
- 12.1.11.4. SWOT Analysis
- 12.1.1 Laterooms com
- 12.2. Market Entropy
- 12.2.1 Company's Key Areas Served
- 12.2.2 Recent Developments
- 12.3. Company Market Share Analysis 2025
- 12.3.1 Top 5 Companies Market Share Analysis
- 12.3.2 Top 3 Companies Market Share Analysis
- 12.4. List of Potential Customers
- 13. Research Methodology
List of Figures
- Figure 1: Global US Travel Accommodation Market Revenue Breakdown (Million, %) by Region 2025 & 2033
- Figure 2: North America US Travel Accommodation Market Revenue (Million), by Platform Type 2025 & 2033
- Figure 3: North America US Travel Accommodation Market Revenue Share (%), by Platform Type 2025 & 2033
- Figure 4: North America US Travel Accommodation Market Revenue (Million), by Mode of Booking Type 2025 & 2033
- Figure 5: North America US Travel Accommodation Market Revenue Share (%), by Mode of Booking Type 2025 & 2033
- Figure 6: North America US Travel Accommodation Market Revenue (Million), by Country 2025 & 2033
- Figure 7: North America US Travel Accommodation Market Revenue Share (%), by Country 2025 & 2033
- Figure 8: South America US Travel Accommodation Market Revenue (Million), by Platform Type 2025 & 2033
- Figure 9: South America US Travel Accommodation Market Revenue Share (%), by Platform Type 2025 & 2033
- Figure 10: South America US Travel Accommodation Market Revenue (Million), by Mode of Booking Type 2025 & 2033
- Figure 11: South America US Travel Accommodation Market Revenue Share (%), by Mode of Booking Type 2025 & 2033
- Figure 12: South America US Travel Accommodation Market Revenue (Million), by Country 2025 & 2033
- Figure 13: South America US Travel Accommodation Market Revenue Share (%), by Country 2025 & 2033
- Figure 14: Europe US Travel Accommodation Market Revenue (Million), by Platform Type 2025 & 2033
- Figure 15: Europe US Travel Accommodation Market Revenue Share (%), by Platform Type 2025 & 2033
- Figure 16: Europe US Travel Accommodation Market Revenue (Million), by Mode of Booking Type 2025 & 2033
- Figure 17: Europe US Travel Accommodation Market Revenue Share (%), by Mode of Booking Type 2025 & 2033
- Figure 18: Europe US Travel Accommodation Market Revenue (Million), by Country 2025 & 2033
- Figure 19: Europe US Travel Accommodation Market Revenue Share (%), by Country 2025 & 2033
- Figure 20: Middle East & Africa US Travel Accommodation Market Revenue (Million), by Platform Type 2025 & 2033
- Figure 21: Middle East & Africa US Travel Accommodation Market Revenue Share (%), by Platform Type 2025 & 2033
- Figure 22: Middle East & Africa US Travel Accommodation Market Revenue (Million), by Mode of Booking Type 2025 & 2033
- Figure 23: Middle East & Africa US Travel Accommodation Market Revenue Share (%), by Mode of Booking Type 2025 & 2033
- Figure 24: Middle East & Africa US Travel Accommodation Market Revenue (Million), by Country 2025 & 2033
- Figure 25: Middle East & Africa US Travel Accommodation Market Revenue Share (%), by Country 2025 & 2033
- Figure 26: Asia Pacific US Travel Accommodation Market Revenue (Million), by Platform Type 2025 & 2033
- Figure 27: Asia Pacific US Travel Accommodation Market Revenue Share (%), by Platform Type 2025 & 2033
- Figure 28: Asia Pacific US Travel Accommodation Market Revenue (Million), by Mode of Booking Type 2025 & 2033
- Figure 29: Asia Pacific US Travel Accommodation Market Revenue Share (%), by Mode of Booking Type 2025 & 2033
- Figure 30: Asia Pacific US Travel Accommodation Market Revenue (Million), by Country 2025 & 2033
- Figure 31: Asia Pacific US Travel Accommodation Market Revenue Share (%), by Country 2025 & 2033
List of Tables
- Table 1: Global US Travel Accommodation Market Revenue Million Forecast, by Platform Type 2020 & 2033
- Table 2: Global US Travel Accommodation Market Revenue Million Forecast, by Mode of Booking Type 2020 & 2033
- Table 3: Global US Travel Accommodation Market Revenue Million Forecast, by Region 2020 & 2033
- Table 4: Global US Travel Accommodation Market Revenue Million Forecast, by Platform Type 2020 & 2033
- Table 5: Global US Travel Accommodation Market Revenue Million Forecast, by Mode of Booking Type 2020 & 2033
- Table 6: Global US Travel Accommodation Market Revenue Million Forecast, by Country 2020 & 2033
- Table 7: United States US Travel Accommodation Market Revenue (Million) Forecast, by Application 2020 & 2033
- Table 8: Canada US Travel Accommodation Market Revenue (Million) Forecast, by Application 2020 & 2033
- Table 9: Mexico US Travel Accommodation Market Revenue (Million) Forecast, by Application 2020 & 2033
- Table 10: Global US Travel Accommodation Market Revenue Million Forecast, by Platform Type 2020 & 2033
- Table 11: Global US Travel Accommodation Market Revenue Million Forecast, by Mode of Booking Type 2020 & 2033
- Table 12: Global US Travel Accommodation Market Revenue Million Forecast, by Country 2020 & 2033
- Table 13: Brazil US Travel Accommodation Market Revenue (Million) Forecast, by Application 2020 & 2033
- Table 14: Argentina US Travel Accommodation Market Revenue (Million) Forecast, by Application 2020 & 2033
- Table 15: Rest of South America US Travel Accommodation Market Revenue (Million) Forecast, by Application 2020 & 2033
- Table 16: Global US Travel Accommodation Market Revenue Million Forecast, by Platform Type 2020 & 2033
- Table 17: Global US Travel Accommodation Market Revenue Million Forecast, by Mode of Booking Type 2020 & 2033
- Table 18: Global US Travel Accommodation Market Revenue Million Forecast, by Country 2020 & 2033
- Table 19: United Kingdom US Travel Accommodation Market Revenue (Million) Forecast, by Application 2020 & 2033
- Table 20: Germany US Travel Accommodation Market Revenue (Million) Forecast, by Application 2020 & 2033
- Table 21: France US Travel Accommodation Market Revenue (Million) Forecast, by Application 2020 & 2033
- Table 22: Italy US Travel Accommodation Market Revenue (Million) Forecast, by Application 2020 & 2033
- Table 23: Spain US Travel Accommodation Market Revenue (Million) Forecast, by Application 2020 & 2033
- Table 24: Russia US Travel Accommodation Market Revenue (Million) Forecast, by Application 2020 & 2033
- Table 25: Benelux US Travel Accommodation Market Revenue (Million) Forecast, by Application 2020 & 2033
- Table 26: Nordics US Travel Accommodation Market Revenue (Million) Forecast, by Application 2020 & 2033
- Table 27: Rest of Europe US Travel Accommodation Market Revenue (Million) Forecast, by Application 2020 & 2033
- Table 28: Global US Travel Accommodation Market Revenue Million Forecast, by Platform Type 2020 & 2033
- Table 29: Global US Travel Accommodation Market Revenue Million Forecast, by Mode of Booking Type 2020 & 2033
- Table 30: Global US Travel Accommodation Market Revenue Million Forecast, by Country 2020 & 2033
- Table 31: Turkey US Travel Accommodation Market Revenue (Million) Forecast, by Application 2020 & 2033
- Table 32: Israel US Travel Accommodation Market Revenue (Million) Forecast, by Application 2020 & 2033
- Table 33: GCC US Travel Accommodation Market Revenue (Million) Forecast, by Application 2020 & 2033
- Table 34: North Africa US Travel Accommodation Market Revenue (Million) Forecast, by Application 2020 & 2033
- Table 35: South Africa US Travel Accommodation Market Revenue (Million) Forecast, by Application 2020 & 2033
- Table 36: Rest of Middle East & Africa US Travel Accommodation Market Revenue (Million) Forecast, by Application 2020 & 2033
- Table 37: Global US Travel Accommodation Market Revenue Million Forecast, by Platform Type 2020 & 2033
- Table 38: Global US Travel Accommodation Market Revenue Million Forecast, by Mode of Booking Type 2020 & 2033
- Table 39: Global US Travel Accommodation Market Revenue Million Forecast, by Country 2020 & 2033
- Table 40: China US Travel Accommodation Market Revenue (Million) Forecast, by Application 2020 & 2033
- Table 41: India US Travel Accommodation Market Revenue (Million) Forecast, by Application 2020 & 2033
- Table 42: Japan US Travel Accommodation Market Revenue (Million) Forecast, by Application 2020 & 2033
- Table 43: South Korea US Travel Accommodation Market Revenue (Million) Forecast, by Application 2020 & 2033
- Table 44: ASEAN US Travel Accommodation Market Revenue (Million) Forecast, by Application 2020 & 2033
- Table 45: Oceania US Travel Accommodation Market Revenue (Million) Forecast, by Application 2020 & 2033
- Table 46: Rest of Asia Pacific US Travel Accommodation Market Revenue (Million) Forecast, by Application 2020 & 2033
Frequently Asked Questions
1. What is the projected Compound Annual Growth Rate (CAGR) of the US Travel Accommodation Market?
The projected CAGR is approximately > 7.00%.
2. Which companies are prominent players in the US Travel Accommodation Market?
Key companies in the market include Laterooms com, Hotwire, HRS com, Booking com, Expedia com, Tripadvisor com**List Not Exhaustive, Orbitz com, Hotels com, Airbnb com, Priceline com, Agoda com.
3. What are the main segments of the US Travel Accommodation Market?
The market segments include Platform Type, Mode of Booking Type.
4. Can you provide details about the market size?
The market size is estimated to be USD 47.10 Million as of 2022.
5. What are some drivers contributing to market growth?
Airbnb in United States is Dominating the Market; The US Online Accommodation Market is Booming due to an Increase in Domestic Trips.
6. What are the notable trends driving market growth?
Rise in the Number of Visitors in California.
7. Are there any restraints impacting market growth?
Booking Cancellation.
8. Can you provide examples of recent developments in the market?
September 2023: Philippine Airlines launched PAL Holidays powered by Expedia Group, a one-stop travel website that offers travelers a seamless and comprehensive platform for all their travel needs. The new site is now live in the US, Canada, Australia, and the Philippines. The new platform is powered by Expedia Group’s White Label Template technology. It is designed to help passengers effortlessly plan and book their entire journey, including PAL flights, hotels, transportation, and exciting travel activities, all in one convenient location.
9. What pricing options are available for accessing the report?
Pricing options include single-user, multi-user, and enterprise licenses priced at USD 3800, USD 4500, and USD 5800 respectively.
10. Is the market size provided in terms of value or volume?
The market size is provided in terms of value, measured in Million.
11. Are there any specific market keywords associated with the report?
Yes, the market keyword associated with the report is "US Travel Accommodation Market," which aids in identifying and referencing the specific market segment covered.
12. How do I determine which pricing option suits my needs best?
The pricing options vary based on user requirements and access needs. Individual users may opt for single-user licenses, while businesses requiring broader access may choose multi-user or enterprise licenses for cost-effective access to the report.
13. Are there any additional resources or data provided in the US Travel Accommodation Market report?
While the report offers comprehensive insights, it's advisable to review the specific contents or supplementary materials provided to ascertain if additional resources or data are available.
14. How can I stay updated on further developments or reports in the US Travel Accommodation Market?
To stay informed about further developments, trends, and reports in the US Travel Accommodation Market, consider subscribing to industry newsletters, following relevant companies and organizations, or regularly checking reputable industry news sources and publications.
Methodology
Step 1 - Identification of Relevant Samples Size from Population Database


Step 2 - Approaches for Defining Global Market Size (Value, Volume* & Price*)

Note*: In applicable scenarios
Step 3 - Data Sources
Primary Research
- Web Analytics
- Survey Reports
- Research Institute
- Latest Research Reports
- Opinion Leaders
Secondary Research
- Annual Reports
- White Paper
- Latest Press Release
- Industry Association
- Paid Database
- Investor Presentations

Step 4 - Data Triangulation
Involves using different sources of information in order to increase the validity of a study
These sources are likely to be stakeholders in a program - participants, other researchers, program staff, other community members, and so on.
Then we put all data in single framework & apply various statistical tools to find out the dynamic on the market.
During the analysis stage, feedback from the stakeholder groups would be compared to determine areas of agreement as well as areas of divergence