

Key Insights
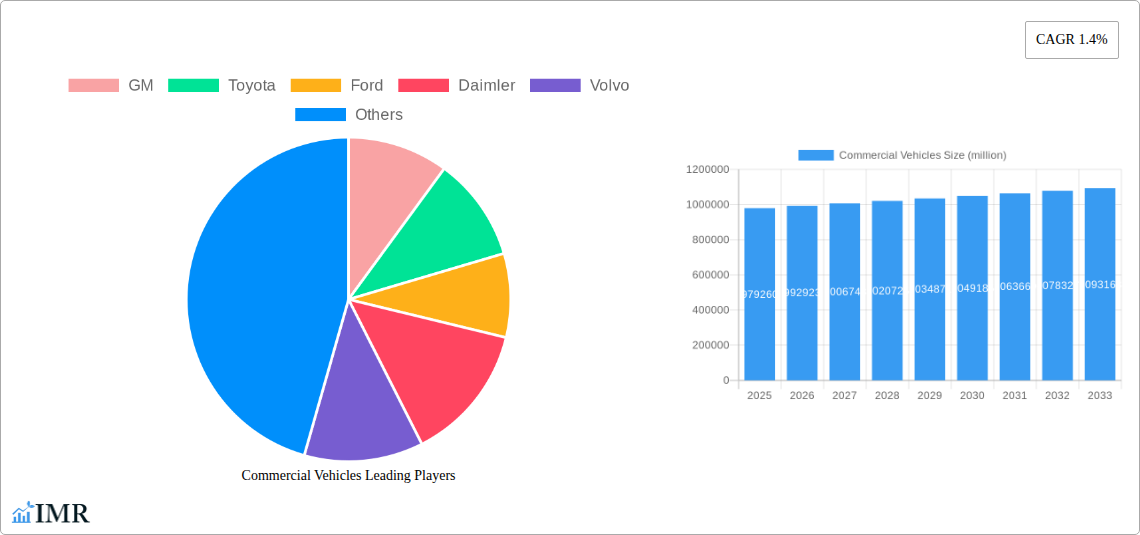
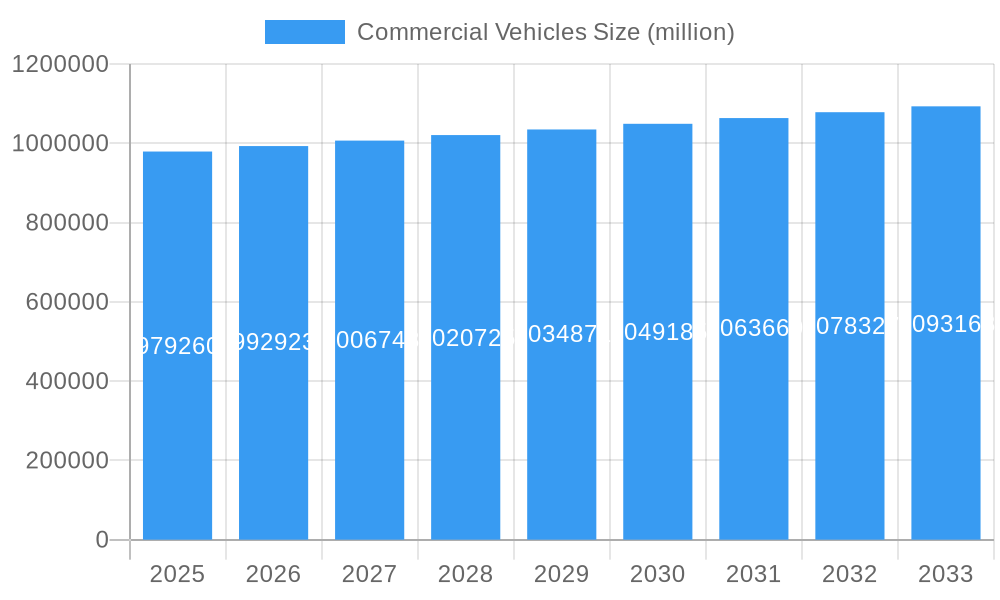
The global commercial vehicle market, valued at $1492.2 billion in 2025, is projected to expand at a compound annual growth rate (CAGR) of 3% from 2025 to 2033. This growth trajectory is propelled by ongoing infrastructure development in emerging economies and the surge in e-commerce, intensifying freight transportation demands. The market is further shaped by the increasing adoption of fuel-efficient technologies and stringent emission mandates. Conversely, economic volatility, supply chain disruptions, and inflationary pressures present significant market restraints. The expanding adoption of alternative fuel vehicles (AFVs), including electric and hydrogen-powered commercial transport, introduces both opportunities and challenges for incumbent manufacturers, requiring considerable R&D investment and potentially impacting short-term profitability. Intense market competition involves established global players such as GM, Toyota, Ford, Daimler, and Volvo, alongside prominent Chinese manufacturers like FAW Jiefang Group and Sinotruck, and emerging electric vehicle specialists like BYD.
Commercial Vehicles Market Size (In Million)
Market segmentation is anticipated across vehicle types (heavy-duty, light-duty trucks, buses), fuel types (diesel, gasoline, electric, alternative fuels), and geographical regions. Developing economies are expected to lead growth compared to more mature markets. Manufacturer success will depend on adapting to technological advancements, meeting regulatory demands, and navigating supply chain complexities. Future competitiveness will be driven by sustainability initiatives and the integration of advanced driver-assistance systems (ADAS) and connected vehicle technologies. The forecast period of 2025-2033 indicates sustained, albeit moderate, expansion within the commercial vehicle sector, influenced by a dynamic interplay of technological innovation, economic conditions, and policy frameworks.
Commercial Vehicles Company Market Share
Commercial Vehicles Market Report: 2019-2033
This comprehensive report provides an in-depth analysis of the global commercial vehicle market, encompassing historical data (2019-2024), current estimates (2025), and future forecasts (2025-2033). The report examines market dynamics, growth trends, regional performance, product landscapes, key players, and emerging opportunities within the parent market of Automotive and the child market of Commercial Vehicles. The analysis covers key segments and leading companies like GM, Toyota, Ford, Daimler, Volvo, and more, offering invaluable insights for industry professionals and strategic decision-makers. Expected market size in million units for 2025 is estimated at xx million units.
Commercial Vehicles Market Dynamics & Structure
The global commercial vehicle market is characterized by a moderately concentrated landscape, with a few dominant players holding significant market share. However, the increasing presence of Chinese manufacturers is intensifying competition. Technological innovation, particularly in areas like electrification, automation, and connectivity, is a major driving force. Stringent emission regulations globally are reshaping the industry, pushing manufacturers towards cleaner technologies. The market witnesses substantial M&A activity, with companies seeking to expand their product portfolios and geographic reach. Substitutes, such as rail and maritime transport, pose challenges but are often limited by their lack of flexibility. End-user demographics vary significantly depending on the vehicle type and region, with construction, logistics, and transportation being primary segments.
- Market Concentration: Top 5 players hold approximately xx% of global market share (2025).
- Technological Innovation: Focus on electric and autonomous vehicles driving significant investment (xx million USD in R&D, 2024).
- Regulatory Framework: Stringent emission standards (e.g., Euro VII, EPA standards) accelerating the adoption of cleaner technologies.
- M&A Activity: xx major M&A deals concluded in the past 5 years (2019-2024), totaling an estimated xx million USD.
- Innovation Barriers: High R&D costs, lengthy approval processes for new technologies, and infrastructure limitations.
Commercial Vehicles Growth Trends & Insights
The global commercial vehicle market experienced robust growth during the historical period (2019-2024), largely driven by infrastructure development in emerging economies and rising e-commerce activities. However, the COVID-19 pandemic caused a temporary slowdown in 2020. The market is projected to rebound and maintain a steady CAGR of xx% during the forecast period (2025-2033), propelled by increasing demand for efficient and sustainable transportation solutions. The adoption rate of electric commercial vehicles is expected to increase significantly, driven by government incentives and declining battery costs. Consumer behavior is shifting towards preference for connected and autonomous features, increasing the demand for technologically advanced vehicles.
- Market Size (Million Units): 2019: xx, 2024: xx, 2025: xx, 2033: xx
- CAGR (2025-2033): xx%
- Market Penetration of Electric Commercial Vehicles (2025): xx%
- Adoption Rate of Autonomous Features (2033): xx%
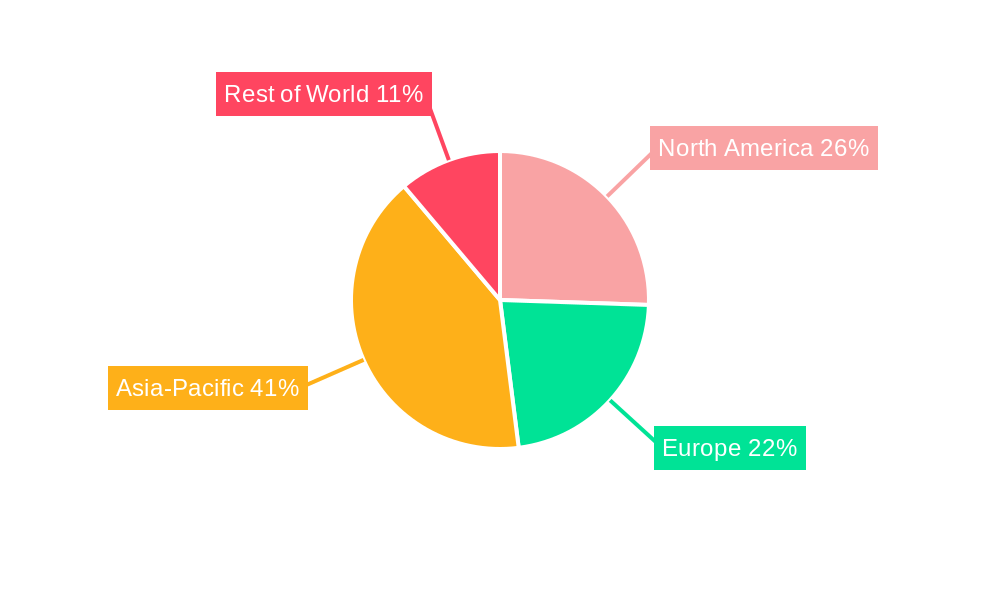
Dominant Regions, Countries, or Segments in Commercial Vehicles
The Asia-Pacific region is currently the dominant market for commercial vehicles, driven by rapid economic growth, expanding infrastructure projects, and a large and growing population in countries like China and India. China, specifically, holds a substantial market share due to its vast manufacturing base and strong domestic demand. Within segments, heavy-duty trucks contribute significantly to overall market size due to their role in large-scale logistics and infrastructure development. However, the light commercial vehicle (LCV) segment is experiencing faster growth due to burgeoning e-commerce and last-mile delivery services.
- Key Drivers in Asia-Pacific: Rapid economic growth, infrastructure development, rising e-commerce, government support for commercial vehicle manufacturing.
- China's Market Dominance: High production volume, strong domestic demand, and competitive pricing.
- Growth Potential in other regions: Increasing investments in infrastructure development in regions like Africa and Latin America.
Commercial Vehicles Product Landscape
The commercial vehicle product landscape is rapidly evolving, with manufacturers focusing on developing fuel-efficient, technologically advanced vehicles. Key innovations include advancements in engine technology, lightweight materials, advanced driver-assistance systems (ADAS), and telematics solutions. Electric and alternative fuel vehicles are gaining traction, driven by environmental concerns and government regulations. These vehicles offer improved fuel economy, reduced emissions, and enhanced safety features, significantly impacting the overall market. The unique selling propositions often include superior payload capacity, improved fuel efficiency, advanced safety features and integrated telematics systems.
Key Drivers, Barriers & Challenges in Commercial Vehicles
Key Drivers: Growing global trade and e-commerce, infrastructure development, expanding logistics and transportation sectors, government incentives for cleaner vehicles, technological advancements.
Challenges and Restraints: Supply chain disruptions, rising raw material costs, stringent emission regulations, intense competition, high initial investment for electric vehicles, skilled labor shortages, and the need for robust charging infrastructure. Supply chain disruptions are estimated to have reduced production by xx% in 2022.
Emerging Opportunities in Commercial Vehicles
Emerging opportunities lie in the growing demand for electric and autonomous commercial vehicles, the expansion into untapped markets in developing economies, and the increasing adoption of connected vehicle technologies. The development of specialized vehicles for niche applications, such as last-mile delivery and urban logistics, also presents significant growth potential. Furthermore, the integration of sustainable technologies and alternative fuels are key areas of opportunity for future innovation.
Growth Accelerators in the Commercial Vehicles Industry
Long-term growth is accelerated by several factors, including ongoing advancements in vehicle electrification and automation technologies, strategic partnerships between OEMs and technology companies, and government policies promoting sustainable transportation. Expansion into new markets, particularly in developing countries, presents another significant growth driver. Investment in research and development of advanced materials and innovative designs will further propel the market forward.
Notable Milestones in Commercial Vehicles Sector
- 2020: Significant disruption due to the COVID-19 pandemic, impacting production and sales globally.
- 2021: Increased investment in electric commercial vehicle development by major players.
- 2022: Launch of several autonomous trucking pilot programs.
- 2023: Introduction of stricter emission regulations in several regions.
- 2024: Significant M&A activity, consolidation within the industry.
In-Depth Commercial Vehicles Market Outlook
The future of the commercial vehicle market is promising, with continued growth expected across various segments and regions. Technological advancements will drive innovation, while government regulations will shape the industry's trajectory. Strategic partnerships and collaborations will play a vital role in accelerating market expansion and product development. The long-term outlook is positive, with considerable potential for growth and innovation in the years to come. The market is poised to witness further consolidation and a significant shift towards sustainable and technologically advanced vehicles.
Commercial Vehicles Segmentation
-
1. Application
- 1.1. Transportation and Logistics
- 1.2. Construction
- 1.3. Public Transit
- 1.4. Others
-
2. Types
- 2.1. Light Commercial Vehicle
- 2.2. Medium Duty/Heavy Duty Vehicle
- 2.3. Buses & Coaches
Commercial Vehicles Segmentation By Geography
-
1. North America
- 1.1. United States
- 1.2. Canada
- 1.3. Mexico
-
2. South America
- 2.1. Brazil
- 2.2. Argentina
- 2.3. Rest of South America
-
3. Europe
- 3.1. United Kingdom
- 3.2. Germany
- 3.3. France
- 3.4. Italy
- 3.5. Spain
- 3.6. Russia
- 3.7. Benelux
- 3.8. Nordics
- 3.9. Rest of Europe
-
4. Middle East & Africa
- 4.1. Turkey
- 4.2. Israel
- 4.3. GCC
- 4.4. North Africa
- 4.5. South Africa
- 4.6. Rest of Middle East & Africa
-
5. Asia Pacific
- 5.1. China
- 5.2. India
- 5.3. Japan
- 5.4. South Korea
- 5.5. ASEAN
- 5.6. Oceania
- 5.7. Rest of Asia Pacific
Commercial Vehicles Regional Market Share
Geographic Coverage of Commercial Vehicles
Commercial Vehicles REPORT HIGHLIGHTS
| Aspects | Details |
|---|---|
| Study Period | 2020-2034 |
| Base Year | 2025 |
| Estimated Year | 2026 |
| Forecast Period | 2026-2034 |
| Historical Period | 2020-2025 |
| Growth Rate | CAGR of 3% from 2020-2034 |
| Segmentation |
|
Table of Contents
- 1. Introduction
- 1.1. Research Scope
- 1.2. Market Segmentation
- 1.3. Research Objective
- 1.4. Definitions and Assumptions
- 2. Executive Summary
- 2.1. Market Snapshot
- 3. Market Dynamics
- 3.1. Market Drivers
- 3.2. Market Restrains
- 3.3. Market Trends
- 3.4. Market Opportunities
- 4. Market Factor Analysis
- 4.1. Porters Five Forces
- 4.1.1. Bargaining Power of Suppliers
- 4.1.2. Bargaining Power of Buyers
- 4.1.3. Threat of New Entrants
- 4.1.4. Threat of Substitutes
- 4.1.5. Competitive Rivalry
- 4.2. PESTEL analysis
- 4.3. BCG Analysis
- 4.3.1. Stars (High Growth, High Market Share)
- 4.3.2. Cash Cows (Low Growth, High Market Share)
- 4.3.3. Question Mark (High Growth, Low Market Share)
- 4.3.4. Dogs (Low Growth, Low Market Share)
- 4.4. Ansoff Matrix Analysis
- 4.5. Supply Chain Analysis
- 4.6. Regulatory Landscape
- 4.7. Current Market Potential and Opportunity Assessment (TAM–SAM–SOM Framework)
- 4.8. IMR Analyst Note
- 4.1. Porters Five Forces
- 5. Market Analysis, Insights and Forecast 2021-2033
- 5.1. Market Analysis, Insights and Forecast - by Application
- 5.1.1. Transportation and Logistics
- 5.1.2. Construction
- 5.1.3. Public Transit
- 5.1.4. Others
- 5.2. Market Analysis, Insights and Forecast - by Types
- 5.2.1. Light Commercial Vehicle
- 5.2.2. Medium Duty/Heavy Duty Vehicle
- 5.2.3. Buses & Coaches
- 5.3. Market Analysis, Insights and Forecast - by Region
- 5.3.1. North America
- 5.3.2. South America
- 5.3.3. Europe
- 5.3.4. Middle East & Africa
- 5.3.5. Asia Pacific
- 5.1. Market Analysis, Insights and Forecast - by Application
- 6. Global Commercial Vehicles Analysis, Insights and Forecast, 2021-2033
- 6.1. Market Analysis, Insights and Forecast - by Application
- 6.1.1. Transportation and Logistics
- 6.1.2. Construction
- 6.1.3. Public Transit
- 6.1.4. Others
- 6.2. Market Analysis, Insights and Forecast - by Types
- 6.2.1. Light Commercial Vehicle
- 6.2.2. Medium Duty/Heavy Duty Vehicle
- 6.2.3. Buses & Coaches
- 6.1. Market Analysis, Insights and Forecast - by Application
- 7. North America Commercial Vehicles Analysis, Insights and Forecast, 2020-2032
- 7.1. Market Analysis, Insights and Forecast - by Application
- 7.1.1. Transportation and Logistics
- 7.1.2. Construction
- 7.1.3. Public Transit
- 7.1.4. Others
- 7.2. Market Analysis, Insights and Forecast - by Types
- 7.2.1. Light Commercial Vehicle
- 7.2.2. Medium Duty/Heavy Duty Vehicle
- 7.2.3. Buses & Coaches
- 7.1. Market Analysis, Insights and Forecast - by Application
- 8. South America Commercial Vehicles Analysis, Insights and Forecast, 2020-2032
- 8.1. Market Analysis, Insights and Forecast - by Application
- 8.1.1. Transportation and Logistics
- 8.1.2. Construction
- 8.1.3. Public Transit
- 8.1.4. Others
- 8.2. Market Analysis, Insights and Forecast - by Types
- 8.2.1. Light Commercial Vehicle
- 8.2.2. Medium Duty/Heavy Duty Vehicle
- 8.2.3. Buses & Coaches
- 8.1. Market Analysis, Insights and Forecast - by Application
- 9. Europe Commercial Vehicles Analysis, Insights and Forecast, 2020-2032
- 9.1. Market Analysis, Insights and Forecast - by Application
- 9.1.1. Transportation and Logistics
- 9.1.2. Construction
- 9.1.3. Public Transit
- 9.1.4. Others
- 9.2. Market Analysis, Insights and Forecast - by Types
- 9.2.1. Light Commercial Vehicle
- 9.2.2. Medium Duty/Heavy Duty Vehicle
- 9.2.3. Buses & Coaches
- 9.1. Market Analysis, Insights and Forecast - by Application
- 10. Middle East & Africa Commercial Vehicles Analysis, Insights and Forecast, 2020-2032
- 10.1. Market Analysis, Insights and Forecast - by Application
- 10.1.1. Transportation and Logistics
- 10.1.2. Construction
- 10.1.3. Public Transit
- 10.1.4. Others
- 10.2. Market Analysis, Insights and Forecast - by Types
- 10.2.1. Light Commercial Vehicle
- 10.2.2. Medium Duty/Heavy Duty Vehicle
- 10.2.3. Buses & Coaches
- 10.1. Market Analysis, Insights and Forecast - by Application
- 11. Asia Pacific Commercial Vehicles Analysis, Insights and Forecast, 2020-2032
- 11.1. Market Analysis, Insights and Forecast - by Application
- 11.1.1. Transportation and Logistics
- 11.1.2. Construction
- 11.1.3. Public Transit
- 11.1.4. Others
- 11.2. Market Analysis, Insights and Forecast - by Types
- 11.2.1. Light Commercial Vehicle
- 11.2.2. Medium Duty/Heavy Duty Vehicle
- 11.2.3. Buses & Coaches
- 11.1. Market Analysis, Insights and Forecast - by Application
- 12. Competitive Analysis
- 12.1. Company Profiles
- 12.1.1 GM
- 12.1.1.1. Company Overview
- 12.1.1.2. Products
- 12.1.1.3. Company Financials
- 12.1.1.4. SWOT Analysis
- 12.1.2 Toyota
- 12.1.2.1. Company Overview
- 12.1.2.2. Products
- 12.1.2.3. Company Financials
- 12.1.2.4. SWOT Analysis
- 12.1.3 Ford
- 12.1.3.1. Company Overview
- 12.1.3.2. Products
- 12.1.3.3. Company Financials
- 12.1.3.4. SWOT Analysis
- 12.1.4 Daimler
- 12.1.4.1. Company Overview
- 12.1.4.2. Products
- 12.1.4.3. Company Financials
- 12.1.4.4. SWOT Analysis
- 12.1.5 Volvo
- 12.1.5.1. Company Overview
- 12.1.5.2. Products
- 12.1.5.3. Company Financials
- 12.1.5.4. SWOT Analysis
- 12.1.6 Stellantis
- 12.1.6.1. Company Overview
- 12.1.6.2. Products
- 12.1.6.3. Company Financials
- 12.1.6.4. SWOT Analysis
- 12.1.7 PACCAR
- 12.1.7.1. Company Overview
- 12.1.7.2. Products
- 12.1.7.3. Company Financials
- 12.1.7.4. SWOT Analysis
- 12.1.8 Faw Jiefang Group
- 12.1.8.1. Company Overview
- 12.1.8.2. Products
- 12.1.8.3. Company Financials
- 12.1.8.4. SWOT Analysis
- 12.1.9 Man Truck & bus
- 12.1.9.1. Company Overview
- 12.1.9.2. Products
- 12.1.9.3. Company Financials
- 12.1.9.4. SWOT Analysis
- 12.1.10 Scania
- 12.1.10.1. Company Overview
- 12.1.10.2. Products
- 12.1.10.3. Company Financials
- 12.1.10.4. SWOT Analysis
- 12.1.11 Iveco
- 12.1.11.1. Company Overview
- 12.1.11.2. Products
- 12.1.11.3. Company Financials
- 12.1.11.4. SWOT Analysis
- 12.1.12 Sinotruck
- 12.1.12.1. Company Overview
- 12.1.12.2. Products
- 12.1.12.3. Company Financials
- 12.1.12.4. SWOT Analysis
- 12.1.13 Shaanxi Heavy Duty Automobile
- 12.1.13.1. Company Overview
- 12.1.13.2. Products
- 12.1.13.3. Company Financials
- 12.1.13.4. SWOT Analysis
- 12.1.14 Isuzu Motors
- 12.1.14.1. Company Overview
- 12.1.14.2. Products
- 12.1.14.3. Company Financials
- 12.1.14.4. SWOT Analysis
- 12.1.15 Navistar
- 12.1.15.1. Company Overview
- 12.1.15.2. Products
- 12.1.15.3. Company Financials
- 12.1.15.4. SWOT Analysis
- 12.1.16 Tata Motors
- 12.1.16.1. Company Overview
- 12.1.16.2. Products
- 12.1.16.3. Company Financials
- 12.1.16.4. SWOT Analysis
- 12.1.17 Yutong
- 12.1.17.1. Company Overview
- 12.1.17.2. Products
- 12.1.17.3. Company Financials
- 12.1.17.4. SWOT Analysis
- 12.1.18 BYD
- 12.1.18.1. Company Overview
- 12.1.18.2. Products
- 12.1.18.3. Company Financials
- 12.1.18.4. SWOT Analysis
- 12.1.1 GM
- 12.2. Market Entropy
- 12.2.1 Company's Key Areas Served
- 12.2.2 Recent Developments
- 12.3. Company Market Share Analysis 2025
- 12.3.1 Top 5 Companies Market Share Analysis
- 12.3.2 Top 3 Companies Market Share Analysis
- 12.4. List of Potential Customers
- 13. Research Methodology
List of Figures
- Figure 1: Global Commercial Vehicles Revenue Breakdown (billion, %) by Region 2025 & 2033
- Figure 2: North America Commercial Vehicles Revenue (billion), by Application 2025 & 2033
- Figure 3: North America Commercial Vehicles Revenue Share (%), by Application 2025 & 2033
- Figure 4: North America Commercial Vehicles Revenue (billion), by Types 2025 & 2033
- Figure 5: North America Commercial Vehicles Revenue Share (%), by Types 2025 & 2033
- Figure 6: North America Commercial Vehicles Revenue (billion), by Country 2025 & 2033
- Figure 7: North America Commercial Vehicles Revenue Share (%), by Country 2025 & 2033
- Figure 8: South America Commercial Vehicles Revenue (billion), by Application 2025 & 2033
- Figure 9: South America Commercial Vehicles Revenue Share (%), by Application 2025 & 2033
- Figure 10: South America Commercial Vehicles Revenue (billion), by Types 2025 & 2033
- Figure 11: South America Commercial Vehicles Revenue Share (%), by Types 2025 & 2033
- Figure 12: South America Commercial Vehicles Revenue (billion), by Country 2025 & 2033
- Figure 13: South America Commercial Vehicles Revenue Share (%), by Country 2025 & 2033
- Figure 14: Europe Commercial Vehicles Revenue (billion), by Application 2025 & 2033
- Figure 15: Europe Commercial Vehicles Revenue Share (%), by Application 2025 & 2033
- Figure 16: Europe Commercial Vehicles Revenue (billion), by Types 2025 & 2033
- Figure 17: Europe Commercial Vehicles Revenue Share (%), by Types 2025 & 2033
- Figure 18: Europe Commercial Vehicles Revenue (billion), by Country 2025 & 2033
- Figure 19: Europe Commercial Vehicles Revenue Share (%), by Country 2025 & 2033
- Figure 20: Middle East & Africa Commercial Vehicles Revenue (billion), by Application 2025 & 2033
- Figure 21: Middle East & Africa Commercial Vehicles Revenue Share (%), by Application 2025 & 2033
- Figure 22: Middle East & Africa Commercial Vehicles Revenue (billion), by Types 2025 & 2033
- Figure 23: Middle East & Africa Commercial Vehicles Revenue Share (%), by Types 2025 & 2033
- Figure 24: Middle East & Africa Commercial Vehicles Revenue (billion), by Country 2025 & 2033
- Figure 25: Middle East & Africa Commercial Vehicles Revenue Share (%), by Country 2025 & 2033
- Figure 26: Asia Pacific Commercial Vehicles Revenue (billion), by Application 2025 & 2033
- Figure 27: Asia Pacific Commercial Vehicles Revenue Share (%), by Application 2025 & 2033
- Figure 28: Asia Pacific Commercial Vehicles Revenue (billion), by Types 2025 & 2033
- Figure 29: Asia Pacific Commercial Vehicles Revenue Share (%), by Types 2025 & 2033
- Figure 30: Asia Pacific Commercial Vehicles Revenue (billion), by Country 2025 & 2033
- Figure 31: Asia Pacific Commercial Vehicles Revenue Share (%), by Country 2025 & 2033
List of Tables
- Table 1: Global Commercial Vehicles Revenue billion Forecast, by Application 2020 & 2033
- Table 2: Global Commercial Vehicles Revenue billion Forecast, by Types 2020 & 2033
- Table 3: Global Commercial Vehicles Revenue billion Forecast, by Region 2020 & 2033
- Table 4: Global Commercial Vehicles Revenue billion Forecast, by Application 2020 & 2033
- Table 5: Global Commercial Vehicles Revenue billion Forecast, by Types 2020 & 2033
- Table 6: Global Commercial Vehicles Revenue billion Forecast, by Country 2020 & 2033
- Table 7: United States Commercial Vehicles Revenue (billion) Forecast, by Application 2020 & 2033
- Table 8: Canada Commercial Vehicles Revenue (billion) Forecast, by Application 2020 & 2033
- Table 9: Mexico Commercial Vehicles Revenue (billion) Forecast, by Application 2020 & 2033
- Table 10: Global Commercial Vehicles Revenue billion Forecast, by Application 2020 & 2033
- Table 11: Global Commercial Vehicles Revenue billion Forecast, by Types 2020 & 2033
- Table 12: Global Commercial Vehicles Revenue billion Forecast, by Country 2020 & 2033
- Table 13: Brazil Commercial Vehicles Revenue (billion) Forecast, by Application 2020 & 2033
- Table 14: Argentina Commercial Vehicles Revenue (billion) Forecast, by Application 2020 & 2033
- Table 15: Rest of South America Commercial Vehicles Revenue (billion) Forecast, by Application 2020 & 2033
- Table 16: Global Commercial Vehicles Revenue billion Forecast, by Application 2020 & 2033
- Table 17: Global Commercial Vehicles Revenue billion Forecast, by Types 2020 & 2033
- Table 18: Global Commercial Vehicles Revenue billion Forecast, by Country 2020 & 2033
- Table 19: United Kingdom Commercial Vehicles Revenue (billion) Forecast, by Application 2020 & 2033
- Table 20: Germany Commercial Vehicles Revenue (billion) Forecast, by Application 2020 & 2033
- Table 21: France Commercial Vehicles Revenue (billion) Forecast, by Application 2020 & 2033
- Table 22: Italy Commercial Vehicles Revenue (billion) Forecast, by Application 2020 & 2033
- Table 23: Spain Commercial Vehicles Revenue (billion) Forecast, by Application 2020 & 2033
- Table 24: Russia Commercial Vehicles Revenue (billion) Forecast, by Application 2020 & 2033
- Table 25: Benelux Commercial Vehicles Revenue (billion) Forecast, by Application 2020 & 2033
- Table 26: Nordics Commercial Vehicles Revenue (billion) Forecast, by Application 2020 & 2033
- Table 27: Rest of Europe Commercial Vehicles Revenue (billion) Forecast, by Application 2020 & 2033
- Table 28: Global Commercial Vehicles Revenue billion Forecast, by Application 2020 & 2033
- Table 29: Global Commercial Vehicles Revenue billion Forecast, by Types 2020 & 2033
- Table 30: Global Commercial Vehicles Revenue billion Forecast, by Country 2020 & 2033
- Table 31: Turkey Commercial Vehicles Revenue (billion) Forecast, by Application 2020 & 2033
- Table 32: Israel Commercial Vehicles Revenue (billion) Forecast, by Application 2020 & 2033
- Table 33: GCC Commercial Vehicles Revenue (billion) Forecast, by Application 2020 & 2033
- Table 34: North Africa Commercial Vehicles Revenue (billion) Forecast, by Application 2020 & 2033
- Table 35: South Africa Commercial Vehicles Revenue (billion) Forecast, by Application 2020 & 2033
- Table 36: Rest of Middle East & Africa Commercial Vehicles Revenue (billion) Forecast, by Application 2020 & 2033
- Table 37: Global Commercial Vehicles Revenue billion Forecast, by Application 2020 & 2033
- Table 38: Global Commercial Vehicles Revenue billion Forecast, by Types 2020 & 2033
- Table 39: Global Commercial Vehicles Revenue billion Forecast, by Country 2020 & 2033
- Table 40: China Commercial Vehicles Revenue (billion) Forecast, by Application 2020 & 2033
- Table 41: India Commercial Vehicles Revenue (billion) Forecast, by Application 2020 & 2033
- Table 42: Japan Commercial Vehicles Revenue (billion) Forecast, by Application 2020 & 2033
- Table 43: South Korea Commercial Vehicles Revenue (billion) Forecast, by Application 2020 & 2033
- Table 44: ASEAN Commercial Vehicles Revenue (billion) Forecast, by Application 2020 & 2033
- Table 45: Oceania Commercial Vehicles Revenue (billion) Forecast, by Application 2020 & 2033
- Table 46: Rest of Asia Pacific Commercial Vehicles Revenue (billion) Forecast, by Application 2020 & 2033
Frequently Asked Questions
1. What is the projected Compound Annual Growth Rate (CAGR) of the Commercial Vehicles?
The projected CAGR is approximately 3%.
2. Which companies are prominent players in the Commercial Vehicles?
Key companies in the market include GM, Toyota, Ford, Daimler, Volvo, Stellantis, PACCAR, Faw Jiefang Group, Man Truck & bus, Scania, Iveco, Sinotruck, Shaanxi Heavy Duty Automobile, Isuzu Motors, Navistar, Tata Motors, Yutong, BYD.
3. What are the main segments of the Commercial Vehicles?
The market segments include Application, Types.
4. Can you provide details about the market size?
The market size is estimated to be USD 1492.2 billion as of 2022.
5. What are some drivers contributing to market growth?
N/A
6. What are the notable trends driving market growth?
N/A
7. Are there any restraints impacting market growth?
N/A
8. Can you provide examples of recent developments in the market?
N/A
9. What pricing options are available for accessing the report?
Pricing options include single-user, multi-user, and enterprise licenses priced at USD 5600.00, USD 8400.00, and USD 11200.00 respectively.
10. Is the market size provided in terms of value or volume?
The market size is provided in terms of value, measured in billion.
11. Are there any specific market keywords associated with the report?
Yes, the market keyword associated with the report is "Commercial Vehicles," which aids in identifying and referencing the specific market segment covered.
12. How do I determine which pricing option suits my needs best?
The pricing options vary based on user requirements and access needs. Individual users may opt for single-user licenses, while businesses requiring broader access may choose multi-user or enterprise licenses for cost-effective access to the report.
13. Are there any additional resources or data provided in the Commercial Vehicles report?
While the report offers comprehensive insights, it's advisable to review the specific contents or supplementary materials provided to ascertain if additional resources or data are available.
14. How can I stay updated on further developments or reports in the Commercial Vehicles?
To stay informed about further developments, trends, and reports in the Commercial Vehicles, consider subscribing to industry newsletters, following relevant companies and organizations, or regularly checking reputable industry news sources and publications.
Methodology
Step 1 - Identification of Relevant Samples Size from Population Database


Step 2 - Approaches for Defining Global Market Size (Value, Volume* & Price*)

Note*: In applicable scenarios
Step 3 - Data Sources
Primary Research
- Web Analytics
- Survey Reports
- Research Institute
- Latest Research Reports
- Opinion Leaders
Secondary Research
- Annual Reports
- White Paper
- Latest Press Release
- Industry Association
- Paid Database
- Investor Presentations

Step 4 - Data Triangulation
Involves using different sources of information in order to increase the validity of a study
These sources are likely to be stakeholders in a program - participants, other researchers, program staff, other community members, and so on.
Then we put all data in single framework & apply various statistical tools to find out the dynamic on the market.
During the analysis stage, feedback from the stakeholder groups would be compared to determine areas of agreement as well as areas of divergence