

Key Insights
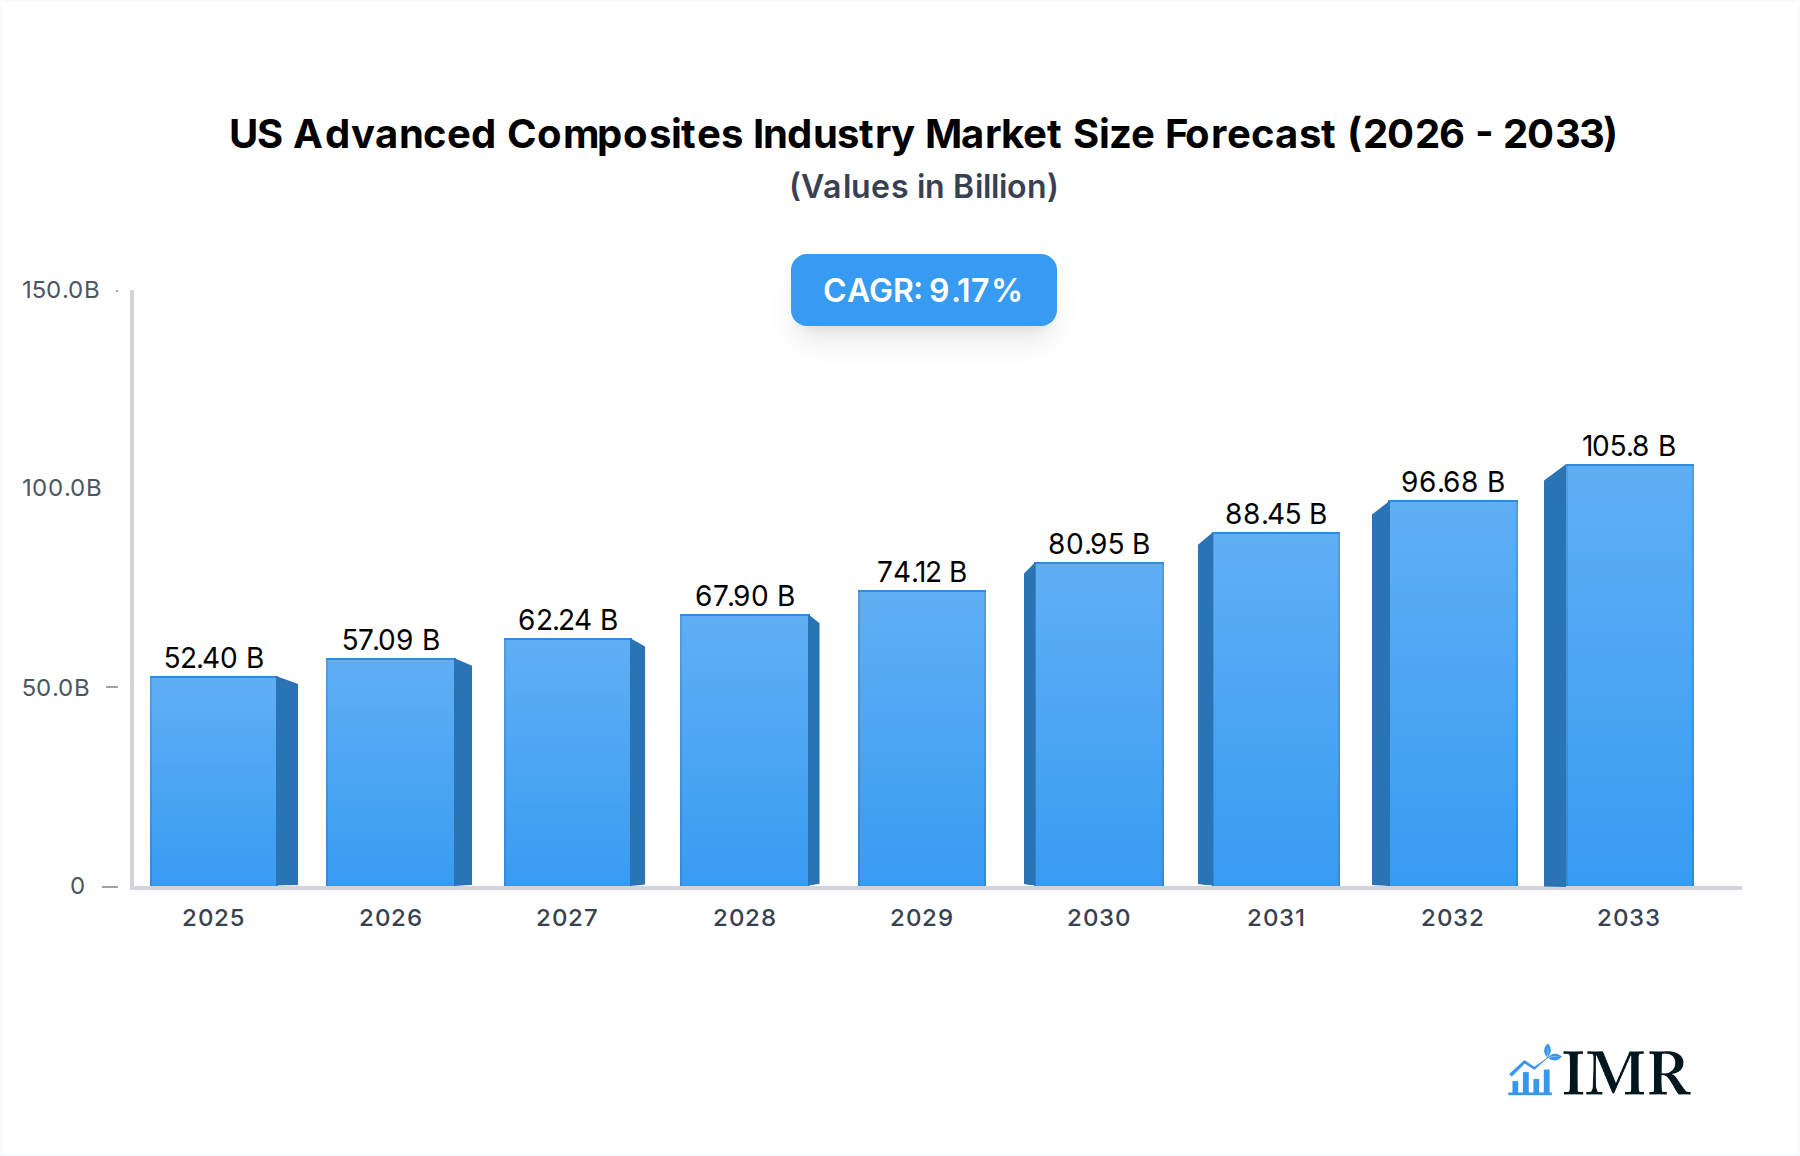
The US advanced composites market is poised for significant expansion, driven by escalating demand across key sectors like aerospace, automotive, and renewable energy. With a current estimated market size of $52.4 billion in 2025, the industry is projected to experience robust growth, exhibiting a Compound Annual Growth Rate (CAGR) of 8.9% through 2033. This upward trajectory is primarily fueled by the inherent advantages of advanced composites, including their high strength-to-weight ratio, superior durability, and corrosion resistance. In the automotive sector, the push for fuel efficiency and reduced emissions is a major catalyst, leading to increased adoption of composite materials for structural components, body panels, and interior parts. Similarly, the aerospace industry continues to integrate advanced composites for lighter, more fuel-efficient aircraft, while the growing renewable energy landscape, particularly in wind turbine manufacturing, presents substantial opportunities. Emerging trends include the development of more sustainable and recyclable composite materials, advancements in manufacturing processes like additive manufacturing for composites, and the integration of smart functionalities within composite structures.

US Advanced Composites Industry Market Size (In Billion)
The market's growth, however, is not without its challenges. High initial manufacturing costs and the complexity of processing certain advanced composite materials can act as restraints. Furthermore, the need for specialized infrastructure and skilled labor for their production and repair requires substantial investment. Despite these hurdles, the continuous innovation in material science, coupled with supportive government initiatives and increasing R&D investments by major players like Toray Industries Inc., BASF, and General Motors Company, is expected to mitigate these challenges. The market's segmentation reveals a strong demand for thermoset polymers and carbon fiber, particularly within structural assembly and power train components. Geographically, North America, led by the United States, is a dominant region, benefiting from a strong industrial base and early adoption of advanced technologies.
US Advanced Composites Industry Company Market Share
US Advanced Composites Industry Market Dynamics & Structure
The US advanced composites industry is characterized by a dynamic and evolving market structure, driven by continuous technological innovation and increasing demand across diverse sectors. Market concentration is moderate, with a few key players dominating specific niches, while a broader landscape of specialized manufacturers caters to specialized applications. Technological innovation is a primary driver, fueled by advancements in material science, manufacturing processes, and product design. This includes the development of lighter, stronger, and more sustainable composite materials. Regulatory frameworks, particularly those focused on environmental impact and safety standards, significantly influence material selection and manufacturing practices. Competitive product substitutes, such as traditional metals and advanced polymers, present ongoing challenges, necessitating continuous performance improvements and cost optimization in composite solutions. End-user demographics are shifting towards industries prioritizing weight reduction, fuel efficiency, and enhanced performance, including aerospace, automotive, and renewable energy. Mergers and acquisitions (M&A) trends are active, with larger companies acquiring smaller, innovative firms to expand their technology portfolios and market reach.
- Market Concentration: Moderate, with key players and a fragmented specialty segment.
- Technological Innovation Drivers: Material science advancements, manufacturing process improvements, design optimization.
- Regulatory Frameworks: Focus on environmental sustainability, safety standards, and performance regulations.
- Competitive Product Substitutes: Traditional metals (aluminum, steel), advanced polymers, ceramics.
- End-User Demographics: Aerospace, automotive, wind energy, industrial manufacturing, marine.
- M&A Trends: Strategic acquisitions for technology integration and market expansion.
US Advanced Composites Industry Growth Trends & Insights
The US advanced composites industry is poised for significant expansion, driven by a confluence of technological advancements, evolving market demands, and supportive economic factors. The market size is projected to grow substantially, with adoption rates increasing across a wide array of applications. Technological disruptions are a constant feature, with the emergence of novel composite materials and sophisticated manufacturing techniques like additive manufacturing for composites, pushing the boundaries of what is achievable. Consumer behavior shifts, particularly in the automotive sector, towards lighter, more fuel-efficient vehicles, are directly translating into increased demand for advanced composites. The industry is witnessing a robust Compound Annual Growth Rate (CAGR), reflecting its increasing penetration into traditional markets and its role in enabling new technologies.
This growth trajectory is further bolstered by ongoing research and development efforts focused on enhancing the mechanical properties, thermal resistance, and overall performance of composite materials. The development of smart composites, which can self-diagnose and self-repair, is a groundbreaking area poised to revolutionize product longevity and maintenance. Furthermore, the increasing emphasis on sustainability is driving the adoption of bio-based and recyclable composite materials, aligning with global environmental initiatives and appealing to a growing environmentally conscious consumer base. The US market, with its strong innovation ecosystem and significant industrial base, is at the forefront of these advancements.
The integration of advanced composites in structural applications within the aerospace and defense sectors continues to be a primary growth engine, offering substantial weight savings and improved fuel efficiency for aircraft and spacecraft. In the automotive industry, the drive for electrification and autonomous driving is accelerating the adoption of composites for lightweight chassis components, battery enclosures, and body panels, contributing to improved vehicle range and performance. The renewable energy sector, particularly wind turbine manufacturing, remains a significant consumer of composites for rotor blades, capitalizing on their strength-to-weight ratio and durability in harsh environments. The industrial sector is also experiencing increased adoption for components requiring high strength, chemical resistance, and corrosion resistance.
The forecast indicates a sustained upward trend in market penetration as the cost-effectiveness of advanced composites improves through economies of scale and manufacturing efficiencies. The development of advanced modeling and simulation tools is enabling engineers to design and optimize composite structures with greater precision, further accelerating adoption. Industry professionals are increasingly recognizing the long-term economic benefits of using advanced composites, including reduced lifecycle costs, enhanced product performance, and increased operational efficiency. The US government's investment in advanced manufacturing and infrastructure projects also provides a conducive environment for the growth of the advanced composites market. The estimated market size for US advanced composites in 2025 is projected to reach $XX billion.
Dominant Regions, Countries, or Segments in US Advanced Composites Industry
The US advanced composites industry's dominance is multifaceted, with specific regions, material types, and application segments exhibiting significant leadership. Geographically, the Midwest and the Southeast regions stand out as dominant hubs. The Midwest benefits from its strong automotive manufacturing base, a historical and current significant consumer of advanced composites for weight reduction and performance enhancement. Major automotive players like General Motors Company and BMW have substantial R&D and manufacturing operations in this region, driving demand for sophisticated composite solutions. The Southeast, with its robust aerospace and defense industry, including companies like Toray Industries Inc and Teijin Limite, also significantly contributes to regional dominance. Proximity to major aerospace manufacturers and a skilled workforce are key drivers.
- Dominant Regions:
- Midwest: Strong automotive manufacturing presence, high demand for lightweighting.
- Southeast: Hub for aerospace and defense industries, significant R&D investment.
When considering Material Type, Carbon Fiber and Glass Fiber are the primary drivers of market growth. Carbon fiber, with its exceptional strength-to-weight ratio and stiffness, is critical for high-performance applications in aerospace and high-end automotive. Companies like SGL Group are key suppliers in this segment. Glass fiber, while more cost-effective, offers excellent mechanical properties and versatility, making it suitable for a broader range of applications across automotive, wind energy, and infrastructure. The continuous development of advanced resin systems, such as those produced by BASF, further enhances the performance of these fiber types.
- Dominant Material Types:
- Carbon Fiber: High strength-to-weight ratio, critical for aerospace and performance automotive.
- Glass Fiber: Versatile, cost-effective, broad application spectrum.
In terms of Application Type, Structural Assembly and Power Train Components are leading the charge in driving market growth. Structural assemblies, encompassing aircraft primary and secondary structures, automotive chassis, and wind turbine blades, benefit immensely from the weight savings and enhanced durability offered by advanced composites. Companies like Nippo Sheet Glass Co Ltd are crucial in supplying materials for these large-scale structures. Power train components, including engine covers, transmission housings, and battery enclosures in electric vehicles, leverage composites for improved thermal management, reduced vibration, and overall system efficiency. Delphi Auto is a notable player in this space.
- Dominant Application Types:
- Structural Assembly: Aircraft, automotive chassis, wind turbine blades, infrastructure.
- Power Train Components: Engine parts, battery enclosures, transmission components.
The manufacturing processes also play a role. Resin Transfer Molding (RTM) and Vacuum Infusion Processing (VIP) are increasingly dominant production types for complex, high-performance composite parts, enabling precise fiber placement and resin distribution, favored by companies like 3B Fiberglass. These processes allow for the production of intricate shapes with excellent mechanical integrity, catering to the demanding requirements of the aerospace and automotive sectors.
- Dominant Production Types:
- Resin Transfer Molding (RTM): Precision manufacturing for complex parts.
- Vacuum Infusion Processing (VIP): Efficient production of large, high-performance components.
US Advanced Composites Industry Product Landscape
The US advanced composites industry is characterized by a relentless pursuit of enhanced performance and novel applications. Product innovations are centered on developing materials with superior mechanical properties, increased thermal resistance, and improved fire retardancy. Lightweighting remains a paramount objective, driving the creation of thinner yet stronger composite structures for aerospace and automotive sectors. Applications are expanding beyond traditional uses, with advanced composites finding their way into medical devices, sporting goods, and consumer electronics, offering unique aesthetic and functional benefits. Technological advancements in resin formulations and fiber hybridization are yielding materials with tailored properties, such as improved impact resistance and fatigue life. Companies like Cytec Industries Inc are at the forefront of developing advanced materials that push the boundaries of performance.
Key Drivers, Barriers & Challenges in US Advanced Composites Industry
The US advanced composites industry is propelled by significant drivers, including the relentless demand for lightweighting across key sectors like aerospace and automotive, leading to improved fuel efficiency and reduced emissions. Technological advancements in materials science and manufacturing processes, such as automated fiber placement and additive manufacturing, are enhancing performance and reducing production costs. Supportive government initiatives promoting advanced manufacturing and sustainability further bolster growth. The increasing adoption of electric vehicles (EVs) necessitates lightweight battery enclosures and structural components, acting as a major growth accelerator.
However, the industry faces notable barriers and challenges. The high initial cost of raw materials, particularly carbon fiber, remains a significant restraint, impacting broader market penetration in cost-sensitive applications. Complex manufacturing processes and the need for specialized equipment contribute to higher production expenses compared to traditional materials. The lack of standardized testing and certification protocols for composite materials in certain applications can also hinder widespread adoption. Furthermore, recycling and end-of-life management of composite materials present an ongoing environmental challenge that requires innovative solutions. Supply chain disruptions and the availability of skilled labor can also impact production volumes and cost-effectiveness.
Emerging Opportunities in US Advanced Composites Industry
Emerging opportunities in the US advanced composites industry lie in the growing demand for sustainable and bio-based composite materials, driven by increasing environmental regulations and consumer preferences. The expansion of electric vertical takeoff and landing (eVTOL) aircraft presents a significant new market for lightweight and high-performance composites. Advancements in additive manufacturing (3D printing) for composites are opening doors for rapid prototyping, customization, and the creation of complex geometries previously impossible with traditional methods. The integration of sensors and smart functionalities within composite structures to create self-monitoring and self-healing components represents a significant technological leap. Furthermore, the infrastructure sector is increasingly exploring composite solutions for bridges, pipelines, and repair applications due to their corrosion resistance and durability.
Growth Accelerators in the US Advanced Composites Industry Industry
Long-term growth in the US advanced composites industry is being significantly accelerated by breakthroughs in nanotechnology, which are enhancing the mechanical and thermal properties of composite materials. Strategic partnerships between material suppliers, component manufacturers, and end-users are fostering collaborative innovation and faster market entry for new products. The increasing global focus on decarbonization and sustainable energy solutions, particularly in wind energy and electric transportation, provides a robust demand pipeline for advanced composites. The development of more cost-effective manufacturing techniques and the establishment of robust composite recycling infrastructure will further reduce lifecycle costs and drive wider adoption.
Key Players Shaping the US Advanced Composites Industry Market
- Nippo Sheet Glass Co Ltd
- 3B Fiberglass
- Teijin Limite
- BASF
- Toray Industries Inc
- General Motors Company
- Base Group
- Cytec Industries Inc
- BMW
- Delphi Auto
- SGL Group
Notable Milestones in US Advanced Composites Industry Sector
- 2019: Increased investment in R&D for high-performance thermoset composites for aerospace applications.
- 2020: Launch of new thermoplastic composite grades with enhanced recyclability by key manufacturers.
- 2021: Significant growth in adoption of advanced composites for electric vehicle battery enclosures.
- 2022: Expansion of additive manufacturing capabilities for composite components by several industry leaders.
- 2023: Heightened focus on sustainable composite solutions and end-of-life recycling technologies.
- 2024: Increased collaboration between material suppliers and automotive OEMs for lightweighting initiatives.
In-Depth US Advanced Composites Industry Market Outlook
The future outlook for the US advanced composites industry is exceptionally bright, driven by sustained innovation and expanding applications. Key growth accelerators include continued advancements in material science, leading to lighter, stronger, and more functional composites. The relentless pursuit of fuel efficiency and emissions reduction in transportation, coupled with the electrification revolution, will ensure robust demand. The renewable energy sector, particularly wind power, will remain a significant consumer. Strategic partnerships and increased investment in R&D will foster the development of disruptive technologies and novel applications, further solidifying the industry's growth trajectory and its crucial role in shaping future industrial landscapes.
US Advanced Composites Industry Segmentation
-
1. Productino Type
- 1.1. Hand Layup
- 1.2. Resin Transfer Molding
- 1.3. Vacuum Infusion Processing
- 1.4. Injection Molding
- 1.5. Compression Molding
-
2. Material Type
- 2.1. Thermoset Polymer
- 2.2. Thermoplastic Polymer
- 2.3. Carbon Fiber
- 2.4. Glass Fiber
- 2.5. Others
-
3. Application Type
- 3.1. Structural Assembly
- 3.2. Power Train Components
- 3.3. Interior
- 3.4. Exterior
- 3.5. Others
US Advanced Composites Industry Segmentation By Geography
-
1. North America
- 1.1. United States
- 1.2. Canada
- 1.3. Mexico
-
2. South America
- 2.1. Brazil
- 2.2. Argentina
- 2.3. Rest of South America
-
3. Europe
- 3.1. United Kingdom
- 3.2. Germany
- 3.3. France
- 3.4. Italy
- 3.5. Spain
- 3.6. Russia
- 3.7. Benelux
- 3.8. Nordics
- 3.9. Rest of Europe
-
4. Middle East & Africa
- 4.1. Turkey
- 4.2. Israel
- 4.3. GCC
- 4.4. North Africa
- 4.5. South Africa
- 4.6. Rest of Middle East & Africa
-
5. Asia Pacific
- 5.1. China
- 5.2. India
- 5.3. Japan
- 5.4. South Korea
- 5.5. ASEAN
- 5.6. Oceania
- 5.7. Rest of Asia Pacific

US Advanced Composites Industry Regional Market Share
Geographic Coverage of US Advanced Composites Industry
US Advanced Composites Industry REPORT HIGHLIGHTS
| Aspects | Details |
|---|---|
| Study Period | 2020-2034 |
| Base Year | 2025 |
| Estimated Year | 2026 |
| Forecast Period | 2026-2034 |
| Historical Period | 2020-2025 |
| Growth Rate | CAGR of 8.9% from 2020-2034 |
| Segmentation |
|
Table of Contents
- 1. Introduction
- 1.1. Research Scope
- 1.2. Market Segmentation
- 1.3. Research Objective
- 1.4. Definitions and Assumptions
- 2. Executive Summary
- 2.1. Market Snapshot
- 3. Market Dynamics
- 3.1. Market Drivers
- 3.2. Market Restrains
- 3.3. Market Trends
- 3.4. Market Opportunities
- 4. Market Factor Analysis
- 4.1. Porters Five Forces
- 4.1.1. Bargaining Power of Suppliers
- 4.1.2. Bargaining Power of Buyers
- 4.1.3. Threat of New Entrants
- 4.1.4. Threat of Substitutes
- 4.1.5. Competitive Rivalry
- 4.2. PESTEL analysis
- 4.3. BCG Analysis
- 4.3.1. Stars (High Growth, High Market Share)
- 4.3.2. Cash Cows (Low Growth, High Market Share)
- 4.3.3. Question Mark (High Growth, Low Market Share)
- 4.3.4. Dogs (Low Growth, Low Market Share)
- 4.4. Ansoff Matrix Analysis
- 4.5. Supply Chain Analysis
- 4.6. Regulatory Landscape
- 4.7. Current Market Potential and Opportunity Assessment (TAM–SAM–SOM Framework)
- 4.8. IMR Analyst Note
- 4.1. Porters Five Forces
- 5. Market Analysis, Insights and Forecast 2021-2033
- 5.1. Market Analysis, Insights and Forecast - by Productino Type
- 5.1.1. Hand Layup
- 5.1.2. Resin Transfer Molding
- 5.1.3. Vacuum Infusion Processing
- 5.1.4. Injection Molding
- 5.1.5. Compression Molding
- 5.2. Market Analysis, Insights and Forecast - by Material Type
- 5.2.1. Thermoset Polymer
- 5.2.2. Thermoplastic Polymer
- 5.2.3. Carbon Fiber
- 5.2.4. Glass Fiber
- 5.2.5. Others
- 5.3. Market Analysis, Insights and Forecast - by Application Type
- 5.3.1. Structural Assembly
- 5.3.2. Power Train Components
- 5.3.3. Interior
- 5.3.4. Exterior
- 5.3.5. Others
- 5.4. Market Analysis, Insights and Forecast - by Region
- 5.4.1. North America
- 5.4.2. South America
- 5.4.3. Europe
- 5.4.4. Middle East & Africa
- 5.4.5. Asia Pacific
- 5.1. Market Analysis, Insights and Forecast - by Productino Type
- 6. Global US Advanced Composites Industry Analysis, Insights and Forecast, 2021-2033
- 6.1. Market Analysis, Insights and Forecast - by Productino Type
- 6.1.1. Hand Layup
- 6.1.2. Resin Transfer Molding
- 6.1.3. Vacuum Infusion Processing
- 6.1.4. Injection Molding
- 6.1.5. Compression Molding
- 6.2. Market Analysis, Insights and Forecast - by Material Type
- 6.2.1. Thermoset Polymer
- 6.2.2. Thermoplastic Polymer
- 6.2.3. Carbon Fiber
- 6.2.4. Glass Fiber
- 6.2.5. Others
- 6.3. Market Analysis, Insights and Forecast - by Application Type
- 6.3.1. Structural Assembly
- 6.3.2. Power Train Components
- 6.3.3. Interior
- 6.3.4. Exterior
- 6.3.5. Others
- 6.1. Market Analysis, Insights and Forecast - by Productino Type
- 7. North America US Advanced Composites Industry Analysis, Insights and Forecast, 2020-2032
- 7.1. Market Analysis, Insights and Forecast - by Productino Type
- 7.1.1. Hand Layup
- 7.1.2. Resin Transfer Molding
- 7.1.3. Vacuum Infusion Processing
- 7.1.4. Injection Molding
- 7.1.5. Compression Molding
- 7.2. Market Analysis, Insights and Forecast - by Material Type
- 7.2.1. Thermoset Polymer
- 7.2.2. Thermoplastic Polymer
- 7.2.3. Carbon Fiber
- 7.2.4. Glass Fiber
- 7.2.5. Others
- 7.3. Market Analysis, Insights and Forecast - by Application Type
- 7.3.1. Structural Assembly
- 7.3.2. Power Train Components
- 7.3.3. Interior
- 7.3.4. Exterior
- 7.3.5. Others
- 7.1. Market Analysis, Insights and Forecast - by Productino Type
- 8. South America US Advanced Composites Industry Analysis, Insights and Forecast, 2020-2032
- 8.1. Market Analysis, Insights and Forecast - by Productino Type
- 8.1.1. Hand Layup
- 8.1.2. Resin Transfer Molding
- 8.1.3. Vacuum Infusion Processing
- 8.1.4. Injection Molding
- 8.1.5. Compression Molding
- 8.2. Market Analysis, Insights and Forecast - by Material Type
- 8.2.1. Thermoset Polymer
- 8.2.2. Thermoplastic Polymer
- 8.2.3. Carbon Fiber
- 8.2.4. Glass Fiber
- 8.2.5. Others
- 8.3. Market Analysis, Insights and Forecast - by Application Type
- 8.3.1. Structural Assembly
- 8.3.2. Power Train Components
- 8.3.3. Interior
- 8.3.4. Exterior
- 8.3.5. Others
- 8.1. Market Analysis, Insights and Forecast - by Productino Type
- 9. Europe US Advanced Composites Industry Analysis, Insights and Forecast, 2020-2032
- 9.1. Market Analysis, Insights and Forecast - by Productino Type
- 9.1.1. Hand Layup
- 9.1.2. Resin Transfer Molding
- 9.1.3. Vacuum Infusion Processing
- 9.1.4. Injection Molding
- 9.1.5. Compression Molding
- 9.2. Market Analysis, Insights and Forecast - by Material Type
- 9.2.1. Thermoset Polymer
- 9.2.2. Thermoplastic Polymer
- 9.2.3. Carbon Fiber
- 9.2.4. Glass Fiber
- 9.2.5. Others
- 9.3. Market Analysis, Insights and Forecast - by Application Type
- 9.3.1. Structural Assembly
- 9.3.2. Power Train Components
- 9.3.3. Interior
- 9.3.4. Exterior
- 9.3.5. Others
- 9.1. Market Analysis, Insights and Forecast - by Productino Type
- 10. Middle East & Africa US Advanced Composites Industry Analysis, Insights and Forecast, 2020-2032
- 10.1. Market Analysis, Insights and Forecast - by Productino Type
- 10.1.1. Hand Layup
- 10.1.2. Resin Transfer Molding
- 10.1.3. Vacuum Infusion Processing
- 10.1.4. Injection Molding
- 10.1.5. Compression Molding
- 10.2. Market Analysis, Insights and Forecast - by Material Type
- 10.2.1. Thermoset Polymer
- 10.2.2. Thermoplastic Polymer
- 10.2.3. Carbon Fiber
- 10.2.4. Glass Fiber
- 10.2.5. Others
- 10.3. Market Analysis, Insights and Forecast - by Application Type
- 10.3.1. Structural Assembly
- 10.3.2. Power Train Components
- 10.3.3. Interior
- 10.3.4. Exterior
- 10.3.5. Others
- 10.1. Market Analysis, Insights and Forecast - by Productino Type
- 11. Asia Pacific US Advanced Composites Industry Analysis, Insights and Forecast, 2020-2032
- 11.1. Market Analysis, Insights and Forecast - by Productino Type
- 11.1.1. Hand Layup
- 11.1.2. Resin Transfer Molding
- 11.1.3. Vacuum Infusion Processing
- 11.1.4. Injection Molding
- 11.1.5. Compression Molding
- 11.2. Market Analysis, Insights and Forecast - by Material Type
- 11.2.1. Thermoset Polymer
- 11.2.2. Thermoplastic Polymer
- 11.2.3. Carbon Fiber
- 11.2.4. Glass Fiber
- 11.2.5. Others
- 11.3. Market Analysis, Insights and Forecast - by Application Type
- 11.3.1. Structural Assembly
- 11.3.2. Power Train Components
- 11.3.3. Interior
- 11.3.4. Exterior
- 11.3.5. Others
- 11.1. Market Analysis, Insights and Forecast - by Productino Type
- 12. Competitive Analysis
- 12.1. Company Profiles
- 12.1.1 Nippo Sheet Glass Co Ltd
- 12.1.1.1. Company Overview
- 12.1.1.2. Products
- 12.1.1.3. Company Financials
- 12.1.1.4. SWOT Analysis
- 12.1.2 3B Fiberglass
- 12.1.2.1. Company Overview
- 12.1.2.2. Products
- 12.1.2.3. Company Financials
- 12.1.2.4. SWOT Analysis
- 12.1.3 Teijin Limite
- 12.1.3.1. Company Overview
- 12.1.3.2. Products
- 12.1.3.3. Company Financials
- 12.1.3.4. SWOT Analysis
- 12.1.4 BASF
- 12.1.4.1. Company Overview
- 12.1.4.2. Products
- 12.1.4.3. Company Financials
- 12.1.4.4. SWOT Analysis
- 12.1.5 Toray Industries Inc
- 12.1.5.1. Company Overview
- 12.1.5.2. Products
- 12.1.5.3. Company Financials
- 12.1.5.4. SWOT Analysis
- 12.1.6 General Motors Company
- 12.1.6.1. Company Overview
- 12.1.6.2. Products
- 12.1.6.3. Company Financials
- 12.1.6.4. SWOT Analysis
- 12.1.7 Base Group
- 12.1.7.1. Company Overview
- 12.1.7.2. Products
- 12.1.7.3. Company Financials
- 12.1.7.4. SWOT Analysis
- 12.1.8 Cytec Industries Inc
- 12.1.8.1. Company Overview
- 12.1.8.2. Products
- 12.1.8.3. Company Financials
- 12.1.8.4. SWOT Analysis
- 12.1.9 BMW
- 12.1.9.1. Company Overview
- 12.1.9.2. Products
- 12.1.9.3. Company Financials
- 12.1.9.4. SWOT Analysis
- 12.1.10 Delphi Auto
- 12.1.10.1. Company Overview
- 12.1.10.2. Products
- 12.1.10.3. Company Financials
- 12.1.10.4. SWOT Analysis
- 12.1.11 SGL Group
- 12.1.11.1. Company Overview
- 12.1.11.2. Products
- 12.1.11.3. Company Financials
- 12.1.11.4. SWOT Analysis
- 12.1.1 Nippo Sheet Glass Co Ltd
- 12.2. Market Entropy
- 12.2.1 Company's Key Areas Served
- 12.2.2 Recent Developments
- 12.3. Company Market Share Analysis 2025
- 12.3.1 Top 5 Companies Market Share Analysis
- 12.3.2 Top 3 Companies Market Share Analysis
- 12.4. List of Potential Customers
- 13. Research Methodology
List of Figures
- Figure 1: Global US Advanced Composites Industry Revenue Breakdown (billion, %) by Region 2025 & 2033
- Figure 2: North America US Advanced Composites Industry Revenue (billion), by Productino Type 2025 & 2033
- Figure 3: North America US Advanced Composites Industry Revenue Share (%), by Productino Type 2025 & 2033
- Figure 4: North America US Advanced Composites Industry Revenue (billion), by Material Type 2025 & 2033
- Figure 5: North America US Advanced Composites Industry Revenue Share (%), by Material Type 2025 & 2033
- Figure 6: North America US Advanced Composites Industry Revenue (billion), by Application Type 2025 & 2033
- Figure 7: North America US Advanced Composites Industry Revenue Share (%), by Application Type 2025 & 2033
- Figure 8: North America US Advanced Composites Industry Revenue (billion), by Country 2025 & 2033
- Figure 9: North America US Advanced Composites Industry Revenue Share (%), by Country 2025 & 2033
- Figure 10: South America US Advanced Composites Industry Revenue (billion), by Productino Type 2025 & 2033
- Figure 11: South America US Advanced Composites Industry Revenue Share (%), by Productino Type 2025 & 2033
- Figure 12: South America US Advanced Composites Industry Revenue (billion), by Material Type 2025 & 2033
- Figure 13: South America US Advanced Composites Industry Revenue Share (%), by Material Type 2025 & 2033
- Figure 14: South America US Advanced Composites Industry Revenue (billion), by Application Type 2025 & 2033
- Figure 15: South America US Advanced Composites Industry Revenue Share (%), by Application Type 2025 & 2033
- Figure 16: South America US Advanced Composites Industry Revenue (billion), by Country 2025 & 2033
- Figure 17: South America US Advanced Composites Industry Revenue Share (%), by Country 2025 & 2033
- Figure 18: Europe US Advanced Composites Industry Revenue (billion), by Productino Type 2025 & 2033
- Figure 19: Europe US Advanced Composites Industry Revenue Share (%), by Productino Type 2025 & 2033
- Figure 20: Europe US Advanced Composites Industry Revenue (billion), by Material Type 2025 & 2033
- Figure 21: Europe US Advanced Composites Industry Revenue Share (%), by Material Type 2025 & 2033
- Figure 22: Europe US Advanced Composites Industry Revenue (billion), by Application Type 2025 & 2033
- Figure 23: Europe US Advanced Composites Industry Revenue Share (%), by Application Type 2025 & 2033
- Figure 24: Europe US Advanced Composites Industry Revenue (billion), by Country 2025 & 2033
- Figure 25: Europe US Advanced Composites Industry Revenue Share (%), by Country 2025 & 2033
- Figure 26: Middle East & Africa US Advanced Composites Industry Revenue (billion), by Productino Type 2025 & 2033
- Figure 27: Middle East & Africa US Advanced Composites Industry Revenue Share (%), by Productino Type 2025 & 2033
- Figure 28: Middle East & Africa US Advanced Composites Industry Revenue (billion), by Material Type 2025 & 2033
- Figure 29: Middle East & Africa US Advanced Composites Industry Revenue Share (%), by Material Type 2025 & 2033
- Figure 30: Middle East & Africa US Advanced Composites Industry Revenue (billion), by Application Type 2025 & 2033
- Figure 31: Middle East & Africa US Advanced Composites Industry Revenue Share (%), by Application Type 2025 & 2033
- Figure 32: Middle East & Africa US Advanced Composites Industry Revenue (billion), by Country 2025 & 2033
- Figure 33: Middle East & Africa US Advanced Composites Industry Revenue Share (%), by Country 2025 & 2033
- Figure 34: Asia Pacific US Advanced Composites Industry Revenue (billion), by Productino Type 2025 & 2033
- Figure 35: Asia Pacific US Advanced Composites Industry Revenue Share (%), by Productino Type 2025 & 2033
- Figure 36: Asia Pacific US Advanced Composites Industry Revenue (billion), by Material Type 2025 & 2033
- Figure 37: Asia Pacific US Advanced Composites Industry Revenue Share (%), by Material Type 2025 & 2033
- Figure 38: Asia Pacific US Advanced Composites Industry Revenue (billion), by Application Type 2025 & 2033
- Figure 39: Asia Pacific US Advanced Composites Industry Revenue Share (%), by Application Type 2025 & 2033
- Figure 40: Asia Pacific US Advanced Composites Industry Revenue (billion), by Country 2025 & 2033
- Figure 41: Asia Pacific US Advanced Composites Industry Revenue Share (%), by Country 2025 & 2033
List of Tables
- Table 1: Global US Advanced Composites Industry Revenue billion Forecast, by Productino Type 2020 & 2033
- Table 2: Global US Advanced Composites Industry Revenue billion Forecast, by Material Type 2020 & 2033
- Table 3: Global US Advanced Composites Industry Revenue billion Forecast, by Application Type 2020 & 2033
- Table 4: Global US Advanced Composites Industry Revenue billion Forecast, by Region 2020 & 2033
- Table 5: Global US Advanced Composites Industry Revenue billion Forecast, by Productino Type 2020 & 2033
- Table 6: Global US Advanced Composites Industry Revenue billion Forecast, by Material Type 2020 & 2033
- Table 7: Global US Advanced Composites Industry Revenue billion Forecast, by Application Type 2020 & 2033
- Table 8: Global US Advanced Composites Industry Revenue billion Forecast, by Country 2020 & 2033
- Table 9: United States US Advanced Composites Industry Revenue (billion) Forecast, by Application 2020 & 2033
- Table 10: Canada US Advanced Composites Industry Revenue (billion) Forecast, by Application 2020 & 2033
- Table 11: Mexico US Advanced Composites Industry Revenue (billion) Forecast, by Application 2020 & 2033
- Table 12: Global US Advanced Composites Industry Revenue billion Forecast, by Productino Type 2020 & 2033
- Table 13: Global US Advanced Composites Industry Revenue billion Forecast, by Material Type 2020 & 2033
- Table 14: Global US Advanced Composites Industry Revenue billion Forecast, by Application Type 2020 & 2033
- Table 15: Global US Advanced Composites Industry Revenue billion Forecast, by Country 2020 & 2033
- Table 16: Brazil US Advanced Composites Industry Revenue (billion) Forecast, by Application 2020 & 2033
- Table 17: Argentina US Advanced Composites Industry Revenue (billion) Forecast, by Application 2020 & 2033
- Table 18: Rest of South America US Advanced Composites Industry Revenue (billion) Forecast, by Application 2020 & 2033
- Table 19: Global US Advanced Composites Industry Revenue billion Forecast, by Productino Type 2020 & 2033
- Table 20: Global US Advanced Composites Industry Revenue billion Forecast, by Material Type 2020 & 2033
- Table 21: Global US Advanced Composites Industry Revenue billion Forecast, by Application Type 2020 & 2033
- Table 22: Global US Advanced Composites Industry Revenue billion Forecast, by Country 2020 & 2033
- Table 23: United Kingdom US Advanced Composites Industry Revenue (billion) Forecast, by Application 2020 & 2033
- Table 24: Germany US Advanced Composites Industry Revenue (billion) Forecast, by Application 2020 & 2033
- Table 25: France US Advanced Composites Industry Revenue (billion) Forecast, by Application 2020 & 2033
- Table 26: Italy US Advanced Composites Industry Revenue (billion) Forecast, by Application 2020 & 2033
- Table 27: Spain US Advanced Composites Industry Revenue (billion) Forecast, by Application 2020 & 2033
- Table 28: Russia US Advanced Composites Industry Revenue (billion) Forecast, by Application 2020 & 2033
- Table 29: Benelux US Advanced Composites Industry Revenue (billion) Forecast, by Application 2020 & 2033
- Table 30: Nordics US Advanced Composites Industry Revenue (billion) Forecast, by Application 2020 & 2033
- Table 31: Rest of Europe US Advanced Composites Industry Revenue (billion) Forecast, by Application 2020 & 2033
- Table 32: Global US Advanced Composites Industry Revenue billion Forecast, by Productino Type 2020 & 2033
- Table 33: Global US Advanced Composites Industry Revenue billion Forecast, by Material Type 2020 & 2033
- Table 34: Global US Advanced Composites Industry Revenue billion Forecast, by Application Type 2020 & 2033
- Table 35: Global US Advanced Composites Industry Revenue billion Forecast, by Country 2020 & 2033
- Table 36: Turkey US Advanced Composites Industry Revenue (billion) Forecast, by Application 2020 & 2033
- Table 37: Israel US Advanced Composites Industry Revenue (billion) Forecast, by Application 2020 & 2033
- Table 38: GCC US Advanced Composites Industry Revenue (billion) Forecast, by Application 2020 & 2033
- Table 39: North Africa US Advanced Composites Industry Revenue (billion) Forecast, by Application 2020 & 2033
- Table 40: South Africa US Advanced Composites Industry Revenue (billion) Forecast, by Application 2020 & 2033
- Table 41: Rest of Middle East & Africa US Advanced Composites Industry Revenue (billion) Forecast, by Application 2020 & 2033
- Table 42: Global US Advanced Composites Industry Revenue billion Forecast, by Productino Type 2020 & 2033
- Table 43: Global US Advanced Composites Industry Revenue billion Forecast, by Material Type 2020 & 2033
- Table 44: Global US Advanced Composites Industry Revenue billion Forecast, by Application Type 2020 & 2033
- Table 45: Global US Advanced Composites Industry Revenue billion Forecast, by Country 2020 & 2033
- Table 46: China US Advanced Composites Industry Revenue (billion) Forecast, by Application 2020 & 2033
- Table 47: India US Advanced Composites Industry Revenue (billion) Forecast, by Application 2020 & 2033
- Table 48: Japan US Advanced Composites Industry Revenue (billion) Forecast, by Application 2020 & 2033
- Table 49: South Korea US Advanced Composites Industry Revenue (billion) Forecast, by Application 2020 & 2033
- Table 50: ASEAN US Advanced Composites Industry Revenue (billion) Forecast, by Application 2020 & 2033
- Table 51: Oceania US Advanced Composites Industry Revenue (billion) Forecast, by Application 2020 & 2033
- Table 52: Rest of Asia Pacific US Advanced Composites Industry Revenue (billion) Forecast, by Application 2020 & 2033
Frequently Asked Questions
1. What is the projected Compound Annual Growth Rate (CAGR) of the US Advanced Composites Industry?
The projected CAGR is approximately 8.9%.
2. Which companies are prominent players in the US Advanced Composites Industry?
Key companies in the market include Nippo Sheet Glass Co Ltd, 3B Fiberglass, Teijin Limite, BASF, Toray Industries Inc, General Motors Company, Base Group, Cytec Industries Inc, BMW, Delphi Auto, SGL Group.
3. What are the main segments of the US Advanced Composites Industry?
The market segments include Productino Type, Material Type, Application Type.
4. Can you provide details about the market size?
The market size is estimated to be USD 52.4 billion as of 2022.
5. What are some drivers contributing to market growth?
4.; Increasing demand from automobile industry4.; Increased focus on precision products.
6. What are the notable trends driving market growth?
Growing Demand for Lightweight Materials.
7. Are there any restraints impacting market growth?
4.; The cost of production and transportation4.; Regulations and quality standards.
8. Can you provide examples of recent developments in the market?
N/A
9. What pricing options are available for accessing the report?
Pricing options include single-user, multi-user, and enterprise licenses priced at USD 3800, USD 4500, and USD 5800 respectively.
10. Is the market size provided in terms of value or volume?
The market size is provided in terms of value, measured in billion.
11. Are there any specific market keywords associated with the report?
Yes, the market keyword associated with the report is "US Advanced Composites Industry," which aids in identifying and referencing the specific market segment covered.
12. How do I determine which pricing option suits my needs best?
The pricing options vary based on user requirements and access needs. Individual users may opt for single-user licenses, while businesses requiring broader access may choose multi-user or enterprise licenses for cost-effective access to the report.
13. Are there any additional resources or data provided in the US Advanced Composites Industry report?
While the report offers comprehensive insights, it's advisable to review the specific contents or supplementary materials provided to ascertain if additional resources or data are available.
14. How can I stay updated on further developments or reports in the US Advanced Composites Industry?
To stay informed about further developments, trends, and reports in the US Advanced Composites Industry, consider subscribing to industry newsletters, following relevant companies and organizations, or regularly checking reputable industry news sources and publications.
Methodology
Step 1 - Identification of Relevant Samples Size from Population Database


Step 2 - Approaches for Defining Global Market Size (Value, Volume* & Price*)

Note*: In applicable scenarios
Step 3 - Data Sources
Primary Research
- Web Analytics
- Survey Reports
- Research Institute
- Latest Research Reports
- Opinion Leaders
Secondary Research
- Annual Reports
- White Paper
- Latest Press Release
- Industry Association
- Paid Database
- Investor Presentations

Step 4 - Data Triangulation
Involves using different sources of information in order to increase the validity of a study
These sources are likely to be stakeholders in a program - participants, other researchers, program staff, other community members, and so on.
Then we put all data in single framework & apply various statistical tools to find out the dynamic on the market.
During the analysis stage, feedback from the stakeholder groups would be compared to determine areas of agreement as well as areas of divergence