

Key Insights
The global reach stacker market is projected to reach an estimated $3.2 billion by 2025, expanding at a Compound Annual Growth Rate (CAGR) of 6.9% through 2033. This significant growth is driven by escalating global trade volumes, increasing demand for efficient container handling in major shipping hubs, and port infrastructure expansion, particularly in emerging economies. The modernization of material handling equipment in industrial sectors and the rise of e-commerce, necessitating streamlined logistics and the handling of larger vessels, further amplify market demand. Technological advancements, including IoT integration for fleet management and development of fuel-efficient powertrains, also contribute to market dynamism. Key applications include sea ports, with a growing preference for medium and high tonnage capacity stackers. The evolution towards hybrid powertrains is also gaining traction due to tightening environmental regulations and the pursuit of operational efficiency.
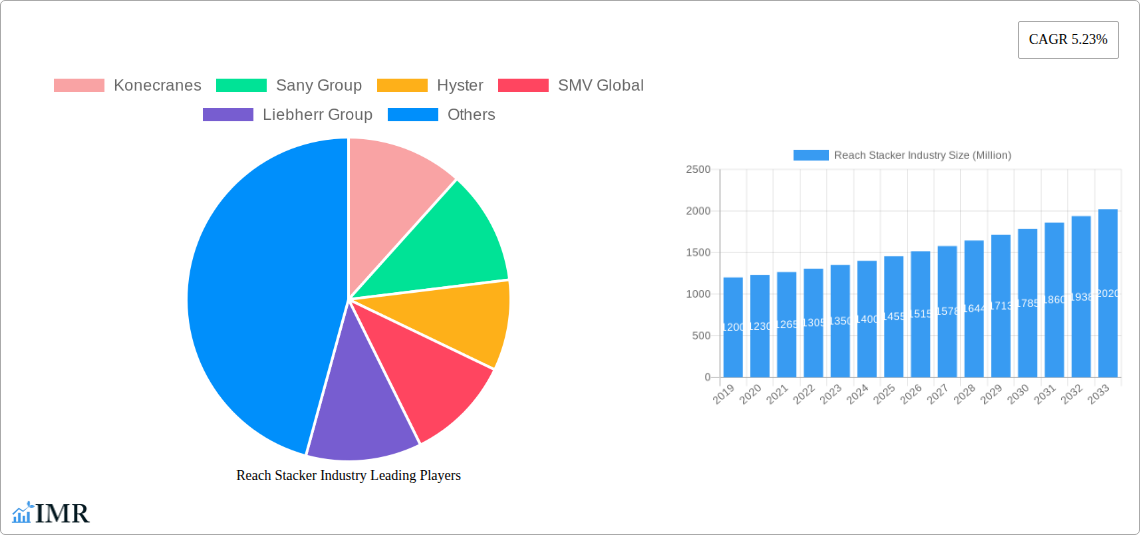
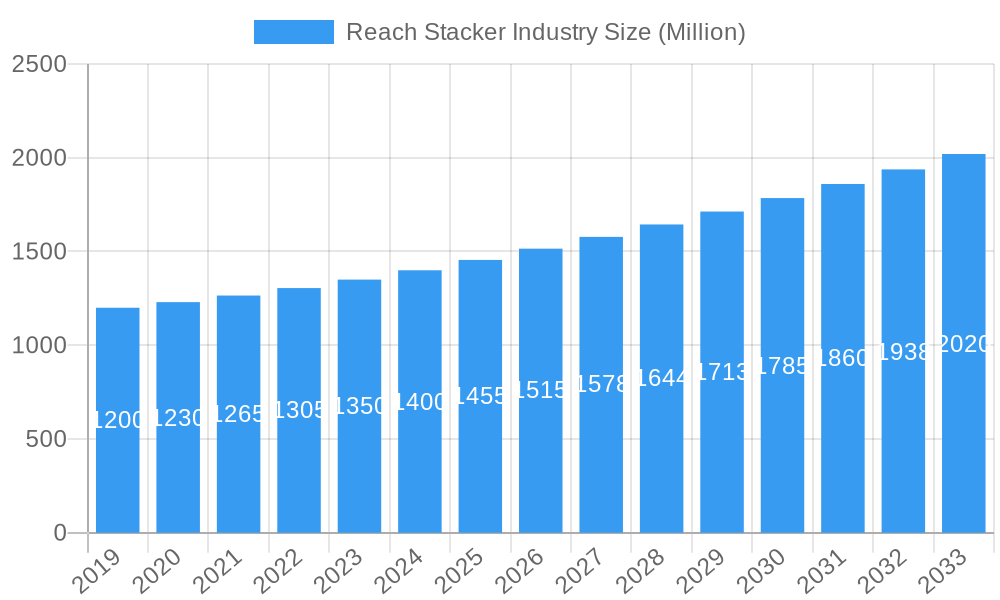
Reach Stacker Industry Market Size (In Billion)
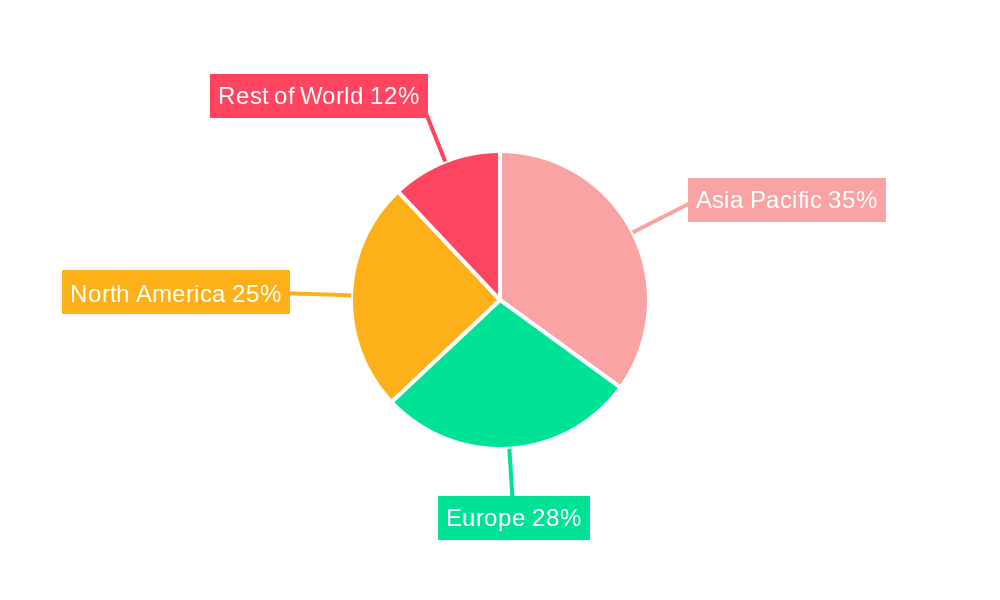
Emerging trends such as the adoption of electric and hybrid reach stackers, driven by sustainability initiatives and cost reduction, are shaping the market. Automation and advanced driver-assistance systems are also emerging as key differentiators, enhancing safety and productivity. However, high initial investment costs and fluctuating economic conditions may present adoption challenges. Geographically, Asia Pacific, led by China, is expected to dominate market growth due to its extensive port network and manufacturing capabilities. North America and Europe will remain significant markets, driven by infrastructure upgrades and technological innovation. Leading players like Konecranes, Sany Group, and Kalmar Group are at the forefront, investing in research and development to meet evolving industry needs.
Reach Stacker Industry Company Market Share
Global Reach Stacker Market Analysis: Trends, Forecasts, and Strategic Opportunities
This comprehensive report provides an in-depth analysis of the global reach stacker industry, a critical element in modern logistics and port operations. Covering the historical period (2019-2024), the base year (2025), and an extensive forecast period (2025-2033), this analysis utilizes the latest market intelligence to deliver actionable insights. It meticulously examines market dynamics, growth trends, dominant regions, and key segments. With a focus on technological advancements, drivers, barriers, challenges, and emerging opportunities, this report serves as an essential guide to the evolving reach stacker solutions landscape. Coverage includes the product landscape, innovations, applications, key market players, notable milestones, and an in-depth market outlook to equip stakeholders with the foresight needed to capitalize on future growth. This report is vital for manufacturers, suppliers, port authorities, logistics providers, and investors seeking to understand and strategically influence the reach stacker market size, CAGR, and future direction.
Reach Stacker Industry Market Dynamics & Structure
The global reach stacker industry is characterized by a moderately concentrated market structure, with a few leading global players dominating the landscape. Innovation is primarily driven by the relentless pursuit of enhanced operational efficiency, reduced emissions, and improved safety features, fueled by advancements in hybrid powertrain technology and automation. Stringent regulatory frameworks concerning environmental impact and workplace safety are increasingly influencing product development and adoption rates. Competitive product substitutes, such as heavy-duty forklifts and specialized terminal tractors, exist but often lack the versatility and high-lift capabilities of reach stackers. End-user demographics are evolving, with a growing demand from expanding sea ports and large-scale industrial facilities requiring efficient container handling solutions. Mergers and acquisitions (M&A) remain a significant trend, as established companies aim to expand their product portfolios, geographic reach, and technological capabilities. The base year 2025 showcases a dynamic interplay between established players and emerging innovators, with ongoing efforts to optimize the supply chain for low, medium, and high tonnage requirements.
- Market Concentration: Dominated by a few key global manufacturers, with strategic partnerships and regional presence playing a crucial role.
- Technological Innovation Drivers: Focus on electrification, automation, predictive maintenance, and operator comfort.
- Regulatory Frameworks: Increasingly stringent environmental regulations (e.g., emissions standards) and safety certifications influencing design and manufacturing.
- Competitive Product Substitutes: Heavy-duty forklifts, straddle carriers, and terminal tractors; their market share is influenced by specific application needs and operational costs.
- End-User Demographics: Primarily sea ports, container terminals, industrial warehouses, and intermodal freight yards.
- M&A Trends: Driven by consolidation, technology acquisition, and market expansion strategies.
Reach Stacker Industry Growth Trends & Insights
The reach stacker industry is poised for substantial growth, driven by the escalating volume of global trade and the ever-increasing demand for efficient container handling solutions. The market size is projected to witness a significant expansion from its historical figures, with a robust Compound Annual Growth Rate (CAGR) anticipated over the forecast period of 2025–2033. This growth trajectory is underpinned by several key trends. Firstly, the rapid development of sea ports worldwide, particularly in emerging economies, is creating a substantial demand for advanced reach stackers capable of handling larger vessel sizes and higher container throughput. Secondly, the increasing adoption of automation and digitalization within port operations is leading to a demand for smarter, more connected reach stacker fleets, incorporating features like GPS tracking, fleet management software, and remote diagnostics.
Furthermore, the growing emphasis on sustainability is accelerating the adoption of hybrid and electric powertrain types, aligning with global decarbonization efforts and reducing operational costs for end-users. This shift is not only driven by regulatory pressures but also by a proactive approach from industry leaders to offer environmentally friendly solutions. Consumer behavior is shifting towards seeking integrated solutions that offer not just the machinery but also comprehensive after-sales support, maintenance services, and financing options. Market penetration of advanced features and higher tonnage capacity machines is expected to increase as ports and industrial facilities invest in modernizing their infrastructure to cope with future demands. The reach stacker market size in 2025 is estimated to be xx million units, with a projected growth to xx million units by 2033. The CAGR is expected to be xx%. These figures reflect a dynamic market responding to global economic trends and technological advancements, ensuring that the reach stacker industry remains a vital and evolving sector within global logistics.
Dominant Regions, Countries, or Segments in Reach Stacker Industry
The global reach stacker industry is experiencing dynamic growth, with specific regions, countries, and application segments acting as key growth engines. Among the applications, Sea Ports stand out as the most dominant segment, accounting for a significant portion of the global reach stacker market share. This dominance is attributed to the sheer volume of containers handled at major international ports, the increasing size of container vessels, and the continuous need for efficient loading and unloading operations. The expansion and modernization of port infrastructure across Asia-Pacific, Europe, and North America are continuously fueling the demand for high-performance reach stackers.
Within the tonnage segments, High Tonnage reach stackers are witnessing substantial growth, driven by the evolution of maritime trade towards larger vessels and the need to handle heavier loads more efficiently. However, Medium Tonnage reach stackers remain crucial for a wide array of operations, offering a balance of capacity and maneuverability for various port and industrial applications. The Power Train Type segment is undergoing a significant transformation. While IC Engine powered reach stackers have historically dominated, the market is witnessing a rapid rise in the adoption of Hybrid powertrain solutions. This shift is propelled by environmental regulations, the desire to reduce operational costs through fuel efficiency, and the growing corporate commitment to sustainability. Countries with extensive coastlines and major shipping hubs, such as China, the United States, Germany, and Singapore, are leading the adoption of advanced reach stacker technologies. Economic policies promoting trade, infrastructure development initiatives, and the presence of major port operators are critical drivers of market growth in these dominant regions. The growth potential in these areas remains exceptionally high, supported by ongoing investments in port expansion and technological upgrades.
- Dominant Application: Sea Ports - driving demand due to high container throughput and large vessel capacities.
- Key Tonnage Segments: High Tonnage for super-large vessels, Medium Tonnage for versatile applications.
- Evolving Power Train Type: Shift from IC Engine to Hybrid for sustainability and cost-efficiency.
- Leading Countries: China, USA, Germany, Singapore - due to extensive port infrastructure and trade volumes.
- Key Drivers: Port infrastructure development, economic policies favoring trade, technological advancements, and environmental regulations.
Reach Stacker Industry Product Landscape
The reach stacker industry is characterized by a constant stream of product innovations aimed at enhancing operational efficiency, safety, and sustainability. Modern reach stackers are engineered with advanced hydraulic systems, optimized chassis designs, and sophisticated control systems that deliver precise handling and reduced cycle times. Manufacturers are increasingly integrating intelligent features, such as automated boom positioning, load weighing systems, and operator assistance technologies, to improve productivity and minimize human error. Applications span across major sea ports, bustling industrial facilities, and specialized logistics hubs, where reach stackers are indispensable for moving containers of low, medium, and high tonnage. The transition towards more eco-friendly operations is evident in the growing availability of hybrid powertrain options alongside traditional IC Engine models, offering improved fuel economy and reduced emissions. Unique selling propositions often revolve around lifting capacities, stacking heights, fuel efficiency, and advanced telematics for fleet management.
Key Drivers, Barriers & Challenges in Reach Stacker Industry
The reach stacker industry is propelled by several key drivers. The escalating volume of global trade necessitates efficient container handling, a primary role for reach stackers. Technological advancements in automation and electrification offer improved productivity and sustainability, attracting significant investment. Growing investments in port infrastructure development worldwide, particularly in emerging economies, directly correlate with increased demand for these machines. Furthermore, the drive for operational cost reduction and enhanced safety standards across logistics operations also fuels market growth.
However, the industry faces notable barriers and challenges. High upfront capital investment for advanced reach stacker models can be a deterrent for smaller operators. Volatile raw material prices can impact manufacturing costs and profit margins. Stringent emissions regulations, while a driver for hybrid adoption, can also pose compliance challenges for manufacturers of traditional IC Engine models. Supply chain disruptions, as witnessed in recent years, can lead to production delays and increased lead times. Intense competition from established global players and the emergence of regional manufacturers also present competitive pressures.
Emerging Opportunities in Reach Stacker Industry
Emerging opportunities in the reach stacker industry are diverse and promising. The increasing adoption of smart port technologies presents a significant avenue for growth, with demand for connected and automated reach stackers that can integrate seamlessly with port management systems. The development and deployment of fully electric reach stackers, especially in urban port environments and industrial zones with strict emission controls, represent a substantial untapped market. Furthermore, the expansion of intermodal transportation hubs and the growth of e-commerce logistics are creating new application niches for specialized reach stacker designs. Offering comprehensive lifecycle services, including predictive maintenance, operator training, and fleet management solutions, presents a growing opportunity for value-added revenue streams.
Growth Accelerators in the Reach Stacker Industry Industry
Several factors are acting as significant growth accelerators for the reach stacker industry. The ongoing global trend of increasing containerized trade volumes is a fundamental driver, necessitating greater efficiency in port and terminal operations. Technological breakthroughs, particularly in battery technology for electric powertrains and the development of advanced automation and AI-driven features, are enhancing the performance and appeal of reach stackers. Strategic partnerships between reach stacker manufacturers and port operators, as well as logistics companies, are crucial for co-developing tailored solutions and securing long-term contracts. Market expansion into developing economies with rapidly growing trade infrastructures also represents a substantial growth accelerator, as these regions invest heavily in modernizing their logistics capabilities.
Key Players Shaping the Reach Stacker Industry Market
- Konecranes
- Sany Group
- Hyster
- SMV Global
- Liebherr Group
- Toyota
- Kalmar Group
- CVS Ferrari S P A
- Terex
Notable Milestones in Reach Stacker Industry Sector
- 2019: Introduction of advanced hybrid reach stacker models by leading manufacturers, focusing on fuel efficiency and reduced emissions.
- 2020: Increased investment in automated reach stacker solutions for enhanced port efficiency and safety amidst labor challenges.
- 2021: Significant supply chain disruptions impacting production and delivery times globally, highlighting the need for resilient manufacturing strategies.
- 2022: Launch of new generation reach stackers with enhanced operator comfort features and improved telematics for remote monitoring and diagnostics.
- 2023: Growing interest and pilot projects for fully electric reach stackers in select port environments.
- 2024: Strategic acquisitions and partnerships aimed at expanding product portfolios and market reach within the reach stacker sector.
In-Depth Reach Stacker Industry Market Outlook
The outlook for the reach stacker industry remains exceptionally positive, driven by sustained global trade growth and the imperative for efficient, sustainable logistics operations. Growth accelerators such as advancements in hybrid and electric powertrain technologies will continue to shape the market, meeting stringent environmental regulations and reducing operational expenditures. Strategic collaborations between manufacturers and end-users will foster the development of bespoke solutions tailored to evolving port and industrial demands. Continued investment in infrastructure, particularly in emerging markets, will unlock significant potential for market expansion. The industry is set to witness further integration of digital technologies, leading to smarter, more connected fleets that optimize every aspect of container handling. This forward momentum ensures a robust future for the reach stacker market, offering substantial opportunities for innovation and growth.
Reach Stacker Industry Segmentation
-
1. Application
- 1.1. Sea Ports
- 1.2. Industrial
-
2. Tonnage
- 2.1. Low
- 2.2. Medium
- 2.3. High
-
3. Power Train Type
- 3.1. IC Engine
- 3.2. Hybrid
Reach Stacker Industry Segmentation By Geography
- 1. United States
- 2. Canada
- 3. Rest of North America
- 4. Germany
- 5. United Kingdom
- 6. France
- 7. Italy
- 8. Rest of Europe
- 9. China
- 10. India
- 11. Japan
- 12. South Korea
- 13. Rest of Asia Pacific
- 14. Mexico
- 15. Brazil
- 16. United Arab Emirates
- 17. Other Countries
Reach Stacker Industry Regional Market Share
Geographic Coverage of Reach Stacker Industry
Reach Stacker Industry REPORT HIGHLIGHTS
| Aspects | Details |
|---|---|
| Study Period | 2020-2034 |
| Base Year | 2025 |
| Estimated Year | 2026 |
| Forecast Period | 2026-2034 |
| Historical Period | 2020-2025 |
| Growth Rate | CAGR of 6.9% from 2020-2034 |
| Segmentation |
|
Table of Contents
- 1. Introduction
- 1.1. Research Scope
- 1.2. Market Segmentation
- 1.3. Research Objective
- 1.4. Definitions and Assumptions
- 2. Executive Summary
- 2.1. Market Snapshot
- 3. Market Dynamics
- 3.1. Market Drivers
- 3.2. Market Restrains
- 3.3. Market Trends
- 3.4. Market Opportunities
- 4. Market Factor Analysis
- 4.1. Porters Five Forces
- 4.1.1. Bargaining Power of Suppliers
- 4.1.2. Bargaining Power of Buyers
- 4.1.3. Threat of New Entrants
- 4.1.4. Threat of Substitutes
- 4.1.5. Competitive Rivalry
- 4.2. PESTEL analysis
- 4.3. BCG Analysis
- 4.3.1. Stars (High Growth, High Market Share)
- 4.3.2. Cash Cows (Low Growth, High Market Share)
- 4.3.3. Question Mark (High Growth, Low Market Share)
- 4.3.4. Dogs (Low Growth, Low Market Share)
- 4.4. Ansoff Matrix Analysis
- 4.5. Supply Chain Analysis
- 4.6. Regulatory Landscape
- 4.7. Current Market Potential and Opportunity Assessment (TAM–SAM–SOM Framework)
- 4.8. IMR Analyst Note
- 4.1. Porters Five Forces
- 5. Market Analysis, Insights and Forecast 2021-2033
- 5.1. Market Analysis, Insights and Forecast - by Application
- 5.1.1. Sea Ports
- 5.1.2. Industrial
- 5.2. Market Analysis, Insights and Forecast - by Tonnage
- 5.2.1. Low
- 5.2.2. Medium
- 5.2.3. High
- 5.3. Market Analysis, Insights and Forecast - by Power Train Type
- 5.3.1. IC Engine
- 5.3.2. Hybrid
- 5.4. Market Analysis, Insights and Forecast - by Region
- 5.4.1. United States
- 5.4.2. Canada
- 5.4.3. Rest of North America
- 5.4.4. Germany
- 5.4.5. United Kingdom
- 5.4.6. France
- 5.4.7. Italy
- 5.4.8. Rest of Europe
- 5.4.9. China
- 5.4.10. India
- 5.4.11. Japan
- 5.4.12. South Korea
- 5.4.13. Rest of Asia Pacific
- 5.4.14. Mexico
- 5.4.15. Brazil
- 5.4.16. United Arab Emirates
- 5.4.17. Other Countries
- 5.1. Market Analysis, Insights and Forecast - by Application
- 6. Global Reach Stacker Industry Analysis, Insights and Forecast, 2021-2033
- 6.1. Market Analysis, Insights and Forecast - by Application
- 6.1.1. Sea Ports
- 6.1.2. Industrial
- 6.2. Market Analysis, Insights and Forecast - by Tonnage
- 6.2.1. Low
- 6.2.2. Medium
- 6.2.3. High
- 6.3. Market Analysis, Insights and Forecast - by Power Train Type
- 6.3.1. IC Engine
- 6.3.2. Hybrid
- 6.1. Market Analysis, Insights and Forecast - by Application
- 7. United States Reach Stacker Industry Analysis, Insights and Forecast, 2020-2032
- 7.1. Market Analysis, Insights and Forecast - by Application
- 7.1.1. Sea Ports
- 7.1.2. Industrial
- 7.2. Market Analysis, Insights and Forecast - by Tonnage
- 7.2.1. Low
- 7.2.2. Medium
- 7.2.3. High
- 7.3. Market Analysis, Insights and Forecast - by Power Train Type
- 7.3.1. IC Engine
- 7.3.2. Hybrid
- 7.1. Market Analysis, Insights and Forecast - by Application
- 8. Canada Reach Stacker Industry Analysis, Insights and Forecast, 2020-2032
- 8.1. Market Analysis, Insights and Forecast - by Application
- 8.1.1. Sea Ports
- 8.1.2. Industrial
- 8.2. Market Analysis, Insights and Forecast - by Tonnage
- 8.2.1. Low
- 8.2.2. Medium
- 8.2.3. High
- 8.3. Market Analysis, Insights and Forecast - by Power Train Type
- 8.3.1. IC Engine
- 8.3.2. Hybrid
- 8.1. Market Analysis, Insights and Forecast - by Application
- 9. Rest of North America Reach Stacker Industry Analysis, Insights and Forecast, 2020-2032
- 9.1. Market Analysis, Insights and Forecast - by Application
- 9.1.1. Sea Ports
- 9.1.2. Industrial
- 9.2. Market Analysis, Insights and Forecast - by Tonnage
- 9.2.1. Low
- 9.2.2. Medium
- 9.2.3. High
- 9.3. Market Analysis, Insights and Forecast - by Power Train Type
- 9.3.1. IC Engine
- 9.3.2. Hybrid
- 9.1. Market Analysis, Insights and Forecast - by Application
- 10. Germany Reach Stacker Industry Analysis, Insights and Forecast, 2020-2032
- 10.1. Market Analysis, Insights and Forecast - by Application
- 10.1.1. Sea Ports
- 10.1.2. Industrial
- 10.2. Market Analysis, Insights and Forecast - by Tonnage
- 10.2.1. Low
- 10.2.2. Medium
- 10.2.3. High
- 10.3. Market Analysis, Insights and Forecast - by Power Train Type
- 10.3.1. IC Engine
- 10.3.2. Hybrid
- 10.1. Market Analysis, Insights and Forecast - by Application
- 11. United Kingdom Reach Stacker Industry Analysis, Insights and Forecast, 2020-2032
- 11.1. Market Analysis, Insights and Forecast - by Application
- 11.1.1. Sea Ports
- 11.1.2. Industrial
- 11.2. Market Analysis, Insights and Forecast - by Tonnage
- 11.2.1. Low
- 11.2.2. Medium
- 11.2.3. High
- 11.3. Market Analysis, Insights and Forecast - by Power Train Type
- 11.3.1. IC Engine
- 11.3.2. Hybrid
- 11.1. Market Analysis, Insights and Forecast - by Application
- 12. France Reach Stacker Industry Analysis, Insights and Forecast, 2020-2032
- 12.1. Market Analysis, Insights and Forecast - by Application
- 12.1.1. Sea Ports
- 12.1.2. Industrial
- 12.2. Market Analysis, Insights and Forecast - by Tonnage
- 12.2.1. Low
- 12.2.2. Medium
- 12.2.3. High
- 12.3. Market Analysis, Insights and Forecast - by Power Train Type
- 12.3.1. IC Engine
- 12.3.2. Hybrid
- 12.1. Market Analysis, Insights and Forecast - by Application
- 13. Italy Reach Stacker Industry Analysis, Insights and Forecast, 2020-2032
- 13.1. Market Analysis, Insights and Forecast - by Application
- 13.1.1. Sea Ports
- 13.1.2. Industrial
- 13.2. Market Analysis, Insights and Forecast - by Tonnage
- 13.2.1. Low
- 13.2.2. Medium
- 13.2.3. High
- 13.3. Market Analysis, Insights and Forecast - by Power Train Type
- 13.3.1. IC Engine
- 13.3.2. Hybrid
- 13.1. Market Analysis, Insights and Forecast - by Application
- 14. Rest of Europe Reach Stacker Industry Analysis, Insights and Forecast, 2020-2032
- 14.1. Market Analysis, Insights and Forecast - by Application
- 14.1.1. Sea Ports
- 14.1.2. Industrial
- 14.2. Market Analysis, Insights and Forecast - by Tonnage
- 14.2.1. Low
- 14.2.2. Medium
- 14.2.3. High
- 14.3. Market Analysis, Insights and Forecast - by Power Train Type
- 14.3.1. IC Engine
- 14.3.2. Hybrid
- 14.1. Market Analysis, Insights and Forecast - by Application
- 15. China Reach Stacker Industry Analysis, Insights and Forecast, 2020-2032
- 15.1. Market Analysis, Insights and Forecast - by Application
- 15.1.1. Sea Ports
- 15.1.2. Industrial
- 15.2. Market Analysis, Insights and Forecast - by Tonnage
- 15.2.1. Low
- 15.2.2. Medium
- 15.2.3. High
- 15.3. Market Analysis, Insights and Forecast - by Power Train Type
- 15.3.1. IC Engine
- 15.3.2. Hybrid
- 15.1. Market Analysis, Insights and Forecast - by Application
- 16. India Reach Stacker Industry Analysis, Insights and Forecast, 2020-2032
- 16.1. Market Analysis, Insights and Forecast - by Application
- 16.1.1. Sea Ports
- 16.1.2. Industrial
- 16.2. Market Analysis, Insights and Forecast - by Tonnage
- 16.2.1. Low
- 16.2.2. Medium
- 16.2.3. High
- 16.3. Market Analysis, Insights and Forecast - by Power Train Type
- 16.3.1. IC Engine
- 16.3.2. Hybrid
- 16.1. Market Analysis, Insights and Forecast - by Application
- 17. Japan Reach Stacker Industry Analysis, Insights and Forecast, 2020-2032
- 17.1. Market Analysis, Insights and Forecast - by Application
- 17.1.1. Sea Ports
- 17.1.2. Industrial
- 17.2. Market Analysis, Insights and Forecast - by Tonnage
- 17.2.1. Low
- 17.2.2. Medium
- 17.2.3. High
- 17.3. Market Analysis, Insights and Forecast - by Power Train Type
- 17.3.1. IC Engine
- 17.3.2. Hybrid
- 17.1. Market Analysis, Insights and Forecast - by Application
- 18. South Korea Reach Stacker Industry Analysis, Insights and Forecast, 2020-2032
- 18.1. Market Analysis, Insights and Forecast - by Application
- 18.1.1. Sea Ports
- 18.1.2. Industrial
- 18.2. Market Analysis, Insights and Forecast - by Tonnage
- 18.2.1. Low
- 18.2.2. Medium
- 18.2.3. High
- 18.3. Market Analysis, Insights and Forecast - by Power Train Type
- 18.3.1. IC Engine
- 18.3.2. Hybrid
- 18.1. Market Analysis, Insights and Forecast - by Application
- 19. Rest of Asia Pacific Reach Stacker Industry Analysis, Insights and Forecast, 2020-2032
- 19.1. Market Analysis, Insights and Forecast - by Application
- 19.1.1. Sea Ports
- 19.1.2. Industrial
- 19.2. Market Analysis, Insights and Forecast - by Tonnage
- 19.2.1. Low
- 19.2.2. Medium
- 19.2.3. High
- 19.3. Market Analysis, Insights and Forecast - by Power Train Type
- 19.3.1. IC Engine
- 19.3.2. Hybrid
- 19.1. Market Analysis, Insights and Forecast - by Application
- 20. Mexico Reach Stacker Industry Analysis, Insights and Forecast, 2020-2032
- 20.1. Market Analysis, Insights and Forecast - by Application
- 20.1.1. Sea Ports
- 20.1.2. Industrial
- 20.2. Market Analysis, Insights and Forecast - by Tonnage
- 20.2.1. Low
- 20.2.2. Medium
- 20.2.3. High
- 20.3. Market Analysis, Insights and Forecast - by Power Train Type
- 20.3.1. IC Engine
- 20.3.2. Hybrid
- 20.1. Market Analysis, Insights and Forecast - by Application
- 21. Brazil Reach Stacker Industry Analysis, Insights and Forecast, 2020-2032
- 21.1. Market Analysis, Insights and Forecast - by Application
- 21.1.1. Sea Ports
- 21.1.2. Industrial
- 21.2. Market Analysis, Insights and Forecast - by Tonnage
- 21.2.1. Low
- 21.2.2. Medium
- 21.2.3. High
- 21.3. Market Analysis, Insights and Forecast - by Power Train Type
- 21.3.1. IC Engine
- 21.3.2. Hybrid
- 21.1. Market Analysis, Insights and Forecast - by Application
- 22. United Arab Emirates Reach Stacker Industry Analysis, Insights and Forecast, 2020-2032
- 22.1. Market Analysis, Insights and Forecast - by Application
- 22.1.1. Sea Ports
- 22.1.2. Industrial
- 22.2. Market Analysis, Insights and Forecast - by Tonnage
- 22.2.1. Low
- 22.2.2. Medium
- 22.2.3. High
- 22.3. Market Analysis, Insights and Forecast - by Power Train Type
- 22.3.1. IC Engine
- 22.3.2. Hybrid
- 22.1. Market Analysis, Insights and Forecast - by Application
- 23. Other Countries Reach Stacker Industry Analysis, Insights and Forecast, 2020-2032
- 23.1. Market Analysis, Insights and Forecast - by Application
- 23.1.1. Sea Ports
- 23.1.2. Industrial
- 23.2. Market Analysis, Insights and Forecast - by Tonnage
- 23.2.1. Low
- 23.2.2. Medium
- 23.2.3. High
- 23.3. Market Analysis, Insights and Forecast - by Power Train Type
- 23.3.1. IC Engine
- 23.3.2. Hybrid
- 23.1. Market Analysis, Insights and Forecast - by Application
- 24. Competitive Analysis
- 24.1. Company Profiles
- 24.1.1 Konecranes
- 24.1.1.1. Company Overview
- 24.1.1.2. Products
- 24.1.1.3. Company Financials
- 24.1.1.4. SWOT Analysis
- 24.1.2 Sany Group
- 24.1.2.1. Company Overview
- 24.1.2.2. Products
- 24.1.2.3. Company Financials
- 24.1.2.4. SWOT Analysis
- 24.1.3 Hyster
- 24.1.3.1. Company Overview
- 24.1.3.2. Products
- 24.1.3.3. Company Financials
- 24.1.3.4. SWOT Analysis
- 24.1.4 SMV Global
- 24.1.4.1. Company Overview
- 24.1.4.2. Products
- 24.1.4.3. Company Financials
- 24.1.4.4. SWOT Analysis
- 24.1.5 Liebherr Group
- 24.1.5.1. Company Overview
- 24.1.5.2. Products
- 24.1.5.3. Company Financials
- 24.1.5.4. SWOT Analysis
- 24.1.6 Toyota*List Not Exhaustive
- 24.1.6.1. Company Overview
- 24.1.6.2. Products
- 24.1.6.3. Company Financials
- 24.1.6.4. SWOT Analysis
- 24.1.7 Kalmar Group
- 24.1.7.1. Company Overview
- 24.1.7.2. Products
- 24.1.7.3. Company Financials
- 24.1.7.4. SWOT Analysis
- 24.1.8 CVS Ferrari S P A
- 24.1.8.1. Company Overview
- 24.1.8.2. Products
- 24.1.8.3. Company Financials
- 24.1.8.4. SWOT Analysis
- 24.1.9 Terex
- 24.1.9.1. Company Overview
- 24.1.9.2. Products
- 24.1.9.3. Company Financials
- 24.1.9.4. SWOT Analysis
- 24.1.1 Konecranes
- 24.2. Market Entropy
- 24.2.1 Company's Key Areas Served
- 24.2.2 Recent Developments
- 24.3. Company Market Share Analysis 2025
- 24.3.1 Top 5 Companies Market Share Analysis
- 24.3.2 Top 3 Companies Market Share Analysis
- 24.4. List of Potential Customers
- 25. Research Methodology
List of Figures
- Figure 1: Global Reach Stacker Industry Revenue Breakdown (billion, %) by Region 2025 & 2033
- Figure 2: United States Reach Stacker Industry Revenue (billion), by Application 2025 & 2033
- Figure 3: United States Reach Stacker Industry Revenue Share (%), by Application 2025 & 2033
- Figure 4: United States Reach Stacker Industry Revenue (billion), by Tonnage 2025 & 2033
- Figure 5: United States Reach Stacker Industry Revenue Share (%), by Tonnage 2025 & 2033
- Figure 6: United States Reach Stacker Industry Revenue (billion), by Power Train Type 2025 & 2033
- Figure 7: United States Reach Stacker Industry Revenue Share (%), by Power Train Type 2025 & 2033
- Figure 8: United States Reach Stacker Industry Revenue (billion), by Country 2025 & 2033
- Figure 9: United States Reach Stacker Industry Revenue Share (%), by Country 2025 & 2033
- Figure 10: Canada Reach Stacker Industry Revenue (billion), by Application 2025 & 2033
- Figure 11: Canada Reach Stacker Industry Revenue Share (%), by Application 2025 & 2033
- Figure 12: Canada Reach Stacker Industry Revenue (billion), by Tonnage 2025 & 2033
- Figure 13: Canada Reach Stacker Industry Revenue Share (%), by Tonnage 2025 & 2033
- Figure 14: Canada Reach Stacker Industry Revenue (billion), by Power Train Type 2025 & 2033
- Figure 15: Canada Reach Stacker Industry Revenue Share (%), by Power Train Type 2025 & 2033
- Figure 16: Canada Reach Stacker Industry Revenue (billion), by Country 2025 & 2033
- Figure 17: Canada Reach Stacker Industry Revenue Share (%), by Country 2025 & 2033
- Figure 18: Rest of North America Reach Stacker Industry Revenue (billion), by Application 2025 & 2033
- Figure 19: Rest of North America Reach Stacker Industry Revenue Share (%), by Application 2025 & 2033
- Figure 20: Rest of North America Reach Stacker Industry Revenue (billion), by Tonnage 2025 & 2033
- Figure 21: Rest of North America Reach Stacker Industry Revenue Share (%), by Tonnage 2025 & 2033
- Figure 22: Rest of North America Reach Stacker Industry Revenue (billion), by Power Train Type 2025 & 2033
- Figure 23: Rest of North America Reach Stacker Industry Revenue Share (%), by Power Train Type 2025 & 2033
- Figure 24: Rest of North America Reach Stacker Industry Revenue (billion), by Country 2025 & 2033
- Figure 25: Rest of North America Reach Stacker Industry Revenue Share (%), by Country 2025 & 2033
- Figure 26: Germany Reach Stacker Industry Revenue (billion), by Application 2025 & 2033
- Figure 27: Germany Reach Stacker Industry Revenue Share (%), by Application 2025 & 2033
- Figure 28: Germany Reach Stacker Industry Revenue (billion), by Tonnage 2025 & 2033
- Figure 29: Germany Reach Stacker Industry Revenue Share (%), by Tonnage 2025 & 2033
- Figure 30: Germany Reach Stacker Industry Revenue (billion), by Power Train Type 2025 & 2033
- Figure 31: Germany Reach Stacker Industry Revenue Share (%), by Power Train Type 2025 & 2033
- Figure 32: Germany Reach Stacker Industry Revenue (billion), by Country 2025 & 2033
- Figure 33: Germany Reach Stacker Industry Revenue Share (%), by Country 2025 & 2033
- Figure 34: United Kingdom Reach Stacker Industry Revenue (billion), by Application 2025 & 2033
- Figure 35: United Kingdom Reach Stacker Industry Revenue Share (%), by Application 2025 & 2033
- Figure 36: United Kingdom Reach Stacker Industry Revenue (billion), by Tonnage 2025 & 2033
- Figure 37: United Kingdom Reach Stacker Industry Revenue Share (%), by Tonnage 2025 & 2033
- Figure 38: United Kingdom Reach Stacker Industry Revenue (billion), by Power Train Type 2025 & 2033
- Figure 39: United Kingdom Reach Stacker Industry Revenue Share (%), by Power Train Type 2025 & 2033
- Figure 40: United Kingdom Reach Stacker Industry Revenue (billion), by Country 2025 & 2033
- Figure 41: United Kingdom Reach Stacker Industry Revenue Share (%), by Country 2025 & 2033
- Figure 42: France Reach Stacker Industry Revenue (billion), by Application 2025 & 2033
- Figure 43: France Reach Stacker Industry Revenue Share (%), by Application 2025 & 2033
- Figure 44: France Reach Stacker Industry Revenue (billion), by Tonnage 2025 & 2033
- Figure 45: France Reach Stacker Industry Revenue Share (%), by Tonnage 2025 & 2033
- Figure 46: France Reach Stacker Industry Revenue (billion), by Power Train Type 2025 & 2033
- Figure 47: France Reach Stacker Industry Revenue Share (%), by Power Train Type 2025 & 2033
- Figure 48: France Reach Stacker Industry Revenue (billion), by Country 2025 & 2033
- Figure 49: France Reach Stacker Industry Revenue Share (%), by Country 2025 & 2033
- Figure 50: Italy Reach Stacker Industry Revenue (billion), by Application 2025 & 2033
- Figure 51: Italy Reach Stacker Industry Revenue Share (%), by Application 2025 & 2033
- Figure 52: Italy Reach Stacker Industry Revenue (billion), by Tonnage 2025 & 2033
- Figure 53: Italy Reach Stacker Industry Revenue Share (%), by Tonnage 2025 & 2033
- Figure 54: Italy Reach Stacker Industry Revenue (billion), by Power Train Type 2025 & 2033
- Figure 55: Italy Reach Stacker Industry Revenue Share (%), by Power Train Type 2025 & 2033
- Figure 56: Italy Reach Stacker Industry Revenue (billion), by Country 2025 & 2033
- Figure 57: Italy Reach Stacker Industry Revenue Share (%), by Country 2025 & 2033
- Figure 58: Rest of Europe Reach Stacker Industry Revenue (billion), by Application 2025 & 2033
- Figure 59: Rest of Europe Reach Stacker Industry Revenue Share (%), by Application 2025 & 2033
- Figure 60: Rest of Europe Reach Stacker Industry Revenue (billion), by Tonnage 2025 & 2033
- Figure 61: Rest of Europe Reach Stacker Industry Revenue Share (%), by Tonnage 2025 & 2033
- Figure 62: Rest of Europe Reach Stacker Industry Revenue (billion), by Power Train Type 2025 & 2033
- Figure 63: Rest of Europe Reach Stacker Industry Revenue Share (%), by Power Train Type 2025 & 2033
- Figure 64: Rest of Europe Reach Stacker Industry Revenue (billion), by Country 2025 & 2033
- Figure 65: Rest of Europe Reach Stacker Industry Revenue Share (%), by Country 2025 & 2033
- Figure 66: China Reach Stacker Industry Revenue (billion), by Application 2025 & 2033
- Figure 67: China Reach Stacker Industry Revenue Share (%), by Application 2025 & 2033
- Figure 68: China Reach Stacker Industry Revenue (billion), by Tonnage 2025 & 2033
- Figure 69: China Reach Stacker Industry Revenue Share (%), by Tonnage 2025 & 2033
- Figure 70: China Reach Stacker Industry Revenue (billion), by Power Train Type 2025 & 2033
- Figure 71: China Reach Stacker Industry Revenue Share (%), by Power Train Type 2025 & 2033
- Figure 72: China Reach Stacker Industry Revenue (billion), by Country 2025 & 2033
- Figure 73: China Reach Stacker Industry Revenue Share (%), by Country 2025 & 2033
- Figure 74: India Reach Stacker Industry Revenue (billion), by Application 2025 & 2033
- Figure 75: India Reach Stacker Industry Revenue Share (%), by Application 2025 & 2033
- Figure 76: India Reach Stacker Industry Revenue (billion), by Tonnage 2025 & 2033
- Figure 77: India Reach Stacker Industry Revenue Share (%), by Tonnage 2025 & 2033
- Figure 78: India Reach Stacker Industry Revenue (billion), by Power Train Type 2025 & 2033
- Figure 79: India Reach Stacker Industry Revenue Share (%), by Power Train Type 2025 & 2033
- Figure 80: India Reach Stacker Industry Revenue (billion), by Country 2025 & 2033
- Figure 81: India Reach Stacker Industry Revenue Share (%), by Country 2025 & 2033
- Figure 82: Japan Reach Stacker Industry Revenue (billion), by Application 2025 & 2033
- Figure 83: Japan Reach Stacker Industry Revenue Share (%), by Application 2025 & 2033
- Figure 84: Japan Reach Stacker Industry Revenue (billion), by Tonnage 2025 & 2033
- Figure 85: Japan Reach Stacker Industry Revenue Share (%), by Tonnage 2025 & 2033
- Figure 86: Japan Reach Stacker Industry Revenue (billion), by Power Train Type 2025 & 2033
- Figure 87: Japan Reach Stacker Industry Revenue Share (%), by Power Train Type 2025 & 2033
- Figure 88: Japan Reach Stacker Industry Revenue (billion), by Country 2025 & 2033
- Figure 89: Japan Reach Stacker Industry Revenue Share (%), by Country 2025 & 2033
- Figure 90: South Korea Reach Stacker Industry Revenue (billion), by Application 2025 & 2033
- Figure 91: South Korea Reach Stacker Industry Revenue Share (%), by Application 2025 & 2033
- Figure 92: South Korea Reach Stacker Industry Revenue (billion), by Tonnage 2025 & 2033
- Figure 93: South Korea Reach Stacker Industry Revenue Share (%), by Tonnage 2025 & 2033
- Figure 94: South Korea Reach Stacker Industry Revenue (billion), by Power Train Type 2025 & 2033
- Figure 95: South Korea Reach Stacker Industry Revenue Share (%), by Power Train Type 2025 & 2033
- Figure 96: South Korea Reach Stacker Industry Revenue (billion), by Country 2025 & 2033
- Figure 97: South Korea Reach Stacker Industry Revenue Share (%), by Country 2025 & 2033
- Figure 98: Rest of Asia Pacific Reach Stacker Industry Revenue (billion), by Application 2025 & 2033
- Figure 99: Rest of Asia Pacific Reach Stacker Industry Revenue Share (%), by Application 2025 & 2033
- Figure 100: Rest of Asia Pacific Reach Stacker Industry Revenue (billion), by Tonnage 2025 & 2033
- Figure 101: Rest of Asia Pacific Reach Stacker Industry Revenue Share (%), by Tonnage 2025 & 2033
- Figure 102: Rest of Asia Pacific Reach Stacker Industry Revenue (billion), by Power Train Type 2025 & 2033
- Figure 103: Rest of Asia Pacific Reach Stacker Industry Revenue Share (%), by Power Train Type 2025 & 2033
- Figure 104: Rest of Asia Pacific Reach Stacker Industry Revenue (billion), by Country 2025 & 2033
- Figure 105: Rest of Asia Pacific Reach Stacker Industry Revenue Share (%), by Country 2025 & 2033
- Figure 106: Mexico Reach Stacker Industry Revenue (billion), by Application 2025 & 2033
- Figure 107: Mexico Reach Stacker Industry Revenue Share (%), by Application 2025 & 2033
- Figure 108: Mexico Reach Stacker Industry Revenue (billion), by Tonnage 2025 & 2033
- Figure 109: Mexico Reach Stacker Industry Revenue Share (%), by Tonnage 2025 & 2033
- Figure 110: Mexico Reach Stacker Industry Revenue (billion), by Power Train Type 2025 & 2033
- Figure 111: Mexico Reach Stacker Industry Revenue Share (%), by Power Train Type 2025 & 2033
- Figure 112: Mexico Reach Stacker Industry Revenue (billion), by Country 2025 & 2033
- Figure 113: Mexico Reach Stacker Industry Revenue Share (%), by Country 2025 & 2033
- Figure 114: Brazil Reach Stacker Industry Revenue (billion), by Application 2025 & 2033
- Figure 115: Brazil Reach Stacker Industry Revenue Share (%), by Application 2025 & 2033
- Figure 116: Brazil Reach Stacker Industry Revenue (billion), by Tonnage 2025 & 2033
- Figure 117: Brazil Reach Stacker Industry Revenue Share (%), by Tonnage 2025 & 2033
- Figure 118: Brazil Reach Stacker Industry Revenue (billion), by Power Train Type 2025 & 2033
- Figure 119: Brazil Reach Stacker Industry Revenue Share (%), by Power Train Type 2025 & 2033
- Figure 120: Brazil Reach Stacker Industry Revenue (billion), by Country 2025 & 2033
- Figure 121: Brazil Reach Stacker Industry Revenue Share (%), by Country 2025 & 2033
- Figure 122: United Arab Emirates Reach Stacker Industry Revenue (billion), by Application 2025 & 2033
- Figure 123: United Arab Emirates Reach Stacker Industry Revenue Share (%), by Application 2025 & 2033
- Figure 124: United Arab Emirates Reach Stacker Industry Revenue (billion), by Tonnage 2025 & 2033
- Figure 125: United Arab Emirates Reach Stacker Industry Revenue Share (%), by Tonnage 2025 & 2033
- Figure 126: United Arab Emirates Reach Stacker Industry Revenue (billion), by Power Train Type 2025 & 2033
- Figure 127: United Arab Emirates Reach Stacker Industry Revenue Share (%), by Power Train Type 2025 & 2033
- Figure 128: United Arab Emirates Reach Stacker Industry Revenue (billion), by Country 2025 & 2033
- Figure 129: United Arab Emirates Reach Stacker Industry Revenue Share (%), by Country 2025 & 2033
- Figure 130: Other Countries Reach Stacker Industry Revenue (billion), by Application 2025 & 2033
- Figure 131: Other Countries Reach Stacker Industry Revenue Share (%), by Application 2025 & 2033
- Figure 132: Other Countries Reach Stacker Industry Revenue (billion), by Tonnage 2025 & 2033
- Figure 133: Other Countries Reach Stacker Industry Revenue Share (%), by Tonnage 2025 & 2033
- Figure 134: Other Countries Reach Stacker Industry Revenue (billion), by Power Train Type 2025 & 2033
- Figure 135: Other Countries Reach Stacker Industry Revenue Share (%), by Power Train Type 2025 & 2033
- Figure 136: Other Countries Reach Stacker Industry Revenue (billion), by Country 2025 & 2033
- Figure 137: Other Countries Reach Stacker Industry Revenue Share (%), by Country 2025 & 2033
List of Tables
- Table 1: Global Reach Stacker Industry Revenue billion Forecast, by Application 2020 & 2033
- Table 2: Global Reach Stacker Industry Revenue billion Forecast, by Tonnage 2020 & 2033
- Table 3: Global Reach Stacker Industry Revenue billion Forecast, by Power Train Type 2020 & 2033
- Table 4: Global Reach Stacker Industry Revenue billion Forecast, by Region 2020 & 2033
- Table 5: Global Reach Stacker Industry Revenue billion Forecast, by Application 2020 & 2033
- Table 6: Global Reach Stacker Industry Revenue billion Forecast, by Tonnage 2020 & 2033
- Table 7: Global Reach Stacker Industry Revenue billion Forecast, by Power Train Type 2020 & 2033
- Table 8: Global Reach Stacker Industry Revenue billion Forecast, by Country 2020 & 2033
- Table 9: Global Reach Stacker Industry Revenue billion Forecast, by Application 2020 & 2033
- Table 10: Global Reach Stacker Industry Revenue billion Forecast, by Tonnage 2020 & 2033
- Table 11: Global Reach Stacker Industry Revenue billion Forecast, by Power Train Type 2020 & 2033
- Table 12: Global Reach Stacker Industry Revenue billion Forecast, by Country 2020 & 2033
- Table 13: Global Reach Stacker Industry Revenue billion Forecast, by Application 2020 & 2033
- Table 14: Global Reach Stacker Industry Revenue billion Forecast, by Tonnage 2020 & 2033
- Table 15: Global Reach Stacker Industry Revenue billion Forecast, by Power Train Type 2020 & 2033
- Table 16: Global Reach Stacker Industry Revenue billion Forecast, by Country 2020 & 2033
- Table 17: Global Reach Stacker Industry Revenue billion Forecast, by Application 2020 & 2033
- Table 18: Global Reach Stacker Industry Revenue billion Forecast, by Tonnage 2020 & 2033
- Table 19: Global Reach Stacker Industry Revenue billion Forecast, by Power Train Type 2020 & 2033
- Table 20: Global Reach Stacker Industry Revenue billion Forecast, by Country 2020 & 2033
- Table 21: Global Reach Stacker Industry Revenue billion Forecast, by Application 2020 & 2033
- Table 22: Global Reach Stacker Industry Revenue billion Forecast, by Tonnage 2020 & 2033
- Table 23: Global Reach Stacker Industry Revenue billion Forecast, by Power Train Type 2020 & 2033
- Table 24: Global Reach Stacker Industry Revenue billion Forecast, by Country 2020 & 2033
- Table 25: Global Reach Stacker Industry Revenue billion Forecast, by Application 2020 & 2033
- Table 26: Global Reach Stacker Industry Revenue billion Forecast, by Tonnage 2020 & 2033
- Table 27: Global Reach Stacker Industry Revenue billion Forecast, by Power Train Type 2020 & 2033
- Table 28: Global Reach Stacker Industry Revenue billion Forecast, by Country 2020 & 2033
- Table 29: Global Reach Stacker Industry Revenue billion Forecast, by Application 2020 & 2033
- Table 30: Global Reach Stacker Industry Revenue billion Forecast, by Tonnage 2020 & 2033
- Table 31: Global Reach Stacker Industry Revenue billion Forecast, by Power Train Type 2020 & 2033
- Table 32: Global Reach Stacker Industry Revenue billion Forecast, by Country 2020 & 2033
- Table 33: Global Reach Stacker Industry Revenue billion Forecast, by Application 2020 & 2033
- Table 34: Global Reach Stacker Industry Revenue billion Forecast, by Tonnage 2020 & 2033
- Table 35: Global Reach Stacker Industry Revenue billion Forecast, by Power Train Type 2020 & 2033
- Table 36: Global Reach Stacker Industry Revenue billion Forecast, by Country 2020 & 2033
- Table 37: Global Reach Stacker Industry Revenue billion Forecast, by Application 2020 & 2033
- Table 38: Global Reach Stacker Industry Revenue billion Forecast, by Tonnage 2020 & 2033
- Table 39: Global Reach Stacker Industry Revenue billion Forecast, by Power Train Type 2020 & 2033
- Table 40: Global Reach Stacker Industry Revenue billion Forecast, by Country 2020 & 2033
- Table 41: Global Reach Stacker Industry Revenue billion Forecast, by Application 2020 & 2033
- Table 42: Global Reach Stacker Industry Revenue billion Forecast, by Tonnage 2020 & 2033
- Table 43: Global Reach Stacker Industry Revenue billion Forecast, by Power Train Type 2020 & 2033
- Table 44: Global Reach Stacker Industry Revenue billion Forecast, by Country 2020 & 2033
- Table 45: Global Reach Stacker Industry Revenue billion Forecast, by Application 2020 & 2033
- Table 46: Global Reach Stacker Industry Revenue billion Forecast, by Tonnage 2020 & 2033
- Table 47: Global Reach Stacker Industry Revenue billion Forecast, by Power Train Type 2020 & 2033
- Table 48: Global Reach Stacker Industry Revenue billion Forecast, by Country 2020 & 2033
- Table 49: Global Reach Stacker Industry Revenue billion Forecast, by Application 2020 & 2033
- Table 50: Global Reach Stacker Industry Revenue billion Forecast, by Tonnage 2020 & 2033
- Table 51: Global Reach Stacker Industry Revenue billion Forecast, by Power Train Type 2020 & 2033
- Table 52: Global Reach Stacker Industry Revenue billion Forecast, by Country 2020 & 2033
- Table 53: Global Reach Stacker Industry Revenue billion Forecast, by Application 2020 & 2033
- Table 54: Global Reach Stacker Industry Revenue billion Forecast, by Tonnage 2020 & 2033
- Table 55: Global Reach Stacker Industry Revenue billion Forecast, by Power Train Type 2020 & 2033
- Table 56: Global Reach Stacker Industry Revenue billion Forecast, by Country 2020 & 2033
- Table 57: Global Reach Stacker Industry Revenue billion Forecast, by Application 2020 & 2033
- Table 58: Global Reach Stacker Industry Revenue billion Forecast, by Tonnage 2020 & 2033
- Table 59: Global Reach Stacker Industry Revenue billion Forecast, by Power Train Type 2020 & 2033
- Table 60: Global Reach Stacker Industry Revenue billion Forecast, by Country 2020 & 2033
- Table 61: Global Reach Stacker Industry Revenue billion Forecast, by Application 2020 & 2033
- Table 62: Global Reach Stacker Industry Revenue billion Forecast, by Tonnage 2020 & 2033
- Table 63: Global Reach Stacker Industry Revenue billion Forecast, by Power Train Type 2020 & 2033
- Table 64: Global Reach Stacker Industry Revenue billion Forecast, by Country 2020 & 2033
- Table 65: Global Reach Stacker Industry Revenue billion Forecast, by Application 2020 & 2033
- Table 66: Global Reach Stacker Industry Revenue billion Forecast, by Tonnage 2020 & 2033
- Table 67: Global Reach Stacker Industry Revenue billion Forecast, by Power Train Type 2020 & 2033
- Table 68: Global Reach Stacker Industry Revenue billion Forecast, by Country 2020 & 2033
- Table 69: Global Reach Stacker Industry Revenue billion Forecast, by Application 2020 & 2033
- Table 70: Global Reach Stacker Industry Revenue billion Forecast, by Tonnage 2020 & 2033
- Table 71: Global Reach Stacker Industry Revenue billion Forecast, by Power Train Type 2020 & 2033
- Table 72: Global Reach Stacker Industry Revenue billion Forecast, by Country 2020 & 2033
Frequently Asked Questions
1. What is the projected Compound Annual Growth Rate (CAGR) of the Reach Stacker Industry?
The projected CAGR is approximately 6.9%.
2. Which companies are prominent players in the Reach Stacker Industry?
Key companies in the market include Konecranes, Sany Group, Hyster, SMV Global, Liebherr Group, Toyota*List Not Exhaustive, Kalmar Group, CVS Ferrari S P A, Terex.
3. What are the main segments of the Reach Stacker Industry?
The market segments include Application, Tonnage, Power Train Type.
4. Can you provide details about the market size?
The market size is estimated to be USD 3.2 billion as of 2022.
5. What are some drivers contributing to market growth?
Diverse Selection Among Car Models is Anticipated to Drive the Market Growth.
6. What are the notable trends driving market growth?
Electric Reach Stacker to Gain Momentum.
7. Are there any restraints impacting market growth?
Counterfeit and Illegally Imported Vehicles are Restraining the Market Growth.
8. Can you provide examples of recent developments in the market?
N/A
9. What pricing options are available for accessing the report?
Pricing options include single-user, multi-user, and enterprise licenses priced at USD 4750, USD 5250, and USD 8750 respectively.
10. Is the market size provided in terms of value or volume?
The market size is provided in terms of value, measured in billion.
11. Are there any specific market keywords associated with the report?
Yes, the market keyword associated with the report is "Reach Stacker Industry," which aids in identifying and referencing the specific market segment covered.
12. How do I determine which pricing option suits my needs best?
The pricing options vary based on user requirements and access needs. Individual users may opt for single-user licenses, while businesses requiring broader access may choose multi-user or enterprise licenses for cost-effective access to the report.
13. Are there any additional resources or data provided in the Reach Stacker Industry report?
While the report offers comprehensive insights, it's advisable to review the specific contents or supplementary materials provided to ascertain if additional resources or data are available.
14. How can I stay updated on further developments or reports in the Reach Stacker Industry?
To stay informed about further developments, trends, and reports in the Reach Stacker Industry, consider subscribing to industry newsletters, following relevant companies and organizations, or regularly checking reputable industry news sources and publications.
Methodology
Step 1 - Identification of Relevant Samples Size from Population Database


Step 2 - Approaches for Defining Global Market Size (Value, Volume* & Price*)

Note*: In applicable scenarios
Step 3 - Data Sources
Primary Research
- Web Analytics
- Survey Reports
- Research Institute
- Latest Research Reports
- Opinion Leaders
Secondary Research
- Annual Reports
- White Paper
- Latest Press Release
- Industry Association
- Paid Database
- Investor Presentations

Step 4 - Data Triangulation
Involves using different sources of information in order to increase the validity of a study
These sources are likely to be stakeholders in a program - participants, other researchers, program staff, other community members, and so on.
Then we put all data in single framework & apply various statistical tools to find out the dynamic on the market.
During the analysis stage, feedback from the stakeholder groups would be compared to determine areas of agreement as well as areas of divergence