

Key Insights
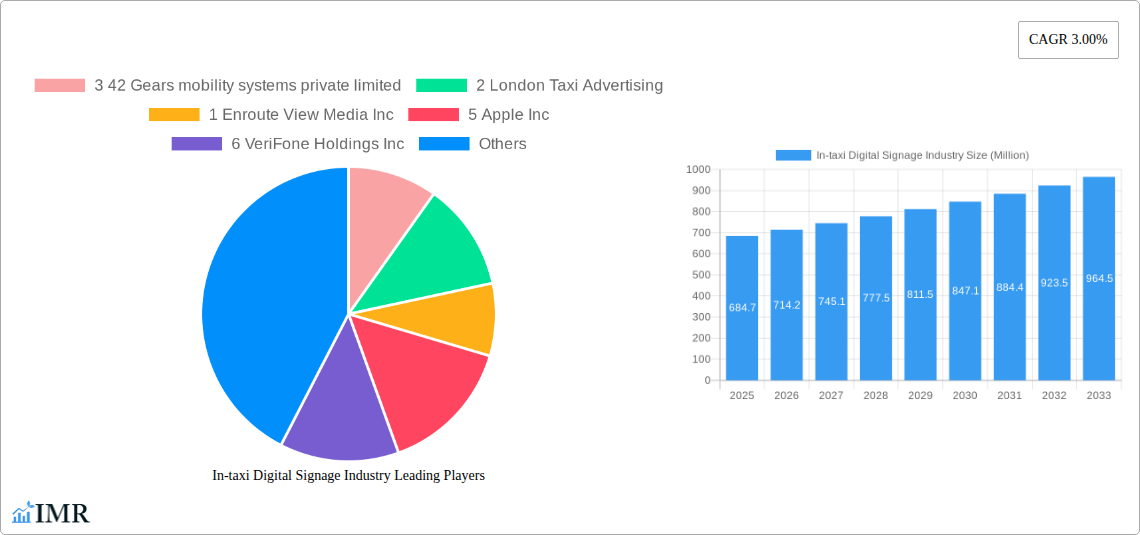
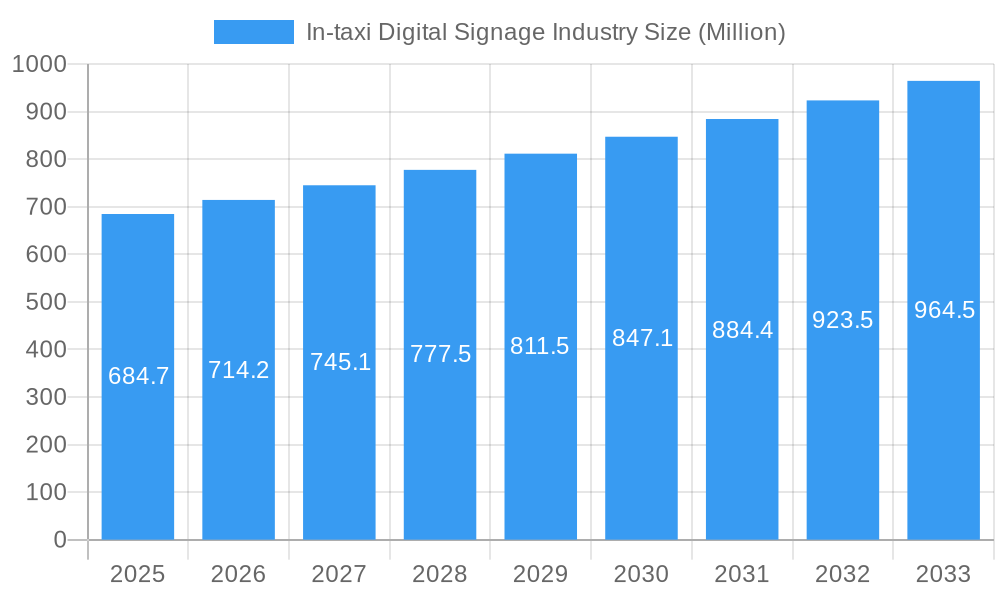
The In-taxi Digital Signage Industry is poised for significant expansion, driven by its ability to deliver targeted advertising and enhance passenger experience. Valued at $684.7 million in 2025, the market is projected to grow at a Compound Annual Growth Rate (CAGR) of 4.5% from 2025 to 2033. This growth is fueled by the increasing adoption of digital displays in taxi fleets across the globe, transforming traditional advertising methods. Key drivers include the rising demand for dynamic and engaging advertising content, the ability for advertisers to reach a captive audience with precise demographic targeting, and the growing smart city initiatives that integrate technology into public transportation. Furthermore, the enhancement of passenger experience through personalized content, real-time information, and entertainment options is also contributing to market penetration. The market is segmented by vehicle type, with Luxury/Premium Taxis and Economy/Budget Taxis both presenting unique advertising opportunities, and by display type, with LCD and LED technologies dominating. Companies like Samsung Electronics Co Ltd and Apple Inc are leading device manufacturers, while players like 42 Gears Mobility Systems Private Limited and Enroute View Media Inc are pivotal in providing software and advertising solutions.
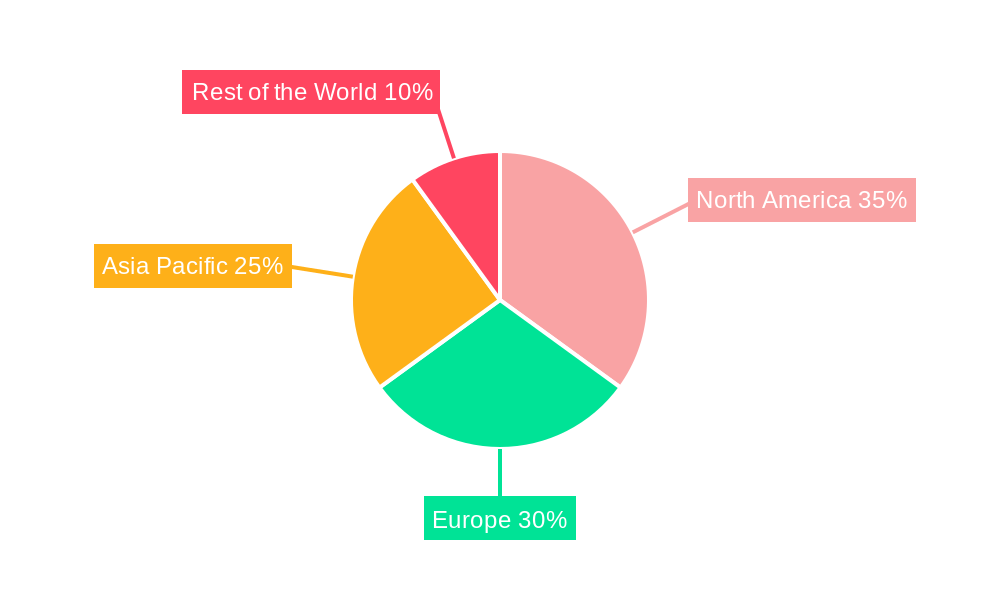
In-taxi Digital Signage Industry Market Size (In Million)
The market's expansion is also influenced by evolving consumer behavior and technological advancements. As more vehicles become connected and equipped with sophisticated display systems, the potential for innovative advertising formats and data-driven insights into audience engagement intensifies. The widespread availability of high-speed internet connectivity within taxis further enables the delivery of real-time and interactive content, making in-taxi digital signage a powerful marketing tool. While the market shows robust growth, potential restraints could include the initial cost of technology implementation for fleet operators and evolving privacy regulations that may impact data collection and targeted advertising strategies. However, the inherent advantages of in-taxi digital signage, such as high ad recall rates and measurable campaign performance, are expected to outweigh these challenges, especially with increasing investments from advertising service providers and software providers aiming to capitalize on this burgeoning sector. Geographically, North America and Europe are expected to lead in adoption due to advanced technological infrastructure and a high density of taxi services, with Asia Pacific showing significant growth potential.
In-taxi Digital Signage Industry Company Market Share
In-taxi Digital Signage Industry Market Dynamics & Structure
The in-taxi digital signage market is characterized by a moderately concentrated competitive landscape, with a few key players holding significant market share. This concentration is driven by the capital-intensive nature of device manufacturing and software development, alongside the need for established relationships with taxi fleets and advertising service providers. Technological innovation is a primary driver, with advancements in display technology (e.g., higher resolution, thinner bezels, energy efficiency for LCD and LED displays), interactive capabilities, and data analytics for ad targeting. Regulatory frameworks, while still evolving, are increasingly focusing on passenger privacy and data security, impacting how content is delivered and data is collected. Competitive product substitutes include traditional taxi advertising (e.g., car wraps, window decals) and other out-of-home advertising mediums. End-user demographics for in-taxi digital signage span a broad spectrum, from daily commuters seeking information and entertainment to tourists exploring new cities. M&A trends are expected to increase as larger tech companies and advertising conglomerates acquire smaller, specialized players to gain market access and technological expertise. For instance, the integration of advertising service providers with device manufacturers is a notable trend.
- Market Concentration: Driven by high entry barriers in manufacturing and software.
- Technological Innovation: Focus on display tech, interactivity, and data analytics.
- Regulatory Impact: Evolving rules on passenger privacy and data security.
- End-User Diversity: Catering to commuters, tourists, and diverse demographic groups.
- M&A Activity: Consolidation expected for market access and technology integration.
In-taxi Digital Signage Industry Growth Trends & Insights
The in-taxi digital signage industry is poised for significant expansion, driven by a confluence of technological advancements, shifting consumer behaviors, and the inherent advantages of advertising within a captive audience environment. The market size is projected to witness robust growth, evolving from an estimated $550 million in 2025 to an anticipated $1,800 million by 2033, showcasing a Compound Annual Growth Rate (CAGR) of approximately 15.7% during the forecast period (2025-2033). This upward trajectory is fueled by increasing adoption rates among taxi fleet operators seeking to monetize their vehicles and enhance passenger experience. The historical period (2019-2024) saw initial pilot programs and gradual implementation, laying the groundwork for the current growth phase. Technological disruptions, such as the miniaturization of LED and LCD displays, the development of more sophisticated content management systems, and the integration of AI for personalized advertising, are key enablers. Consumer behavior is shifting towards a greater acceptance of in-vehicle advertising, especially when it offers relevant content or discounts. Passengers are spending more time within taxis, creating longer viewing durations and higher engagement potential for advertisers. The base year of 2025 serves as a crucial benchmark, with an estimated market size of $550 million. Projections indicate a steady increase in market penetration as more taxi services integrate digital signage solutions. The ability of in-taxi digital signage to deliver targeted advertisements based on passenger demographics, location, and even journey duration presents a compelling value proposition for advertisers, moving beyond generic campaigns to highly effective, personalized marketing. Furthermore, the integration of real-time data analytics allows for campaign optimization and measurable ROI, a critical factor for advertising budgets. The industry is moving beyond simple ad playback to interactive experiences, including QR code integration for immediate offers and loyalty programs, further enhancing its appeal.
Dominant Regions, Countries, or Segments in In-taxi Digital Signage Industry
The in-taxi digital signage industry’s growth is not uniform across all geographies and segments, with certain regions and vehicle types exhibiting stronger adoption and revenue generation potential. North America, particularly the United States, is anticipated to be a dominant region, driven by a well-established ride-sharing ecosystem, high disposable incomes, and a receptive advertising market. Cities like New York, Los Angeles, and San Francisco, with their high taxi and ride-sharing density, are prime hubs for in-taxi digital signage deployments. The economic policies in these regions often support technological innovation and advertising expenditure. Furthermore, the presence of major technology and advertising companies headquartered in the U.S. fosters a dynamic environment for product development and market penetration.
Within the Vehicle Type segmentation, Luxury/Premium Taxis are expected to lead in terms of initial adoption and average revenue per vehicle. These vehicles, often used for business travel or by higher-income individuals, present a more affluent audience segment for advertisers. The willingness of premium taxi operators to invest in advanced technologies and passenger comfort further propels this segment. However, the Economy/Budget Taxi segment holds significant growth potential due to its sheer volume. As the cost of technology decreases, wider adoption in this segment will unlock a vast captive audience.
Considering Display Type, both LCD and LED displays will play crucial roles. LED displays, with their superior brightness, contrast, and energy efficiency, are becoming increasingly popular, especially in brighter urban environments. However, LCD displays remain a cost-effective and reliable option, particularly for budget-conscious fleet operators. The choice between LCD and LED will largely depend on the specific use case, budget, and desired visual impact.
Key drivers for dominance in these segments include:
- High Taxi/Ride-Sharing Density: Greater number of potential advertising touchpoints.
- Affluent Consumer Base: Increased spending power and receptiveness to premium advertising.
- Technological Infrastructure: Availability of reliable internet connectivity for content updates.
- Advertising Expenditure: Strong local and national advertising markets.
- Favorable Regulatory Environments: Supportive policies for out-of-home advertising and technological integration.
Market share in leading regions and segments is currently estimated with North America holding approximately 40% of the global market share, followed by Europe at 30%, and Asia-Pacific at 20%. Luxury/Premium Taxis are projected to account for 55% of the revenue, while Economy/Budget Taxis represent 45%. LCD displays are estimated to hold 60% of the market share due to their cost-effectiveness, with LED displays capturing the remaining 40% and showing a faster growth rate.
In-taxi Digital Signage Industry Product Landscape
Product innovations in the in-taxi digital signage sector are rapidly evolving, focusing on delivering enhanced passenger experiences and maximizing advertising effectiveness. Companies are developing ultra-slim and high-resolution LCD and LED displays that seamlessly integrate into taxi interiors. Interactive features, such as touch-screen capabilities, QR code integration for instant offers, and personalized content delivery powered by AI, are becoming standard. Performance metrics are increasingly emphasizing durability, energy efficiency, and ease of maintenance for the hardware. Unique selling propositions include the ability to deliver hyper-targeted advertisements based on real-time passenger data and journey context. Technological advancements are also centered on robust content management systems (CMS) that allow for remote scheduling, monitoring, and real-time analytics of ad campaigns.
Key Drivers, Barriers & Challenges in In-taxi Digital Signage Industry
Key Drivers: The in-taxi digital signage market is propelled by several key forces. The growing demand for targeted advertising and the ability to reach a captive audience within taxis are significant drivers. Technological advancements in display technology and the development of sophisticated content management systems further enhance the value proposition. The increasing adoption of ride-sharing services globally provides a larger pool of potential advertising locations. Monetization opportunities for taxi fleet operators, offering an additional revenue stream, are also crucial.
Barriers & Challenges: Despite the growth potential, the industry faces several barriers. High initial investment costs for hardware and software can be a deterrent for some fleet operators. Regulatory hurdles concerning passenger privacy, data collection, and content display can slow down adoption. Technical challenges related to installation, maintenance, and ensuring reliable internet connectivity within vehicles are also significant. Furthermore, competition from other out-of-home advertising channels and the need for consistent ad content quality pose ongoing challenges. Supply chain disruptions for electronic components can impact device availability and pricing, with potential impacts of 10-15% on production costs during periods of scarcity.
Emerging Opportunities in In-taxi Digital Signage Industry
Emerging opportunities lie in the integration of in-taxi digital signage with broader smart city initiatives. The potential to leverage these displays for public service announcements, real-time traffic updates, and emergency alerts offers a dual-purpose functionality. Personalized advertising, powered by AI and user data, presents a significant untapped market, allowing for highly relevant content delivery. The development of interactive advertising formats, such as gamified experiences or augmented reality overlays, can further enhance passenger engagement and advertiser ROI. Expansion into new geographic markets with developing ride-sharing ecosystems also represents a significant growth avenue.
Growth Accelerators in the In-taxi Digital Signage Industry Industry
Several catalysts are accelerating the long-term growth of the in-taxi digital signage industry. Technological breakthroughs in flexible and transparent displays could revolutionize interior aesthetics and passenger experience. Strategic partnerships between technology providers, advertising agencies, and taxi fleet operators are crucial for streamlining deployment and increasing market penetration. The development of standardized data analytics platforms will enable better campaign performance measurement and attract larger advertising budgets. As consumer comfort with in-vehicle digital content continues to grow, and as the cost of advanced display technology decreases, mass adoption across all taxi segments will become a significant growth accelerator.
Key Players Shaping the In-taxi Digital Signage Industry Market
- 3 42 Gears Mobility Systems Private Limited
- London Taxi Advertising
- Enroute View Media Inc
- Apple Inc
- VeriFone Holdings Inc
- Samsung Electronics Co Ltd
- Clear Vision Advertisement
- Blue Line Media
- Swipe Technologies
- Curb Mobility LLC
- Cabby Tabby Technologies
- BillboardsIn
- Bona Phandle Media
- 42Gears Mobility Systems Pvt Ltd
Notable Milestones in In-taxi Digital Signage Industry Sector
- 2019: Early pilot programs for digital advertising in ride-sharing vehicles gain traction, focusing on basic content display.
- 2020: Advancements in smaller, more energy-efficient LCD displays enable easier integration into taxi interiors.
- 2021: Introduction of cloud-based content management systems (CMS) allows for remote control and scheduling of ads.
- 2022: Increasing adoption of 4G/5G connectivity in taxis enables real-time ad updates and dynamic content delivery.
- 2023: Emergence of AI-driven analytics for personalized ad targeting based on passenger demographics and journey data.
- 2024: First significant mergers and acquisitions as larger advertising tech companies acquire smaller in-taxi media specialists.
In-Depth In-taxi Digital Signage Industry Market Outlook
The outlook for the in-taxi digital signage industry is exceptionally bright, fueled by ongoing technological innovation and a growing understanding of its unique advertising value. Strategic partnerships will continue to be a cornerstone of market expansion, facilitating smoother integration and wider reach. The increasing demand for personalized and data-driven advertising campaigns will ensure that in-taxi digital signage remains a highly attractive medium for advertisers. As the industry matures, a greater emphasis on standardized metrics and robust analytics will further solidify its position, leading to increased investment and sustained growth throughout the forecast period. The potential for integration with other digital out-of-home networks and smart city platforms presents exciting future avenues for revenue generation and enhanced urban connectivity.
In-taxi Digital Signage Industry Segmentation
-
1. Vehicle Type
- 1.1. Luxury/Premium Taxi
- 1.2. Economy/Budget Taxi
-
2. Display Type
- 2.1. LCD
- 2.2. LED
In-taxi Digital Signage Industry Segmentation By Geography
-
1. North America
- 1.1. United States
- 1.2. Canada
- 1.3. Rest of North America
-
2. Europe
- 2.1. United Kingdom
- 2.2. Germany
- 2.3. France
- 2.4. Spain
- 2.5. Rest of Europe
-
3. Asia Pacific
- 3.1. China
- 3.2. Japan
- 3.3. India
- 3.4. Rest of Asia Pacific
-
4. Rest of the World
- 4.1. Saudi Arabia
- 4.2. Brazil
- 4.3. Other Countries
In-taxi Digital Signage Industry Regional Market Share
Geographic Coverage of In-taxi Digital Signage Industry
In-taxi Digital Signage Industry REPORT HIGHLIGHTS
| Aspects | Details |
|---|---|
| Study Period | 2020-2034 |
| Base Year | 2025 |
| Estimated Year | 2026 |
| Forecast Period | 2026-2034 |
| Historical Period | 2020-2025 |
| Growth Rate | CAGR of 4.5% from 2020-2034 |
| Segmentation |
|
Table of Contents
- 1. Introduction
- 1.1. Research Scope
- 1.2. Market Segmentation
- 1.3. Research Objective
- 1.4. Definitions and Assumptions
- 2. Executive Summary
- 2.1. Market Snapshot
- 3. Market Dynamics
- 3.1. Market Drivers
- 3.2. Market Restrains
- 3.3. Market Trends
- 3.4. Market Opportunities
- 4. Market Factor Analysis
- 4.1. Porters Five Forces
- 4.1.1. Bargaining Power of Suppliers
- 4.1.2. Bargaining Power of Buyers
- 4.1.3. Threat of New Entrants
- 4.1.4. Threat of Substitutes
- 4.1.5. Competitive Rivalry
- 4.2. PESTEL analysis
- 4.3. BCG Analysis
- 4.3.1. Stars (High Growth, High Market Share)
- 4.3.2. Cash Cows (Low Growth, High Market Share)
- 4.3.3. Question Mark (High Growth, Low Market Share)
- 4.3.4. Dogs (Low Growth, Low Market Share)
- 4.4. Ansoff Matrix Analysis
- 4.5. Supply Chain Analysis
- 4.6. Regulatory Landscape
- 4.7. Current Market Potential and Opportunity Assessment (TAM–SAM–SOM Framework)
- 4.8. IMR Analyst Note
- 4.1. Porters Five Forces
- 5. Market Analysis, Insights and Forecast 2021-2033
- 5.1. Market Analysis, Insights and Forecast - by Vehicle Type
- 5.1.1. Luxury/Premium Taxi
- 5.1.2. Economy/Budget Taxi
- 5.2. Market Analysis, Insights and Forecast - by Display Type
- 5.2.1. LCD
- 5.2.2. LED
- 5.3. Market Analysis, Insights and Forecast - by Region
- 5.3.1. North America
- 5.3.2. Europe
- 5.3.3. Asia Pacific
- 5.3.4. Rest of the World
- 5.1. Market Analysis, Insights and Forecast - by Vehicle Type
- 6. Global In-taxi Digital Signage Industry Analysis, Insights and Forecast, 2021-2033
- 6.1. Market Analysis, Insights and Forecast - by Vehicle Type
- 6.1.1. Luxury/Premium Taxi
- 6.1.2. Economy/Budget Taxi
- 6.2. Market Analysis, Insights and Forecast - by Display Type
- 6.2.1. LCD
- 6.2.2. LED
- 6.1. Market Analysis, Insights and Forecast - by Vehicle Type
- 7. North America In-taxi Digital Signage Industry Analysis, Insights and Forecast, 2020-2032
- 7.1. Market Analysis, Insights and Forecast - by Vehicle Type
- 7.1.1. Luxury/Premium Taxi
- 7.1.2. Economy/Budget Taxi
- 7.2. Market Analysis, Insights and Forecast - by Display Type
- 7.2.1. LCD
- 7.2.2. LED
- 7.1. Market Analysis, Insights and Forecast - by Vehicle Type
- 8. Europe In-taxi Digital Signage Industry Analysis, Insights and Forecast, 2020-2032
- 8.1. Market Analysis, Insights and Forecast - by Vehicle Type
- 8.1.1. Luxury/Premium Taxi
- 8.1.2. Economy/Budget Taxi
- 8.2. Market Analysis, Insights and Forecast - by Display Type
- 8.2.1. LCD
- 8.2.2. LED
- 8.1. Market Analysis, Insights and Forecast - by Vehicle Type
- 9. Asia Pacific In-taxi Digital Signage Industry Analysis, Insights and Forecast, 2020-2032
- 9.1. Market Analysis, Insights and Forecast - by Vehicle Type
- 9.1.1. Luxury/Premium Taxi
- 9.1.2. Economy/Budget Taxi
- 9.2. Market Analysis, Insights and Forecast - by Display Type
- 9.2.1. LCD
- 9.2.2. LED
- 9.1. Market Analysis, Insights and Forecast - by Vehicle Type
- 10. Rest of the World In-taxi Digital Signage Industry Analysis, Insights and Forecast, 2020-2032
- 10.1. Market Analysis, Insights and Forecast - by Vehicle Type
- 10.1.1. Luxury/Premium Taxi
- 10.1.2. Economy/Budget Taxi
- 10.2. Market Analysis, Insights and Forecast - by Display Type
- 10.2.1. LCD
- 10.2.2. LED
- 10.1. Market Analysis, Insights and Forecast - by Vehicle Type
- 11. Competitive Analysis
- 11.1. Company Profiles
- 11.1.1 3 42 Gears mobility systems private limited
- 11.1.1.1. Company Overview
- 11.1.1.2. Products
- 11.1.1.3. Company Financials
- 11.1.1.4. SWOT Analysis
- 11.1.2 2 London Taxi Advertising
- 11.1.2.1. Company Overview
- 11.1.2.2. Products
- 11.1.2.3. Company Financials
- 11.1.2.4. SWOT Analysis
- 11.1.3 1 Enroute View Media Inc
- 11.1.3.1. Company Overview
- 11.1.3.2. Products
- 11.1.3.3. Company Financials
- 11.1.3.4. SWOT Analysis
- 11.1.4 5 Apple Inc
- 11.1.4.1. Company Overview
- 11.1.4.2. Products
- 11.1.4.3. Company Financials
- 11.1.4.4. SWOT Analysis
- 11.1.5 6 VeriFone Holdings Inc
- 11.1.5.1. Company Overview
- 11.1.5.2. Products
- 11.1.5.3. Company Financials
- 11.1.5.4. SWOT Analysis
- 11.1.6 4 Samsung Electronics Co Ltd
- 11.1.6.1. Company Overview
- 11.1.6.2. Products
- 11.1.6.3. Company Financials
- 11.1.6.4. SWOT Analysis
- 11.1.7 1 Clear Vision Advertisement
- 11.1.7.1. Company Overview
- 11.1.7.2. Products
- 11.1.7.3. Company Financials
- 11.1.7.4. SWOT Analysis
- 11.1.8 4 Blue Line Media
- 11.1.8.1. Company Overview
- 11.1.8.2. Products
- 11.1.8.3. Company Financials
- 11.1.8.4. SWOT Analysis
- 11.1.9 1 Swipe Technologies
- 11.1.9.1. Company Overview
- 11.1.9.2. Products
- 11.1.9.3. Company Financials
- 11.1.9.4. SWOT Analysis
- 11.1.10 3 Curb Mobility LLC
- 11.1.10.1. Company Overview
- 11.1.10.2. Products
- 11.1.10.3. Company Financials
- 11.1.10.4. SWOT Analysis
- 11.1.11 2 Curb Mobility LLC
- 11.1.11.1. Company Overview
- 11.1.11.2. Products
- 11.1.11.3. Company Financials
- 11.1.11.4. SWOT Analysis
- 11.1.12 2 Cabby Tabby Technologies
- 11.1.12.1. Company Overview
- 11.1.12.2. Products
- 11.1.12.3. Company Financials
- 11.1.12.4. SWOT Analysis
- 11.1.13 5 BillboardsIn
- 11.1.13.1. Company Overview
- 11.1.13.2. Products
- 11.1.13.3. Company Financials
- 11.1.13.4. SWOT Analysis
- 11.1.14 6 Bona Phandle Media
- 11.1.14.1. Company Overview
- 11.1.14.2. Products
- 11.1.14.3. Company Financials
- 11.1.14.4. SWOT Analysis
- 11.1.15 Advertising Service Providers
- 11.1.15.1. Company Overview
- 11.1.15.2. Products
- 11.1.15.3. Company Financials
- 11.1.15.4. SWOT Analysis
- 11.1.16 Software Providers
- 11.1.16.1. Company Overview
- 11.1.16.2. Products
- 11.1.16.3. Company Financials
- 11.1.16.4. SWOT Analysis
- 11.1.17 3 42Gears Mobility Systems Pvt Ltd
- 11.1.17.1. Company Overview
- 11.1.17.2. Products
- 11.1.17.3. Company Financials
- 11.1.17.4. SWOT Analysis
- 11.1.18 Device Manufacturers
- 11.1.18.1. Company Overview
- 11.1.18.2. Products
- 11.1.18.3. Company Financials
- 11.1.18.4. SWOT Analysis
- 11.1.1 3 42 Gears mobility systems private limited
- 11.2. Market Entropy
- 11.2.1 Company's Key Areas Served
- 11.2.2 Recent Developments
- 11.3. Company Market Share Analysis 2025
- 11.3.1 Top 5 Companies Market Share Analysis
- 11.3.2 Top 3 Companies Market Share Analysis
- 11.4. List of Potential Customers
- 12. Research Methodology
List of Figures
- Figure 1: Global In-taxi Digital Signage Industry Revenue Breakdown (undefined, %) by Region 2025 & 2033
- Figure 2: North America In-taxi Digital Signage Industry Revenue (undefined), by Vehicle Type 2025 & 2033
- Figure 3: North America In-taxi Digital Signage Industry Revenue Share (%), by Vehicle Type 2025 & 2033
- Figure 4: North America In-taxi Digital Signage Industry Revenue (undefined), by Display Type 2025 & 2033
- Figure 5: North America In-taxi Digital Signage Industry Revenue Share (%), by Display Type 2025 & 2033
- Figure 6: North America In-taxi Digital Signage Industry Revenue (undefined), by Country 2025 & 2033
- Figure 7: North America In-taxi Digital Signage Industry Revenue Share (%), by Country 2025 & 2033
- Figure 8: Europe In-taxi Digital Signage Industry Revenue (undefined), by Vehicle Type 2025 & 2033
- Figure 9: Europe In-taxi Digital Signage Industry Revenue Share (%), by Vehicle Type 2025 & 2033
- Figure 10: Europe In-taxi Digital Signage Industry Revenue (undefined), by Display Type 2025 & 2033
- Figure 11: Europe In-taxi Digital Signage Industry Revenue Share (%), by Display Type 2025 & 2033
- Figure 12: Europe In-taxi Digital Signage Industry Revenue (undefined), by Country 2025 & 2033
- Figure 13: Europe In-taxi Digital Signage Industry Revenue Share (%), by Country 2025 & 2033
- Figure 14: Asia Pacific In-taxi Digital Signage Industry Revenue (undefined), by Vehicle Type 2025 & 2033
- Figure 15: Asia Pacific In-taxi Digital Signage Industry Revenue Share (%), by Vehicle Type 2025 & 2033
- Figure 16: Asia Pacific In-taxi Digital Signage Industry Revenue (undefined), by Display Type 2025 & 2033
- Figure 17: Asia Pacific In-taxi Digital Signage Industry Revenue Share (%), by Display Type 2025 & 2033
- Figure 18: Asia Pacific In-taxi Digital Signage Industry Revenue (undefined), by Country 2025 & 2033
- Figure 19: Asia Pacific In-taxi Digital Signage Industry Revenue Share (%), by Country 2025 & 2033
- Figure 20: Rest of the World In-taxi Digital Signage Industry Revenue (undefined), by Vehicle Type 2025 & 2033
- Figure 21: Rest of the World In-taxi Digital Signage Industry Revenue Share (%), by Vehicle Type 2025 & 2033
- Figure 22: Rest of the World In-taxi Digital Signage Industry Revenue (undefined), by Display Type 2025 & 2033
- Figure 23: Rest of the World In-taxi Digital Signage Industry Revenue Share (%), by Display Type 2025 & 2033
- Figure 24: Rest of the World In-taxi Digital Signage Industry Revenue (undefined), by Country 2025 & 2033
- Figure 25: Rest of the World In-taxi Digital Signage Industry Revenue Share (%), by Country 2025 & 2033
List of Tables
- Table 1: Global In-taxi Digital Signage Industry Revenue undefined Forecast, by Vehicle Type 2020 & 2033
- Table 2: Global In-taxi Digital Signage Industry Revenue undefined Forecast, by Display Type 2020 & 2033
- Table 3: Global In-taxi Digital Signage Industry Revenue undefined Forecast, by Region 2020 & 2033
- Table 4: Global In-taxi Digital Signage Industry Revenue undefined Forecast, by Vehicle Type 2020 & 2033
- Table 5: Global In-taxi Digital Signage Industry Revenue undefined Forecast, by Display Type 2020 & 2033
- Table 6: Global In-taxi Digital Signage Industry Revenue undefined Forecast, by Country 2020 & 2033
- Table 7: United States In-taxi Digital Signage Industry Revenue (undefined) Forecast, by Application 2020 & 2033
- Table 8: Canada In-taxi Digital Signage Industry Revenue (undefined) Forecast, by Application 2020 & 2033
- Table 9: Rest of North America In-taxi Digital Signage Industry Revenue (undefined) Forecast, by Application 2020 & 2033
- Table 10: Global In-taxi Digital Signage Industry Revenue undefined Forecast, by Vehicle Type 2020 & 2033
- Table 11: Global In-taxi Digital Signage Industry Revenue undefined Forecast, by Display Type 2020 & 2033
- Table 12: Global In-taxi Digital Signage Industry Revenue undefined Forecast, by Country 2020 & 2033
- Table 13: United Kingdom In-taxi Digital Signage Industry Revenue (undefined) Forecast, by Application 2020 & 2033
- Table 14: Germany In-taxi Digital Signage Industry Revenue (undefined) Forecast, by Application 2020 & 2033
- Table 15: France In-taxi Digital Signage Industry Revenue (undefined) Forecast, by Application 2020 & 2033
- Table 16: Spain In-taxi Digital Signage Industry Revenue (undefined) Forecast, by Application 2020 & 2033
- Table 17: Rest of Europe In-taxi Digital Signage Industry Revenue (undefined) Forecast, by Application 2020 & 2033
- Table 18: Global In-taxi Digital Signage Industry Revenue undefined Forecast, by Vehicle Type 2020 & 2033
- Table 19: Global In-taxi Digital Signage Industry Revenue undefined Forecast, by Display Type 2020 & 2033
- Table 20: Global In-taxi Digital Signage Industry Revenue undefined Forecast, by Country 2020 & 2033
- Table 21: China In-taxi Digital Signage Industry Revenue (undefined) Forecast, by Application 2020 & 2033
- Table 22: Japan In-taxi Digital Signage Industry Revenue (undefined) Forecast, by Application 2020 & 2033
- Table 23: India In-taxi Digital Signage Industry Revenue (undefined) Forecast, by Application 2020 & 2033
- Table 24: Rest of Asia Pacific In-taxi Digital Signage Industry Revenue (undefined) Forecast, by Application 2020 & 2033
- Table 25: Global In-taxi Digital Signage Industry Revenue undefined Forecast, by Vehicle Type 2020 & 2033
- Table 26: Global In-taxi Digital Signage Industry Revenue undefined Forecast, by Display Type 2020 & 2033
- Table 27: Global In-taxi Digital Signage Industry Revenue undefined Forecast, by Country 2020 & 2033
- Table 28: Saudi Arabia In-taxi Digital Signage Industry Revenue (undefined) Forecast, by Application 2020 & 2033
- Table 29: Brazil In-taxi Digital Signage Industry Revenue (undefined) Forecast, by Application 2020 & 2033
- Table 30: Other Countries In-taxi Digital Signage Industry Revenue (undefined) Forecast, by Application 2020 & 2033
Frequently Asked Questions
1. What is the projected Compound Annual Growth Rate (CAGR) of the In-taxi Digital Signage Industry?
The projected CAGR is approximately 4.5%.
2. Which companies are prominent players in the In-taxi Digital Signage Industry?
Key companies in the market include 3 42 Gears mobility systems private limited, 2 London Taxi Advertising, 1 Enroute View Media Inc, 5 Apple Inc, 6 VeriFone Holdings Inc, 4 Samsung Electronics Co Ltd, 1 Clear Vision Advertisement, 4 Blue Line Media, 1 Swipe Technologies, 3 Curb Mobility LLC, 2 Curb Mobility LLC, 2 Cabby Tabby Technologies, 5 BillboardsIn, 6 Bona Phandle Media, Advertising Service Providers, Software Providers, 3 42Gears Mobility Systems Pvt Ltd, Device Manufacturers.
3. What are the main segments of the In-taxi Digital Signage Industry?
The market segments include Vehicle Type, Display Type.
4. Can you provide details about the market size?
The market size is estimated to be USD XXX N/A as of 2022.
5. What are some drivers contributing to market growth?
Exponential Increase in Automotive Sector.
6. What are the notable trends driving market growth?
Growing Adoption of Entertainment Devices in Luxury Taxis.
7. Are there any restraints impacting market growth?
Digitization of R&D Operations in Automotive Sector.
8. Can you provide examples of recent developments in the market?
N/A
9. What pricing options are available for accessing the report?
Pricing options include single-user, multi-user, and enterprise licenses priced at USD 4750, USD 5250, and USD 8750 respectively.
10. Is the market size provided in terms of value or volume?
The market size is provided in terms of value, measured in N/A.
11. Are there any specific market keywords associated with the report?
Yes, the market keyword associated with the report is "In-taxi Digital Signage Industry," which aids in identifying and referencing the specific market segment covered.
12. How do I determine which pricing option suits my needs best?
The pricing options vary based on user requirements and access needs. Individual users may opt for single-user licenses, while businesses requiring broader access may choose multi-user or enterprise licenses for cost-effective access to the report.
13. Are there any additional resources or data provided in the In-taxi Digital Signage Industry report?
While the report offers comprehensive insights, it's advisable to review the specific contents or supplementary materials provided to ascertain if additional resources or data are available.
14. How can I stay updated on further developments or reports in the In-taxi Digital Signage Industry?
To stay informed about further developments, trends, and reports in the In-taxi Digital Signage Industry, consider subscribing to industry newsletters, following relevant companies and organizations, or regularly checking reputable industry news sources and publications.
Methodology
Step 1 - Identification of Relevant Samples Size from Population Database


Step 2 - Approaches for Defining Global Market Size (Value, Volume* & Price*)

Note*: In applicable scenarios
Step 3 - Data Sources
Primary Research
- Web Analytics
- Survey Reports
- Research Institute
- Latest Research Reports
- Opinion Leaders
Secondary Research
- Annual Reports
- White Paper
- Latest Press Release
- Industry Association
- Paid Database
- Investor Presentations

Step 4 - Data Triangulation
Involves using different sources of information in order to increase the validity of a study
These sources are likely to be stakeholders in a program - participants, other researchers, program staff, other community members, and so on.
Then we put all data in single framework & apply various statistical tools to find out the dynamic on the market.
During the analysis stage, feedback from the stakeholder groups would be compared to determine areas of agreement as well as areas of divergence