

Key Insights
The Electric Sports Utility Vehicle (eSUV) market is projected for substantial growth, reaching a market size of 223.06 billion by 2033. Driven by a Compound Annual Growth Rate (CAGR) of 13.6% from a base year of 2024, this sector is experiencing robust expansion. Key growth factors include increasing consumer demand for sustainable transportation, advancements in battery technology enhancing range and performance, and supportive government initiatives such as subsidies and emission regulations. Furthermore, automotive manufacturers are expanding their eSUV offerings, catering to diverse consumer needs and preferences.
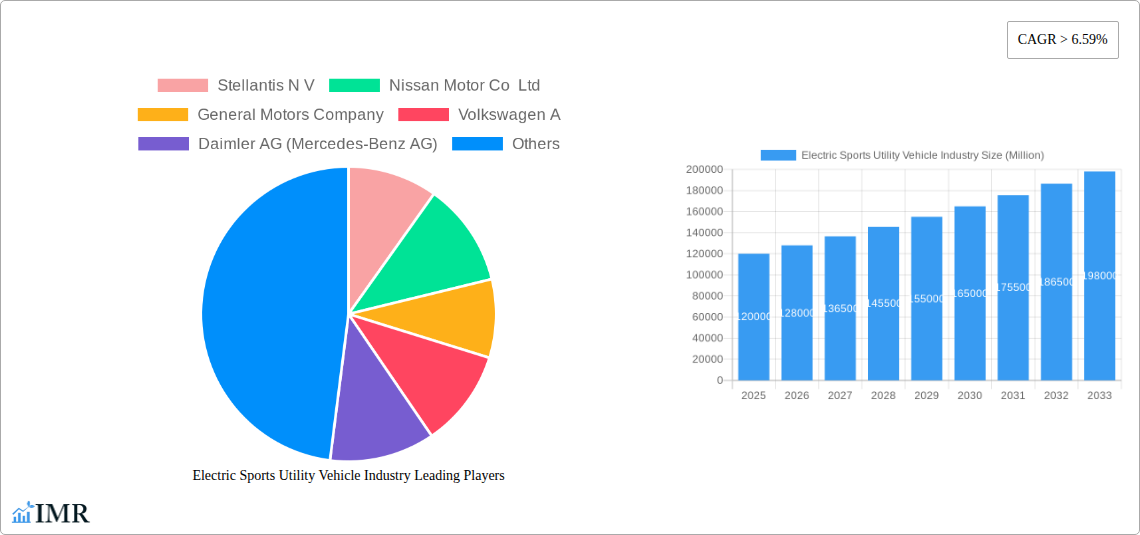
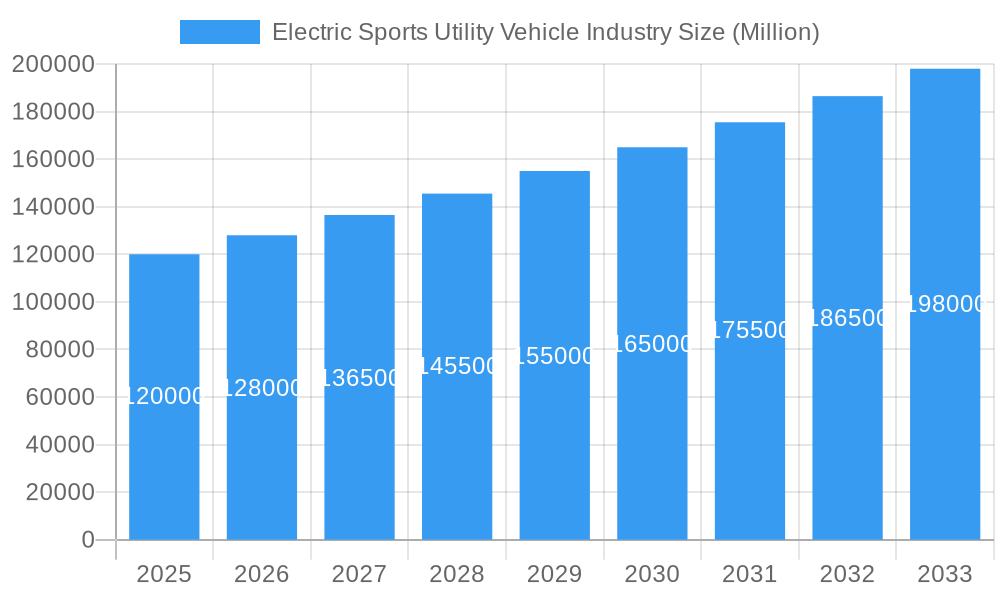
Electric Sports Utility Vehicle Industry Market Size (In Billion)
The eSUV market is segmented by vehicle configuration, with passenger cars, particularly Multi-purpose Vehicles (MPVs), leading the adoption. Battery Electric Vehicles (BEVs) dominate within fuel categories, supported by expanding charging infrastructure and decreasing battery costs. Fuel Cell Electric Vehicles (FCEVs), Hybrid Electric Vehicles (HEVs), and Plug-in Hybrid Electric Vehicles (PHEVs) also contribute significantly, offering diverse EV transition solutions. Geographically, North America and Europe lead eSUV adoption due to environmental consciousness and favorable policies. The Asia Pacific region, especially China, is rapidly emerging as a key market. Despite challenges like initial costs and charging infrastructure concerns in some areas, the eSUV market is set for continued dynamic growth.
Electric Sports Utility Vehicle Industry Company Market Share
Electric Sports Utility Vehicle (eSUV) Industry Report: Market Outlook, Growth Drivers, and Key Trends (2019-2033)
This comprehensive report offers an in-depth analysis of the global Electric Sports Utility Vehicle (eSUV) market, a rapidly expanding segment within the automotive industry. Covering the period from 2019 to 2033, with a base year of 2025, this study provides critical insights into market dynamics, growth trajectories, regional dominance, product innovations, and the key players shaping the future of electric mobility. We delve into the intricate parent and child market structures, offering a granular view of the opportunities and challenges for stakeholders.
Electric Sports Utility Vehicle Industry Market Dynamics & Structure
The Electric Sports Utility Vehicle (eSUV) market is characterized by a moderately concentrated structure, with major automotive giants and emerging EV players vying for market share. Technological innovation is a primary driver, fueled by advancements in battery technology, powertrain efficiency, and autonomous driving features. Regulatory frameworks, including government incentives for EV adoption and stricter emission standards, are significantly influencing market growth. Competitive product substitutes include traditional internal combustion engine (ICE) SUVs, hybrid SUVs, and other electric vehicle segments. End-user demographics are shifting towards environmentally conscious consumers, tech-savvy individuals, and families seeking versatile and sustainable transportation. Mergers and acquisitions (M&A) trends are emerging as companies seek to enhance their technological capabilities, expand their product portfolios, and secure supply chains. For instance, we have observed numerous strategic alliances aimed at battery development and charging infrastructure expansion. The market penetration is still in its nascent stages in many regions, presenting substantial growth potential. The eSUV market size is projected to reach $XXX Billion by 2033, exhibiting a robust CAGR of XX% during the forecast period (2025-2033).
- Market Concentration: Dominated by a blend of established automakers and dedicated EV manufacturers.
- Technological Innovation: Driven by battery density improvements, faster charging, and advanced driver-assistance systems (ADAS).
- Regulatory Frameworks: Government subsidies, tax credits, and emission mandates play a crucial role.
- Competitive Product Substitutes: Traditional SUVs, PHEVs, and other EV body styles.
- End-User Demographics: Environmentally conscious, tech-savvy consumers, and families seeking utility.
- M&A Trends: Increasing consolidation and strategic partnerships for technology and supply chain access.
Electric Sports Utility Vehicle Industry Growth Trends & Insights
The global Electric Sports Utility Vehicle (eSUV) market is experiencing an unprecedented surge in growth, driven by a confluence of factors including increasing environmental awareness, government support, and rapid technological advancements. The eSUV market size is projected to witness substantial expansion, evolving from $XX Million units in 2019 to an estimated $XXX Million units by 2033. This remarkable growth trajectory is underpinned by a significant increase in adoption rates, propelled by declining battery costs and expanding charging infrastructure. Consumers are increasingly embracing eSUVs due to their perceived benefits of lower running costs, superior performance, and reduced environmental impact. Technological disruptions, such as breakthroughs in solid-state battery technology and enhanced regenerative braking systems, are further accelerating this adoption.
The shift in consumer behavior is palpable; there's a growing preference for vehicles that offer a blend of utility, sustainability, and cutting-edge technology. This trend is particularly evident in urban and suburban areas where eSUVs cater to diverse needs, from daily commuting to family outings. The CAGR of the eSUV market is estimated at a robust XX% during the forecast period (2025-2033), indicating a sustained upward momentum. Market penetration, while varying across regions, is steadily increasing, with developed economies leading the charge. The average price of eSUVs is also becoming more competitive, making them accessible to a broader consumer base. Furthermore, the development of new eSUV models with extended ranges and faster charging capabilities is directly addressing previous consumer concerns about range anxiety and charging convenience. The electric SUV market is not just a trend but a fundamental transformation in personal transportation.
- Market Size Evolution: Significant growth from historical lows to substantial projected figures.
- Adoption Rates: Accelerating adoption driven by cost parity and improved performance.
- Technological Disruptions: Innovations in battery tech, charging, and autonomous features.
- Consumer Behavior Shifts: Growing demand for sustainable, versatile, and high-tech vehicles.
- CAGR: Strong compound annual growth rate indicating sustained market expansion.
- Market Penetration: Increasing presence across diverse geographical and demographic segments.
Dominant Regions, Countries, or Segments in Electric Sports Utility Vehicle Industry
The global Electric Sports Utility Vehicle (eSUV) market's dominance is currently observed in regions with strong governmental support for electric vehicles, robust charging infrastructure, and a high level of consumer awareness regarding environmental sustainability. North America and Europe stand out as leading regions, with countries like the United States, China, Germany, and Norway spearheading adoption. China, in particular, has emerged as a powerhouse in the eSUV sector, driven by favorable government policies, a massive domestic market, and the rapid expansion of domestic EV manufacturers.
Within vehicle configuration, Passenger Cars, specifically the Multi-purpose Vehicle (MPV) sub-segment that eSUVs effectively fulfill, are driving market growth. In terms of fuel category, the Battery Electric Vehicle (BEV) segment is the undisputed leader, accounting for the vast majority of eSUV sales. While Plug-in Hybrid Electric Vehicles (PHEVs) play a role in bridging the gap for consumers transitioning to full electrification, BEVs are clearly defining the future trajectory of the eSUV market. The market share for BEVs in the eSUV segment is estimated to be around XX% in the base year of 2025, with projected growth to over XX% by 2033.
Key drivers for dominance in these regions and segments include:
- Economic Policies: Substantial government subsidies, tax credits, and favorable import duties for EVs.
- Infrastructure Development: Extensive and expanding public and private charging networks.
- Consumer Demand: High consumer acceptance of electric mobility and preference for SUV body styles.
- Regulatory Frameworks: Strict emission standards and targets for EV sales forcing manufacturers to invest.
- Technological Advancement: Availability of advanced eSUV models with competitive range and performance.
- Market Share: Leading regions and countries hold significant portions of the global eSUV market.
- Growth Potential: Continued high growth rates projected for dominant segments.
Electric Sports Utility Vehicle Industry Product Landscape
The product landscape of the Electric Sports Utility Vehicle (eSUV) industry is defined by continuous innovation and a focus on enhanced performance, extended range, and advanced features. Manufacturers are increasingly differentiating their offerings through unique selling propositions such as cutting-edge battery technology for faster charging and longer driving distances, often exceeding 500 kilometers on a single charge. Advanced driver-assistance systems (ADAS) are becoming standard, providing enhanced safety and convenience. The integration of smart connectivity, over-the-air updates, and sophisticated infotainment systems further enhances the appeal of these vehicles. Performance metrics like rapid acceleration and efficient energy management are key differentiators, with many eSUVs now offering performance comparable to or exceeding their ICE counterparts.
Key Drivers, Barriers & Challenges in Electric Sports Utility Vehicle Industry
The Electric Sports Utility Vehicle (eSUV) market is propelled by several key drivers. Growing environmental concerns and a desire for sustainable transportation are pushing consumers towards electric options. Favorable government policies, including subsidies and tax incentives, significantly reduce the upfront cost of eSUVs, making them more attractive. Advancements in battery technology have led to increased range and faster charging times, addressing crucial consumer pain points. The expanding charging infrastructure, both public and private, further bolsters consumer confidence.
However, the industry faces significant barriers and challenges. The initial purchase price of eSUVs, while decreasing, can still be higher than comparable ICE vehicles. Range anxiety, though diminishing, remains a concern for some consumers, particularly in areas with less developed charging infrastructure. The availability and speed of charging stations, especially on long journeys, continue to be a hurdle. Supply chain disruptions, particularly for critical battery components like lithium and cobalt, can impact production volumes and costs. Regulatory complexities and varying standards across different countries can also pose challenges for global manufacturers. Competitive pressures from established automotive giants and new EV startups are intense, demanding continuous innovation and cost optimization.
- Key Drivers:
- Environmental consciousness and sustainability trends.
- Government incentives and supportive regulations.
- Advancements in battery technology (range and charging speed).
- Expansion of charging infrastructure.
- Key Barriers & Challenges:
- Higher initial purchase cost compared to ICE vehicles.
- Lingering range anxiety and charging availability concerns.
- Supply chain vulnerabilities for critical battery materials.
- Navigating diverse international regulatory landscapes.
- Intense competition and the need for continuous innovation.
Emerging Opportunities in Electric Sports Utility Vehicle Industry
The Electric Sports Utility Vehicle (eSUV) industry is ripe with emerging opportunities. The untapped potential in developing economies presents a significant growth avenue as these markets increasingly embrace electrification. Innovative battery technologies, such as solid-state batteries, promise to further enhance range and safety, opening up new product development possibilities. Evolving consumer preferences for connected car features and advanced digital services within eSUVs create opportunities for integrated software and service offerings. Furthermore, the development of more affordable eSUV models will cater to a broader demographic, expanding market reach. The circular economy principles applied to battery recycling and second-life applications also represent a growing area of opportunity for sustainable business models within the eSUV sector.
Growth Accelerators in the Electric Sports Utility Vehicle Industry Industry
Several catalysts are accelerating the growth of the Electric Sports Utility Vehicle (eSUV) industry. Breakthroughs in battery energy density and charging technology are continuously pushing the boundaries of performance and convenience, directly influencing consumer adoption. Strategic partnerships between automotive manufacturers, battery producers, and technology companies are crucial for accelerating innovation and streamlining supply chains. Furthermore, market expansion strategies, including the introduction of diverse eSUV models catering to different price points and consumer needs, are crucial for capturing a larger market share. The increasing focus on vehicle-to-grid (V2G) technology and smart charging solutions also presents a significant growth avenue, integrating eSUVs into the broader energy ecosystem.
Key Players Shaping the Electric Sports Utility Vehicle Industry Market
- Tesla Inc
- BYD Auto Co Ltd
- Volkswagen AG
- General Motors Company
- Stellantis N.V.
- Hyundai Motor Company
- Daimler AG (Mercedes-Benz AG)
- Nissan Motor Co., Ltd.
- Ford Motor Company
- Toyota Motor Corporation
- Groupe Renault
Notable Milestones in Electric Sports Utility Vehicle Industry Sector
- December 2023: Ford Mustang Mach-E features electric all-wheel drive and standard heated seats and a steering wheel, enhancing its appeal and functionality for winter conditions.
- November 2023: Ford Motors and manufacturers entered into a strategic partnership to aid suppliers in achieving their CO2 reduction targets, aligning with Ford Motor Co.'s objective of carbon neutrality by 2050. This highlights a growing industry focus on sustainability throughout the value chain.
- November 2023: Hyundai Motor's Genesis division opened a new showroom in New York, United States, signaling an expansion of luxury EV offerings and brand presence in key markets.
In-Depth Electric Sports Utility Vehicle Industry Market Outlook
The future market outlook for the Electric Sports Utility Vehicle (eSUV) industry is exceptionally promising, driven by sustained innovation and evolving consumer preferences. Growth accelerators such as advancements in battery technology promising longer ranges and faster charging, coupled with expanding charging infrastructure, will continue to dismantle barriers to adoption. Strategic partnerships and collaborations across the automotive and technology sectors are fostering a rapid pace of development. The market expansion driven by diverse product portfolios, including more affordable eSUV options and specialized variants, will cater to a wider customer base. Emerging opportunities in connected vehicle services and sustainable practices like battery recycling further solidify the long-term growth trajectory for the eSUV segment, positioning it as a cornerstone of future mobility.
Electric Sports Utility Vehicle Industry Segmentation
-
1. Vehicle Configuration
-
1.1. Passenger Cars
- 1.1.1. Multi-purpose Vehicle
-
1.1. Passenger Cars
-
2. Fuel Category
- 2.1. BEV
- 2.2. FCEV
- 2.3. HEV
- 2.4. PHEV
Electric Sports Utility Vehicle Industry Segmentation By Geography
-
1. North America
- 1.1. United States
- 1.2. Canada
- 1.3. Mexico
-
2. South America
- 2.1. Brazil
- 2.2. Argentina
- 2.3. Rest of South America
-
3. Europe
- 3.1. United Kingdom
- 3.2. Germany
- 3.3. France
- 3.4. Italy
- 3.5. Spain
- 3.6. Russia
- 3.7. Benelux
- 3.8. Nordics
- 3.9. Rest of Europe
-
4. Middle East & Africa
- 4.1. Turkey
- 4.2. Israel
- 4.3. GCC
- 4.4. North Africa
- 4.5. South Africa
- 4.6. Rest of Middle East & Africa
-
5. Asia Pacific
- 5.1. China
- 5.2. India
- 5.3. Japan
- 5.4. South Korea
- 5.5. ASEAN
- 5.6. Oceania
- 5.7. Rest of Asia Pacific
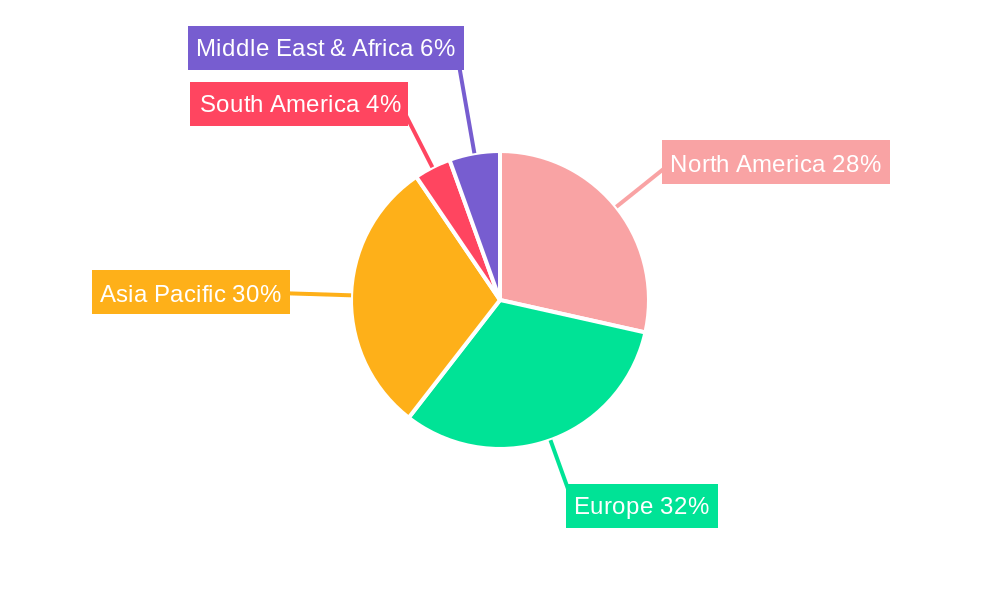
Electric Sports Utility Vehicle Industry Regional Market Share
Geographic Coverage of Electric Sports Utility Vehicle Industry
Electric Sports Utility Vehicle Industry REPORT HIGHLIGHTS
| Aspects | Details |
|---|---|
| Study Period | 2020-2034 |
| Base Year | 2025 |
| Estimated Year | 2026 |
| Forecast Period | 2026-2034 |
| Historical Period | 2020-2025 |
| Growth Rate | CAGR of 13.6% from 2020-2034 |
| Segmentation |
|
Table of Contents
- 1. Introduction
- 1.1. Research Scope
- 1.2. Market Segmentation
- 1.3. Research Objective
- 1.4. Definitions and Assumptions
- 2. Executive Summary
- 2.1. Market Snapshot
- 3. Market Dynamics
- 3.1. Market Drivers
- 3.2. Market Restrains
- 3.3. Market Trends
- 3.4. Market Opportunities
- 4. Market Factor Analysis
- 4.1. Porters Five Forces
- 4.1.1. Bargaining Power of Suppliers
- 4.1.2. Bargaining Power of Buyers
- 4.1.3. Threat of New Entrants
- 4.1.4. Threat of Substitutes
- 4.1.5. Competitive Rivalry
- 4.2. PESTEL analysis
- 4.3. BCG Analysis
- 4.3.1. Stars (High Growth, High Market Share)
- 4.3.2. Cash Cows (Low Growth, High Market Share)
- 4.3.3. Question Mark (High Growth, Low Market Share)
- 4.3.4. Dogs (Low Growth, Low Market Share)
- 4.4. Ansoff Matrix Analysis
- 4.5. Supply Chain Analysis
- 4.6. Regulatory Landscape
- 4.7. Current Market Potential and Opportunity Assessment (TAM–SAM–SOM Framework)
- 4.8. IMR Analyst Note
- 4.1. Porters Five Forces
- 5. Market Analysis, Insights and Forecast 2021-2033
- 5.1. Market Analysis, Insights and Forecast - by Vehicle Configuration
- 5.1.1. Passenger Cars
- 5.1.1.1. Multi-purpose Vehicle
- 5.1.1. Passenger Cars
- 5.2. Market Analysis, Insights and Forecast - by Fuel Category
- 5.2.1. BEV
- 5.2.2. FCEV
- 5.2.3. HEV
- 5.2.4. PHEV
- 5.3. Market Analysis, Insights and Forecast - by Region
- 5.3.1. North America
- 5.3.2. South America
- 5.3.3. Europe
- 5.3.4. Middle East & Africa
- 5.3.5. Asia Pacific
- 5.1. Market Analysis, Insights and Forecast - by Vehicle Configuration
- 6. Global Electric Sports Utility Vehicle Industry Analysis, Insights and Forecast, 2021-2033
- 6.1. Market Analysis, Insights and Forecast - by Vehicle Configuration
- 6.1.1. Passenger Cars
- 6.1.1.1. Multi-purpose Vehicle
- 6.1.1. Passenger Cars
- 6.2. Market Analysis, Insights and Forecast - by Fuel Category
- 6.2.1. BEV
- 6.2.2. FCEV
- 6.2.3. HEV
- 6.2.4. PHEV
- 6.1. Market Analysis, Insights and Forecast - by Vehicle Configuration
- 7. North America Electric Sports Utility Vehicle Industry Analysis, Insights and Forecast, 2020-2032
- 7.1. Market Analysis, Insights and Forecast - by Vehicle Configuration
- 7.1.1. Passenger Cars
- 7.1.1.1. Multi-purpose Vehicle
- 7.1.1. Passenger Cars
- 7.2. Market Analysis, Insights and Forecast - by Fuel Category
- 7.2.1. BEV
- 7.2.2. FCEV
- 7.2.3. HEV
- 7.2.4. PHEV
- 7.1. Market Analysis, Insights and Forecast - by Vehicle Configuration
- 8. South America Electric Sports Utility Vehicle Industry Analysis, Insights and Forecast, 2020-2032
- 8.1. Market Analysis, Insights and Forecast - by Vehicle Configuration
- 8.1.1. Passenger Cars
- 8.1.1.1. Multi-purpose Vehicle
- 8.1.1. Passenger Cars
- 8.2. Market Analysis, Insights and Forecast - by Fuel Category
- 8.2.1. BEV
- 8.2.2. FCEV
- 8.2.3. HEV
- 8.2.4. PHEV
- 8.1. Market Analysis, Insights and Forecast - by Vehicle Configuration
- 9. Europe Electric Sports Utility Vehicle Industry Analysis, Insights and Forecast, 2020-2032
- 9.1. Market Analysis, Insights and Forecast - by Vehicle Configuration
- 9.1.1. Passenger Cars
- 9.1.1.1. Multi-purpose Vehicle
- 9.1.1. Passenger Cars
- 9.2. Market Analysis, Insights and Forecast - by Fuel Category
- 9.2.1. BEV
- 9.2.2. FCEV
- 9.2.3. HEV
- 9.2.4. PHEV
- 9.1. Market Analysis, Insights and Forecast - by Vehicle Configuration
- 10. Middle East & Africa Electric Sports Utility Vehicle Industry Analysis, Insights and Forecast, 2020-2032
- 10.1. Market Analysis, Insights and Forecast - by Vehicle Configuration
- 10.1.1. Passenger Cars
- 10.1.1.1. Multi-purpose Vehicle
- 10.1.1. Passenger Cars
- 10.2. Market Analysis, Insights and Forecast - by Fuel Category
- 10.2.1. BEV
- 10.2.2. FCEV
- 10.2.3. HEV
- 10.2.4. PHEV
- 10.1. Market Analysis, Insights and Forecast - by Vehicle Configuration
- 11. Asia Pacific Electric Sports Utility Vehicle Industry Analysis, Insights and Forecast, 2020-2032
- 11.1. Market Analysis, Insights and Forecast - by Vehicle Configuration
- 11.1.1. Passenger Cars
- 11.1.1.1. Multi-purpose Vehicle
- 11.1.1. Passenger Cars
- 11.2. Market Analysis, Insights and Forecast - by Fuel Category
- 11.2.1. BEV
- 11.2.2. FCEV
- 11.2.3. HEV
- 11.2.4. PHEV
- 11.1. Market Analysis, Insights and Forecast - by Vehicle Configuration
- 12. Competitive Analysis
- 12.1. Company Profiles
- 12.1.1 Stellantis N V
- 12.1.1.1. Company Overview
- 12.1.1.2. Products
- 12.1.1.3. Company Financials
- 12.1.1.4. SWOT Analysis
- 12.1.2 Nissan Motor Co Ltd
- 12.1.2.1. Company Overview
- 12.1.2.2. Products
- 12.1.2.3. Company Financials
- 12.1.2.4. SWOT Analysis
- 12.1.3 General Motors Company
- 12.1.3.1. Company Overview
- 12.1.3.2. Products
- 12.1.3.3. Company Financials
- 12.1.3.4. SWOT Analysis
- 12.1.4 Volkswagen A
- 12.1.4.1. Company Overview
- 12.1.4.2. Products
- 12.1.4.3. Company Financials
- 12.1.4.4. SWOT Analysis
- 12.1.5 Daimler AG (Mercedes-Benz AG)
- 12.1.5.1. Company Overview
- 12.1.5.2. Products
- 12.1.5.3. Company Financials
- 12.1.5.4. SWOT Analysis
- 12.1.6 Hyundai Motor Company
- 12.1.6.1. Company Overview
- 12.1.6.2. Products
- 12.1.6.3. Company Financials
- 12.1.6.4. SWOT Analysis
- 12.1.7 Tesla Inc
- 12.1.7.1. Company Overview
- 12.1.7.2. Products
- 12.1.7.3. Company Financials
- 12.1.7.4. SWOT Analysis
- 12.1.8 BYD Auto Co Ltd
- 12.1.8.1. Company Overview
- 12.1.8.2. Products
- 12.1.8.3. Company Financials
- 12.1.8.4. SWOT Analysis
- 12.1.9 Groupe Renault
- 12.1.9.1. Company Overview
- 12.1.9.2. Products
- 12.1.9.3. Company Financials
- 12.1.9.4. SWOT Analysis
- 12.1.10 Toyota Motor Corporation
- 12.1.10.1. Company Overview
- 12.1.10.2. Products
- 12.1.10.3. Company Financials
- 12.1.10.4. SWOT Analysis
- 12.1.11 Ford Motor Company
- 12.1.11.1. Company Overview
- 12.1.11.2. Products
- 12.1.11.3. Company Financials
- 12.1.11.4. SWOT Analysis
- 12.1.1 Stellantis N V
- 12.2. Market Entropy
- 12.2.1 Company's Key Areas Served
- 12.2.2 Recent Developments
- 12.3. Company Market Share Analysis 2025
- 12.3.1 Top 5 Companies Market Share Analysis
- 12.3.2 Top 3 Companies Market Share Analysis
- 12.4. List of Potential Customers
- 13. Research Methodology
List of Figures
- Figure 1: Global Electric Sports Utility Vehicle Industry Revenue Breakdown (billion, %) by Region 2025 & 2033
- Figure 2: North America Electric Sports Utility Vehicle Industry Revenue (billion), by Vehicle Configuration 2025 & 2033
- Figure 3: North America Electric Sports Utility Vehicle Industry Revenue Share (%), by Vehicle Configuration 2025 & 2033
- Figure 4: North America Electric Sports Utility Vehicle Industry Revenue (billion), by Fuel Category 2025 & 2033
- Figure 5: North America Electric Sports Utility Vehicle Industry Revenue Share (%), by Fuel Category 2025 & 2033
- Figure 6: North America Electric Sports Utility Vehicle Industry Revenue (billion), by Country 2025 & 2033
- Figure 7: North America Electric Sports Utility Vehicle Industry Revenue Share (%), by Country 2025 & 2033
- Figure 8: South America Electric Sports Utility Vehicle Industry Revenue (billion), by Vehicle Configuration 2025 & 2033
- Figure 9: South America Electric Sports Utility Vehicle Industry Revenue Share (%), by Vehicle Configuration 2025 & 2033
- Figure 10: South America Electric Sports Utility Vehicle Industry Revenue (billion), by Fuel Category 2025 & 2033
- Figure 11: South America Electric Sports Utility Vehicle Industry Revenue Share (%), by Fuel Category 2025 & 2033
- Figure 12: South America Electric Sports Utility Vehicle Industry Revenue (billion), by Country 2025 & 2033
- Figure 13: South America Electric Sports Utility Vehicle Industry Revenue Share (%), by Country 2025 & 2033
- Figure 14: Europe Electric Sports Utility Vehicle Industry Revenue (billion), by Vehicle Configuration 2025 & 2033
- Figure 15: Europe Electric Sports Utility Vehicle Industry Revenue Share (%), by Vehicle Configuration 2025 & 2033
- Figure 16: Europe Electric Sports Utility Vehicle Industry Revenue (billion), by Fuel Category 2025 & 2033
- Figure 17: Europe Electric Sports Utility Vehicle Industry Revenue Share (%), by Fuel Category 2025 & 2033
- Figure 18: Europe Electric Sports Utility Vehicle Industry Revenue (billion), by Country 2025 & 2033
- Figure 19: Europe Electric Sports Utility Vehicle Industry Revenue Share (%), by Country 2025 & 2033
- Figure 20: Middle East & Africa Electric Sports Utility Vehicle Industry Revenue (billion), by Vehicle Configuration 2025 & 2033
- Figure 21: Middle East & Africa Electric Sports Utility Vehicle Industry Revenue Share (%), by Vehicle Configuration 2025 & 2033
- Figure 22: Middle East & Africa Electric Sports Utility Vehicle Industry Revenue (billion), by Fuel Category 2025 & 2033
- Figure 23: Middle East & Africa Electric Sports Utility Vehicle Industry Revenue Share (%), by Fuel Category 2025 & 2033
- Figure 24: Middle East & Africa Electric Sports Utility Vehicle Industry Revenue (billion), by Country 2025 & 2033
- Figure 25: Middle East & Africa Electric Sports Utility Vehicle Industry Revenue Share (%), by Country 2025 & 2033
- Figure 26: Asia Pacific Electric Sports Utility Vehicle Industry Revenue (billion), by Vehicle Configuration 2025 & 2033
- Figure 27: Asia Pacific Electric Sports Utility Vehicle Industry Revenue Share (%), by Vehicle Configuration 2025 & 2033
- Figure 28: Asia Pacific Electric Sports Utility Vehicle Industry Revenue (billion), by Fuel Category 2025 & 2033
- Figure 29: Asia Pacific Electric Sports Utility Vehicle Industry Revenue Share (%), by Fuel Category 2025 & 2033
- Figure 30: Asia Pacific Electric Sports Utility Vehicle Industry Revenue (billion), by Country 2025 & 2033
- Figure 31: Asia Pacific Electric Sports Utility Vehicle Industry Revenue Share (%), by Country 2025 & 2033
List of Tables
- Table 1: Global Electric Sports Utility Vehicle Industry Revenue billion Forecast, by Vehicle Configuration 2020 & 2033
- Table 2: Global Electric Sports Utility Vehicle Industry Revenue billion Forecast, by Fuel Category 2020 & 2033
- Table 3: Global Electric Sports Utility Vehicle Industry Revenue billion Forecast, by Region 2020 & 2033
- Table 4: Global Electric Sports Utility Vehicle Industry Revenue billion Forecast, by Vehicle Configuration 2020 & 2033
- Table 5: Global Electric Sports Utility Vehicle Industry Revenue billion Forecast, by Fuel Category 2020 & 2033
- Table 6: Global Electric Sports Utility Vehicle Industry Revenue billion Forecast, by Country 2020 & 2033
- Table 7: United States Electric Sports Utility Vehicle Industry Revenue (billion) Forecast, by Application 2020 & 2033
- Table 8: Canada Electric Sports Utility Vehicle Industry Revenue (billion) Forecast, by Application 2020 & 2033
- Table 9: Mexico Electric Sports Utility Vehicle Industry Revenue (billion) Forecast, by Application 2020 & 2033
- Table 10: Global Electric Sports Utility Vehicle Industry Revenue billion Forecast, by Vehicle Configuration 2020 & 2033
- Table 11: Global Electric Sports Utility Vehicle Industry Revenue billion Forecast, by Fuel Category 2020 & 2033
- Table 12: Global Electric Sports Utility Vehicle Industry Revenue billion Forecast, by Country 2020 & 2033
- Table 13: Brazil Electric Sports Utility Vehicle Industry Revenue (billion) Forecast, by Application 2020 & 2033
- Table 14: Argentina Electric Sports Utility Vehicle Industry Revenue (billion) Forecast, by Application 2020 & 2033
- Table 15: Rest of South America Electric Sports Utility Vehicle Industry Revenue (billion) Forecast, by Application 2020 & 2033
- Table 16: Global Electric Sports Utility Vehicle Industry Revenue billion Forecast, by Vehicle Configuration 2020 & 2033
- Table 17: Global Electric Sports Utility Vehicle Industry Revenue billion Forecast, by Fuel Category 2020 & 2033
- Table 18: Global Electric Sports Utility Vehicle Industry Revenue billion Forecast, by Country 2020 & 2033
- Table 19: United Kingdom Electric Sports Utility Vehicle Industry Revenue (billion) Forecast, by Application 2020 & 2033
- Table 20: Germany Electric Sports Utility Vehicle Industry Revenue (billion) Forecast, by Application 2020 & 2033
- Table 21: France Electric Sports Utility Vehicle Industry Revenue (billion) Forecast, by Application 2020 & 2033
- Table 22: Italy Electric Sports Utility Vehicle Industry Revenue (billion) Forecast, by Application 2020 & 2033
- Table 23: Spain Electric Sports Utility Vehicle Industry Revenue (billion) Forecast, by Application 2020 & 2033
- Table 24: Russia Electric Sports Utility Vehicle Industry Revenue (billion) Forecast, by Application 2020 & 2033
- Table 25: Benelux Electric Sports Utility Vehicle Industry Revenue (billion) Forecast, by Application 2020 & 2033
- Table 26: Nordics Electric Sports Utility Vehicle Industry Revenue (billion) Forecast, by Application 2020 & 2033
- Table 27: Rest of Europe Electric Sports Utility Vehicle Industry Revenue (billion) Forecast, by Application 2020 & 2033
- Table 28: Global Electric Sports Utility Vehicle Industry Revenue billion Forecast, by Vehicle Configuration 2020 & 2033
- Table 29: Global Electric Sports Utility Vehicle Industry Revenue billion Forecast, by Fuel Category 2020 & 2033
- Table 30: Global Electric Sports Utility Vehicle Industry Revenue billion Forecast, by Country 2020 & 2033
- Table 31: Turkey Electric Sports Utility Vehicle Industry Revenue (billion) Forecast, by Application 2020 & 2033
- Table 32: Israel Electric Sports Utility Vehicle Industry Revenue (billion) Forecast, by Application 2020 & 2033
- Table 33: GCC Electric Sports Utility Vehicle Industry Revenue (billion) Forecast, by Application 2020 & 2033
- Table 34: North Africa Electric Sports Utility Vehicle Industry Revenue (billion) Forecast, by Application 2020 & 2033
- Table 35: South Africa Electric Sports Utility Vehicle Industry Revenue (billion) Forecast, by Application 2020 & 2033
- Table 36: Rest of Middle East & Africa Electric Sports Utility Vehicle Industry Revenue (billion) Forecast, by Application 2020 & 2033
- Table 37: Global Electric Sports Utility Vehicle Industry Revenue billion Forecast, by Vehicle Configuration 2020 & 2033
- Table 38: Global Electric Sports Utility Vehicle Industry Revenue billion Forecast, by Fuel Category 2020 & 2033
- Table 39: Global Electric Sports Utility Vehicle Industry Revenue billion Forecast, by Country 2020 & 2033
- Table 40: China Electric Sports Utility Vehicle Industry Revenue (billion) Forecast, by Application 2020 & 2033
- Table 41: India Electric Sports Utility Vehicle Industry Revenue (billion) Forecast, by Application 2020 & 2033
- Table 42: Japan Electric Sports Utility Vehicle Industry Revenue (billion) Forecast, by Application 2020 & 2033
- Table 43: South Korea Electric Sports Utility Vehicle Industry Revenue (billion) Forecast, by Application 2020 & 2033
- Table 44: ASEAN Electric Sports Utility Vehicle Industry Revenue (billion) Forecast, by Application 2020 & 2033
- Table 45: Oceania Electric Sports Utility Vehicle Industry Revenue (billion) Forecast, by Application 2020 & 2033
- Table 46: Rest of Asia Pacific Electric Sports Utility Vehicle Industry Revenue (billion) Forecast, by Application 2020 & 2033
Frequently Asked Questions
1. What is the projected Compound Annual Growth Rate (CAGR) of the Electric Sports Utility Vehicle Industry?
The projected CAGR is approximately 13.6%.
2. Which companies are prominent players in the Electric Sports Utility Vehicle Industry?
Key companies in the market include Stellantis N V, Nissan Motor Co Ltd, General Motors Company, Volkswagen A, Daimler AG (Mercedes-Benz AG), Hyundai Motor Company, Tesla Inc, BYD Auto Co Ltd, Groupe Renault, Toyota Motor Corporation, Ford Motor Company.
3. What are the main segments of the Electric Sports Utility Vehicle Industry?
The market segments include Vehicle Configuration, Fuel Category.
4. Can you provide details about the market size?
The market size is estimated to be USD 223.06 billion as of 2022.
5. What are some drivers contributing to market growth?
Increasing Air Pollution Awareness and Health Concern is Driving the Demand.
6. What are the notable trends driving market growth?
OTHER KEY INDUSTRY TRENDS COVERED IN THE REPORT.
7. Are there any restraints impacting market growth?
High Cost of Installation Related to Industrial Robots.
8. Can you provide examples of recent developments in the market?
December 2023: Mustang Mach-E has electric all-wheel drive and standard heated seats and a steering wheel.November 2023: Ford motors and manufacturers 2030 have entered into a strategic Partnerships to help its suppliers achieve their CO2 reduction targets in line with Ford Motor Co.'s global objective of becoming carbon neutral by 2050.November 2023: Hyundai Motor's Genesis division has opened a new showroom in New York, the United States.
9. What pricing options are available for accessing the report?
Pricing options include single-user, multi-user, and enterprise licenses priced at USD 3800, USD 4500, and USD 5800 respectively.
10. Is the market size provided in terms of value or volume?
The market size is provided in terms of value, measured in billion.
11. Are there any specific market keywords associated with the report?
Yes, the market keyword associated with the report is "Electric Sports Utility Vehicle Industry," which aids in identifying and referencing the specific market segment covered.
12. How do I determine which pricing option suits my needs best?
The pricing options vary based on user requirements and access needs. Individual users may opt for single-user licenses, while businesses requiring broader access may choose multi-user or enterprise licenses for cost-effective access to the report.
13. Are there any additional resources or data provided in the Electric Sports Utility Vehicle Industry report?
While the report offers comprehensive insights, it's advisable to review the specific contents or supplementary materials provided to ascertain if additional resources or data are available.
14. How can I stay updated on further developments or reports in the Electric Sports Utility Vehicle Industry?
To stay informed about further developments, trends, and reports in the Electric Sports Utility Vehicle Industry, consider subscribing to industry newsletters, following relevant companies and organizations, or regularly checking reputable industry news sources and publications.
Methodology
Step 1 - Identification of Relevant Samples Size from Population Database


Step 2 - Approaches for Defining Global Market Size (Value, Volume* & Price*)

Note*: In applicable scenarios
Step 3 - Data Sources
Primary Research
- Web Analytics
- Survey Reports
- Research Institute
- Latest Research Reports
- Opinion Leaders
Secondary Research
- Annual Reports
- White Paper
- Latest Press Release
- Industry Association
- Paid Database
- Investor Presentations

Step 4 - Data Triangulation
Involves using different sources of information in order to increase the validity of a study
These sources are likely to be stakeholders in a program - participants, other researchers, program staff, other community members, and so on.
Then we put all data in single framework & apply various statistical tools to find out the dynamic on the market.
During the analysis stage, feedback from the stakeholder groups would be compared to determine areas of agreement as well as areas of divergence